Herschel-HIFI observations of high-J CO lines in the NGC 1333 low-mass star-forming region††thanks: Herschel is an ESA space observatory with science instruments provided by European-led Principal Investigator consortia and with important participation from NASA.
Abstract
Herschel-HIFI observations of high- lines (up to =10) of 12CO, 13CO and C18O are presented toward three deeply embedded low-mass protostars, NGC~1333 IRAS~2A, IRAS~4A, and IRAS~4B, obtained as part of the Water In Star-forming regions with Herschel (WISH) key program. The spectrally-resolved HIFI data are complemented by ground-based observations of lower- CO and isotopologue lines. The 12CO 10–9 profiles are dominated by broad (FWHM 25–30 km s-1) emission. Radiative transfer models are used to constrain the temperature of this shocked gas to 100–200 K. Several CO and 13CO line profiles also reveal a medium-broad component (FWHM 5–10 km s-1), seen prominently in H2O lines. Column densities for both components are presented, providing a reference for determining abundances of other molecules in the same gas. The narrow C18O 9–8 lines probe the warmer part of the quiescent envelope. Their intensities require a jump in the CO abundance at an evaporation temperature around 25 K, thus providing new direct evidence for a CO ice evaporation zone around low-mass protostars.
Key Words.:
Astrochemistry –– Stars: formation –– ISM: individual objects: NGC 1333 –– ISM: jets and outflows –– ISM: molecules1 Introduction
The earliest protostellar phase just after cloud collapse – the so-called Class 0 phase – is best studied at mid-infrared and longer wavelengths (André et al. 2000). To understand the physical and chemical evolution of low-mass protostars, in particular the relative importance of radiative heating and shocks in their energy budget, observations are required that can separate these components. The advent of the Heterodyne Instrument for the Far-Infrared (HIFI) on Herschel opens up the possibility to obtain spectrally resolved data from higher-frequency lines that are sensitive to gas temperatures up to several hundred Kelvin.
Because of its high abundance and strong lines, CO is the primary molecule to probe the various components of protostellar systems (envelope, outflow, disk). The main advantage of CO compared with other molecules (including water) is that its chemistry is simple, with most carbon locked up in CO in dense clouds. Also, its evaporation temperature is low, around 20 K for pure CO ice (Collings et al. 2003; Öberg et al. 2005), so that its freeze-out zone is much smaller than that of water. Most ground-based observations of CO and its isotopologues have been limited to the lowest rotational lines originating from levels up to 35 K. ISO has detected strong far-infrared CO lines up to =29 from Class 0 sources (Giannini et al. 2001) but the emission is spatially unresolved in the large 80 beam. ISO also lacked the spectral resolution needed to separate the shocked and quiescent gas or to detect intrinsically-weaker 13CO and C18O lines on top of the strong continuum.
The NGC 1333 region in Perseus ( pc; Hirota et al. 2008) contains several deeply embedded Class 0 sources within a 1 pc region driving powerful outflows (e.g., Liseau et al. 1988; Hatchell & Fuller 2008). The protostars IRAS 4A and 4B, separated by 31, and IRAS 2A are prominent submillimeter continuum sources (luminosities of 5.8, 3.8 and 20 ) with envelope masses of 4.5, 2.9 and 1.0 , respectively (Sandell et al. 1991; Jørgensen et al. 2009). All three are among the brightest and best studied low-mass sources in terms of molecular lines, with several complex molecules detected (e.g., Blake et al. 1995; Bottinelli et al. 2007). Here HIFI data of CO and its isotopologues are presented for these three sources and used to quantify the different physical components. In an accompanying letter, Kristensen et al. (2010) present complementary HIFI observations of H2O and analyze CO/H2O abundance ratios.
2 Observations and results
The NGC 1333 data were obtained with HIFI (de Graauw et al. 2010) onboard the Herschel Space Observatory (Pilbratt et al. 2010), in the context of the WISH key program (van Dishoeck et al. in prep.). Single pointings at the three source positions were carried out between 2010 March 3 and 15 during the Herschel HIFI priority science program (PSP). Spectral lines were observed in dual-beam switch (DBS) mode in HIFI bands 1a, 4a, 4b, and 5a with a chop reference position located 3 from the source positions. The observed positions (J2000) are: IRAS 2A: , ; IRAS 4A: , ; and IRAS 4B: , (Jørgensen et al. 2009).
| Mol. | Trans. | Frequency | Tel./Inst. | Beam | Ref. | |
|---|---|---|---|---|---|---|
| (K) | (GHz) | size () | ||||
| CO | 2–1 | 16.6 | 230.538 | JCMT | 22 | 1 |
| 4–3 | 55.3 | 461.041 | JCMT | 11 | 2 | |
| 6–5 | 116.2 | 691.473 | APEX | 9 | 3 | |
| 10–9 | 304.2 | 1151.985 | HIFI-5a | 20 | 4 | |
| O | 10–9 | 290.8 | 1101.349 | HIFI-4b | 21 | 4 |
| C | 1–0 | 5.3 | 109.782 | Onsala | 34 | 1 |
| 2–1 | 15.8 | 219.560 | JCMT | 23 | 1 | |
| 3–2 | 31.6 | 329.331 | JCMT | 15 | 1 | |
| 5–4 | 79.0 | 548.831 | HIFI-1a | 42 | 4 | |
| 6–5 | 110.6 | 658.553 | APEX | 10 | 3 | |
| 9–8 | 237.0 | 987.560 | HIFI-4a | 23 | 4 | |
| 10–9 | 289.7 | 1097.162 | HIFI-4b | 21 | 4 |
(1) Jørgensen et al. (2002); (2) JCMT archive; (3) Yıldız et al. (in prep.); (4) this work
Table 1 summarizes the lines observed with HIFI together with complementary lower- lines obtained with ground-based telescopes. The Herschel data were taken using the wide band spectrometer (WBS) and high resolution spectrometer (HRS) backends. Owing to the higher noise ( more) in HRS than WBS, mainly WBS data are presented here. Only the narrow C 5–4 lines use the HRS data. Integration times (on+off) are 10, 20, 30, 40, and 60 minutes for the O 10–9, C 9–8, 10–9, 10–9, and C 5–4 lines respectively. The HIFI beam sizes correspond to 20 (4700 AU) at 1152 GHz and 42 (10000 AU) at 549 GHz. Except for the O 10–9 line, all isotopologue lines were observed together with H2O lines.
The calibration uncertainty for the HIFI data is of the order of 20 and
the pointing accuracy is around 2. The measured line
intensities were converted to the main-beam brightness temperatures
by using a
beam efficiency for all HIFI lines.
Data processing started from the standard HIFI pipeline in the
Herschel interactive processing environment
(HIPE111HIPE is a joint development by the Herschel Science
Ground Segment Consortium, consisting of ESA, the NASA Herschel
Science Center, and the HIFI, PACS and SPIRE consortia.) ver. 3.0.1
(Ott et al. 2010), where the precision is
of the order of a few m s-1.
Further reduction and analysis were done using the
GILDAS-CLASS222http://www.iram.fr/IRAMFR/GILDAS/
software. The spectra from the H- and V-polarizations were averaged in
order to obtain a better . In some cases a discrepancy of 30%
was found between the two polarizations, in which case only the H band
spectra were used for analysis since their rms is lower.
Complementary ground-based spectral line observations of O 6–5 were obtained at the 12-m Atacama Pathfinder Experiment Telescope (APEX), using the CHAMP+ 27 pixel array receiver (Güsten et al. 2008). The lower- spectral lines were obtained from the James Clerk Maxwell Telescope (JCMT) archive and from Jørgensen et al. (2002). Details will be presented elsewhere (Yıldız et al., in prep.).
| Source | Mol. | Trans. | rmsa𝑎aa𝑎aIn 0.5 km s-1 bins. | ||
|---|---|---|---|---|---|
| (K km s-1) | (K) | (K) | |||
| IRAS 2A | CO | 2–1 | 127.5 | 20.5 | 0.08 |
| 4–3 | 177.2 | 23.8 | 0.44 | ||
| 6–5 | 57.0 | 5.9 | 0.11 | ||
| 10–9 | 16.3 | 1.71 | 0.078 | ||
| 10–9 | 0.4 | 0.3 | 0.026 | ||
| C | 1–0 | 5.6 | 4.0 | 0.27 | |
| 2–1 | 5.83 | 2.3 | 0.15 | ||
| 3–2 | 4.7 | 3.2 | 0.13 | ||
| 5–4 | 0.62 | 0.46 | 0.004 | ||
| 6–5 | 1.8 | 1.1 | 0.11 | ||
| 9–8 | 0.2 | 0.07 | 0.018 | ||
| 10–9 | 0.15 | 0.06 | 0.017 | ||
| IRAS 4A | CO | 2–1 | 117.2 | 18.4 | 0.07 |
| 4–3 | 221.1 | 23.3 | 0.32 | ||
| 6–5 | 121.9 | 13.2 | 0.59 | ||
| 10–9 | 35.7 | 1.9 | 0.073 | ||
| 10–9 | 1.2 | 0.2 | 0.017 | ||
| C | 2–1 | 4.3 | 2.3 | 0.09 | |
| 5–4 | 0.5 | 0.26 | 0.005 | ||
| 9–8 | 0.1 | 0.05 | 0.018 | ||
| IRAS 4B | CO | 2–1 | 54.8 | 13.9 | 0.07 |
| 4–3 | 115.2 | 14.6 | 0.26 | ||
| 6–5 | 43.3 | 7.3 | 0.36 | ||
| 10–9 | 26.8 | 2.6 | 0.076 | ||
| 10–9 | 0.7 | 0.15 | 0.017 | ||
| C | 2–1 | 4.9 | 2.5 | 0.19 | |
| 5–4 | 0.23 | 0.12 | 0.005 | ||
| 9–8 | 0.07 | - | 0.019 |
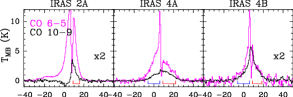
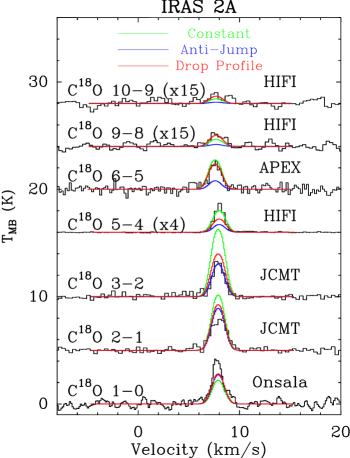
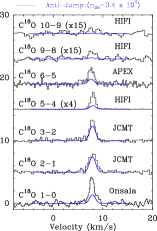
The observed line profiles are presented in Fig. 1 and the corresponding line intensities in Table 2. For the 12CO 10–9 toward IRAS 2A, the emission from the blue line wing was chopped out due to emission at the reference position located in the blue part of the SVS 13 outflow. A Gaussian fitted to the red component of the line was used to obtain the integrated intensity.
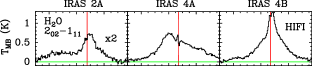
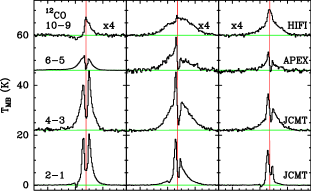
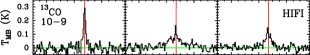
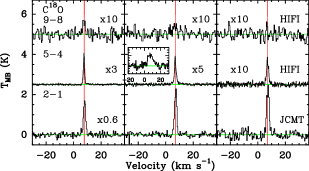
Kristensen et al. (2010) identify three components in the H2O line profiles centered close to the source velocities: a broad underlying emission profile (Gaussian with FWHM 25–30 km s-1), a medium-broad emission profile (FWHM 5–10 km s-1), and narrow self-absorption lines (FWHM 2–3 km s-1); see the H2O – lines in Fig. 1. The same components are also seen in the CO line profiles, albeit less prominently than for H2O. The broad component dominates the 12CO 10–9 lines of IRAS 4A and 4B and is also apparent in the deep 12CO 6–5 spectrum of IRAS 2A (Fig. 2). The medium component is best seen in the 13CO 10–9 profiles of IRAS 4A and 4B and as the red wing of the 12CO 10–9 profile for IRAS 2A. A blow-up of the very high spectrum of C18O 5–4 for IRAS 4A (insert in Fig. 1) also reveals a weak C18O medium-broad profile. The narrow component is clearly observed in C18O emission and 12CO low- self-absorption. Kristensen et al. (2010) interpret the broad component as shocked gas along the outflow cavity walls, the medium component as smaller-scale shocks created by the outflow in the inner (1000 AU) dense envelope, and the narrow component as the quiescent envelope, respectively.
3 Analysis and discussion
3.1 Broad and medium components: shocked gas
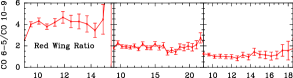
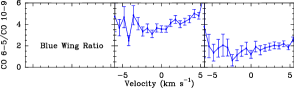
To quantify the physical properties of the broad outflow component,
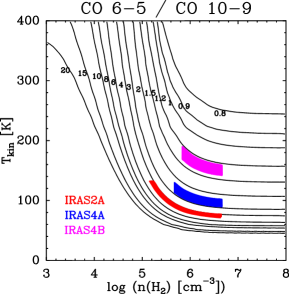
line ratios are determined for the wings of the line profiles. Figure
2 shows the
6–5/ 10–9 ratio as a function of velocity.
The APEX-CHAMP+ 6–5 maps of IRAS 4A and 4B
from Yıldız et al. (in prep.) and IRAS 2A from
van Kempen et al. (2009) are resampled
to a 20 beam so that both lines refer to the same beam. The
ratios are compared with model non-LTE excitation line intensities
calculated using the RADEX code (van der Tak et al. 2007)
(Fig. 4, Online Appendix A). The density within a
20 diameter is taken to be 105 cm-3 based on the
modeling results of Jørgensen et al. (2002, see also Sect. 3.3 and Appendix A).
The detection of medium-broad 10–9 emission by
Jørgensen et al. (2005b) toward IRAS 4A and 4B indicates densities of the order of
a few cm-3. For the range of densities indicated in
Fig. 4, the line ratios
imply high temperatures: IRAS 2A, 70–130 K;
IRAS 4A, 90–120 K; and IRAS 4B,
140–180 K.
The optical depth of the emission is constrained by the 10–9/ 10–9 ratios. For IRAS 4B, the optical depth of the line wings is found to drop with velocity, ranging from 12 near the center to 0.4 at the highest velocities where is detected. This justifies the assumption that the broad 10–9 lines are optically thin. Total CO column densities in the broad component for these conditions are 4 and 1 cm-2 for IRAS 4A and 4B, respectively. For IRAS 2A, the broad column density is calculated from the CO 6–5 spectrum as 6 cm-2. Using /H2 = gives the H2 column densities listed in Table 3.
The medium component attributed to small-scale shocks in the inner envelope can be probed directly by the 10–9 data for IRAS 4A and 4B. For IRAS 2A, the Gaussian fit to the red wing of the 12CO 10–9 is used. By assuming a similar range of temperatures and densities as for the broad component, beam averaged column densities of 2, 6, and 2 cm-2 are found for IRAS 2A, 4A, and 4B respectively, if the lines are optically thin and using 12C/13C = 65. The very weak medium component found in the C18O 5–4 profile for IRAS 4A agrees with this value if the emission arises from a compact (few ) source. Assuming CO/H2=10-4 leads to the numbers in Table 3. The overall uncertainty in all column densities is a factor of 2 due to the range of physical conditions used to derive them and uncertainties in the adopted CO/H2 ratio and calibration. The total amount of shocked gas is 1% of the total gas column density in the beam for each source (Jørgensen et al. 2002).
3.2 Narrow component: bulk warm envelope
| Source | Broad Comp. | Medium Comp. |
|---|---|---|
| IRAS 2A | a𝑎aa𝑎aCO 6–5 | b𝑏bb𝑏bCO 10–9 |
| IRAS 4A | b𝑏bb𝑏bCO 10–9 | c𝑐cc𝑐c13CO 10–9 spectra. |
| IRAS 4B | b𝑏bb𝑏bCO 10–9 | c𝑐cc𝑐c13CO 10–9 spectra. |
Obtained from , ,
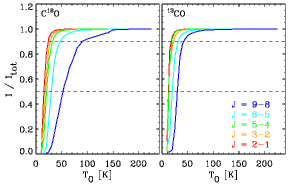
The narrow width of the C18O emission clearly indicates an origin in the quiescent envelope. Naïvely, one would associate emission coming from a level with = 237 K (9–8) with the warm gas in the innermost part of the envelope. To test this hypothesis, a series of envelope models was run with varying CO abundance profiles. The models were constructed assuming a power-law density structure and then calculating the temperature structure by fitting both the far-infrared spectral energy distribution and the submillimeter spatial extent (Jørgensen et al. 2002). Figure 3 compares the fractional line intensities for the C18O and 13CO transitions in a spherical envelope model for IRAS 2A as a function of temperature. In these models, the abundance in the outer envelope was kept high, = with respect to H2 (all available gas-phase carbon in CO), decreasing by a factor of 1000 at temperatures higher than a specific temperature, (a so-called ‘anti-jump’ model (see Schöier et al. 2004, for nomenclature). These models thereby give an estimate of the fraction of the line emission for a given transition (in the respective telescope beams) which has its origin at temperatures lower than .
For C18O, 90% of the emission in the transitions up to and including the 5–4 HIFI transition has its origin at temperatures lower than 25–30 K, meaning that these transitions are predominantly sensitive to the outer parts of the protostellar envelope. The 9–8 transition is more sensitive to the warm parts of the envelope, but still 50% of the line flux appears to come from the outer envelope with temperatures less than 50 K. The 13CO transitions become rapidly optically thick in the outer envelopes: even for the 9–8 transition, 90% of the line flux can be associated with the envelope material with temperatures lower than 40 K.
The C18O 9–8 line is clearly a much more sensitive probe of a CO ice evaporation zone than any other observed CO line. Jørgensen et al. (2005c) showed that the low- C18O lines require a drop in the abundance at densities higher than cm-3 due to freeze-out. However, they did not have strong proof for CO evaporation in the inner part from that dataset. Using the temperature and density structure for IRAS 2A as described above, we computed the C18O line intensities in the respective telescope beams following the method by Jørgensen et al. (2005c). In this ‘anti-jump’ model, the outer C18O abundance is kept fixed at , whereas the inner abundance and the freeze-out density are free parameters. A fit to only the C18O 1–0, 2–1 and 3–2 lines gives best-fit values of and cm-3, consistent with those of Jørgensen et al. (2005c). However, this model underproduces the higher- lines by a factor of 3–4 (Fig. 6 in Appendix B).
To solve this underproduction, the inner abundance has to be increased in a so-called ‘drop-abundance’ profile. The fit parameters are now the inner abundance and the evaporation temperature , keeping and fixed at the above values. Figure 9 in Appendix B shows the plots to the C18O 6–5 and 9–8 lines. The evaporation temperature is not well constrained, but low temperatures of 25 K are favored because they produce more C18O 5–4 emission. The best-fit indicates a jump of a factor of 5 compared with . Alternatively, can be kept fixed at 25 K and both and can be varied by fitting all five lines simultaneously. In this case, the same best-fit value for is found but only an upper limit on of . Thus, for this physical model, , implying that a jump in the abundance is needed for IRAS 2A.
4 Conclusions
Spectrally resolved Herschel-HIFI observations of high- CO lines up to 10–9 and C 9–8 have been performed toward three low-mass young stellar objects for the first time. These data provide strong constraints on the density and temperature in the various physical components, such as the quiescent envelope, extended outflowing gas, and small-scale shocks in the inner envelope. The derived column densities and temperatures are important for comparison with water and other molecules such as O2, for which HIFI observations are planned. Furthermore, it is shown conclusively that in order to reproduce higher- C18O lines within the context of the adopted physical model, a jump in the CO abundance due to evaporation is required in the inner envelope, something that was inferred, but not measured, from ground-based observations. Combination with even higher- lines to be obtained with Herschel-PACS in the frame of the WISH key program will allow further quantification of the different physical processes invoked to explain the origin of the high- emission.
References
- André et al. (2000) André, P., Ward-Thompson, D., & Barsony, M. 2000, Protostars & Planets IV, 59
- Bergin & Snell (2002) Bergin, E. A. & Snell, R. L. 2002, ApJ, 581, L105
- Blake et al. (1995) Blake, G. A., Sandell, G., van Dishoeck, E. F., et al. 1995, ApJ, 441, 689
- Bottinelli et al. (2007) Bottinelli, S., Ceccarelli, C., Williams, J. P., & Lefloch, B. 2007, A&A, 463, 601
- Chiang et al. (2008) Chiang, H., Looney, L. W., Tassis, K., Mundy, L. G., & Mouschovias, T. C. 2008, ApJ, 680, 474
- Collings et al. (2003) Collings, M. P., Dever, J. W., Fraser, H. J., McCoustra, M. R. S., & Williams, D. A. 2003, ApJ, 583, 1058
- de Graauw et al. (2010) de Graauw, T., Helmich, F. P., Phillips, T. G., et al. 2010, A&A, 518, L6
- Giannini et al. (2001) Giannini, T., Nisini, B., & Lorenzetti, D. 2001, ApJ, 555, 40
- Güsten et al. (2008) Güsten, R., Baryshev, A., Bell, A., et al. 2008, in SPIE Conf. Ser., Vol. 7020
- Hatchell & Fuller (2008) Hatchell, J. & Fuller, G. A. 2008, A&A, 482, 855
- Hirota et al. (2008) Hirota, T., Bushimata, T., Choi, Y. K., et al. 2008, PASJ, 60, 37
- Hogerheijde & van der Tak (2000) Hogerheijde, M. R. & van der Tak, F. F. S. 2000, A&A, 362, 697
- Ivezić & Elitzur (1997) Ivezić, Z. & Elitzur, M. 1997, MNRAS, 287, 799
- Jørgensen et al. (2005a) Jørgensen, J. K., Bourke, T. L., Myers, P. C., et al. 2005a, ApJ, 632, 973
- Jørgensen et al. (2002) Jørgensen, J. K., Schöier, F. L., & van Dishoeck, E. F. 2002, A&A, 389, 908
- Jørgensen et al. (2005b) Jørgensen, J. K., Schöier, F. L., & van Dishoeck, E. F. 2005b, A&A, 437, 501
- Jørgensen et al. (2005c) Jørgensen, J. K., Schöier, F. L., & van Dishoeck, E. F. 2005c, A&A, 435, 177
- Jørgensen et al. (2009) Jørgensen, J. K., van Dishoeck, E. F., Visser, R., et al. 2009, A&A, 507, 861
- Kristensen et al. (2010) Kristensen et al. 2010, A&A, this volume
- Lacy et al. (1994) Lacy, J. H., Knacke, R., Geballe, T. R., & Tokunaga, A. T. 1994, ApJ, 428, L69
- Liseau et al. (1988) Liseau, R., Sandell, G., & Knee, L. B. G. 1988, A&A, 192, 153
- Öberg et al. (2005) Öberg, K. I., van Broekhuizen, F., Fraser, H. J., et al. 2005, ApJ, 621, L33
- Ott et al. (2010) Ott et al. 2010, ASP Conf Series, in press
- Pilbratt et al. (2010) Pilbratt, G. L., Riedinger, J. R., Passvogel, T., et al. 2010, A&A, 518, L1
- Sandell et al. (1991) Sandell, G., Aspin, C., Duncan, W. D., Russell, A. P. G., & Robson, E. I. 1991, ApJ, 376, L17
- Schöier et al. (2004) Schöier, F. L., Jørgensen, J. K., van Dishoeck, E. F., & Blake, G. A. 2004, A&A, 418, 185
- Tafalla et al. (2004) Tafalla, M., Myers, P. C., Caselli, P., & Walmsley, C. M. 2004, A&A, 416, 191
- van der Tak et al. (2007) van der Tak, F. F. S., Black, J. H., Schöier, F. L., Jansen, D. J., & van Dishoeck, E. F. 2007, A&A, 468, 627
- van Kempen et al. (2009) van Kempen, T. A., van Dishoeck, E. F., Güsten, R., et al. 2009, A&A, 507, 1425
- Volgenau et al. (2006) Volgenau, N. H., Mundy, L. G., Looney, L. W., & Welch, W. J. 2006, ApJ, 651, 301
- Yang et al. (2010) Yang, B., Stancil, P. C., Balakrishnan, N., & Forrey, R. C. 2010, ApJ, 718, 1062
Acknowledgements.
The authors are grateful to many funding agencies and the HIFI-ICC staff who has been contributing for the construction of Herschel and HIFI for many years. HIFI has been designed and built by a consortium of institutes and university departments from across Europe, Canada and the United States under the leadership of SRON Netherlands Institute for Space Research, Groningen, The Netherlands and with major contributions from Germany, France and the US. Consortium members are: Canada: CSA, U.Waterloo; France: CESR, LAB, LERMA, IRAM; Germany: KOSMA, MPIfR, MPS; Ireland, NUI Maynooth; Italy: ASI, IFSI-INAF, Osservatorio Astrofisico di Arcetri- INAF; Netherlands: SRON, TUD; Poland: CAMK, CBK; Spain: Observatorio Astronómico Nacional (IGN), Centro de Astrobiología (CSIC-INTA). Sweden: Chalmers University of Technology - MC2, RSS GARD; Onsala Space Observatory; Swedish National Space Board, Stockholm University - Stockholm Observatory; Switzerland: ETH Zurich, FHNW; USA: Caltech, JPL, NHSC.Appendix A Radex model
Figure 4 shows the CO 6–5/10–9 line ratios for a slab model with a range of temperatures and densities.
Appendix B Abundance profiles for IRAS 2A
Among the three sources, IRAS 2A has been selected for detailed CO
abundance profile modeling because more data are available on this
source, and because its physical and chemical structure has been well
characterized through the high angular resolution submillimeter single
dish and interferometric observations of
Jørgensen et al. (2002, 2005a). The physical parameters are taken
from the continuum modeling results of Jørgensen et al. (2002). In that
paper, the 1D dust radiative transfer code DUSTY
(Ivezić & Elitzur 1997) was used assuming a power law to describe the
density gradient. The dust temperature as function of radius was
calculated self-consistently through radiative transfer given a
central source luminosity. Best-fit model parameters were obtained by
comparison with the spectral energy distribution and the submillimeter
continuum spatial extent. The resulting envelope structure parameters
are used as input to the Ratran radiative transfer modeling
code (Hogerheijde & van der Tak 2000) to model the CO line intensities for a
given CO abundance structure through the envelope. The model
extends to 11000 AU from the protostar, where the density has dropped
to cm-3. The CO-H2 collisional rate
coefficients of Yang et al. (2010) have been adopted.
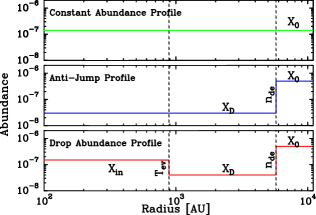
The C18O lines are used to determine the CO abundance structure because the lines of this isotopologue are largely optically thin and because they have well-defined Gaussian line shapes originating from the quiescent envelope without strong contaminations from outflows. Three types of abundance profiles are examined, namely ‘constant’, ‘anti-jump’ and ‘drop’ abundance profiles. Illustrative models are shown in Fig. 5 and the results from these models are summarized in Table 5.
.
| Profile | |||||
|---|---|---|---|---|---|
| (K) | (cm-3) | ||||
| Constant | - | - | - | - | 1.410-7 |
| Anti-jump | - | - | 3 10-8 | 7104 | 510-7 |
| Drop | 1.510-7 | 25 | 410-8 | 7104 | 510-7 |
B.1 Constant abundance model
The simplest approach is to adopt a constant abundance across the entire envelope. However, with this approach, and within the framework of the adopted source model, it is not possible to simultaneously reproduce all line intensities. This was already shown by Jørgensen et al. (2005c). For lower abundances it is possible to reproduce the lower- lines, while higher abundances are required for higher- lines. In Fig. 6 the C18O spectra of a constant-abundance profile are shown for an abundance of =1.410-7, together with the observed spectra of IRAS 2A. Based on these results, the constant-abundance profile is ruled out for all three sources.
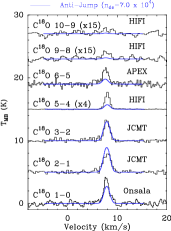
B.2 Anti-jump abundance models
The anti-jump model is commonly adopted in models of pre-stellar cores without a central heating source (e.g., Bergin & Snell 2002; Tafalla et al. 2004). Following Jørgensen et al. (2005c), an anti-jump abundance profile was employed by varying the desorption density, , and inner abundance = in order to find a fit to our observed lines. Here, the outer abundance was kept high at 5.010-7 corresponding to a 12CO abundance of 2.410-4 for 16O/18O=550 as was found appropriate for the case of IRAS 2A by Jørgensen et al. (2005c). This value is consistent with the CO/H2 abundance ratio determined by Lacy et al. (1994) for dense gas without CO freeze-out.
The best fit to the three lowest C18O lines (1–0, 2–1 and 3–2) is consistent with that found by Jørgensen et al. (2005c), corresponding to =7104 cm-3 and =310-8 (CO abundance of ). In the fits, the calibration uncertainty of each line (ranging from 20 to 30) is taken into account. These modeled spectra are overplotted on the observed spectra in Fig. 6 as the blue lines, and show that the anti-jump profile fits well the lower- lines but very much underproduces the higher- lines.
The value of was verified a posteriori by keeping at two different values of 3.4104 and 7104 cm-3. This is illustrated in Fig. 7 where the contours show that for both values of , the best-fit value of is 510-7, the value also found in Jørgensen et al. (2005c). The contours have been calculated from the lower- lines only, as these are paramount in constraining the value of . Different plots were made, where it was clear that higher- lines only constrain , as expected. The effect of is illustrated in Fig. 8 for the two values given above.


B.3 Drop-abundance profile
In order to fit the higher- lines, it is necessary to employ a drop-abundance structure in which the inner abundance increases above the ice evaporation temperature (Jørgensen et al. 2005c). The abundances and for are kept the same as in the anti-jump model, but is not necessarily the same as . In order to find the best-fit parameters for the higher- lines, the inner abundance and the evaporation temperature were varied. The plots (Fig. 9, left panel) show best-fit values for an inner abundance of = 1.510-7 and an evaporation temperature of 25 K (consistent with the laboratory values), although the latter value is not strongly constrained. These parameters fit well the higher- C18O 6-5 and 9-8 lines (Fig. 6). The C18O 5–4 line is underproduced in all models, likely because the larger HIFI beam picks up extended emission from additional dense material to the northeast of the source seen in BIMA C18O 1–0 (Volgenau et al. 2006) map.
Because the results do not depend strongly on , an alternative approach is to keep the evaporation temperature fixed at 25 K and vary both and by fitting both low- and high- lines simultaneously. In this case, only an upper limit on of is found (Fig. 9, right panel), whereas the inferred value of is the same. This figure conclusively illustrates that , i.e., that a jump in the abundance due to evaporation is needed.
The above conclusion is robust within the context of the adopted physical model. Alternatively, one could investigate different physical models such as those used by Chiang et al. (2008), which have a density enhancement in the inner envelope due to a magnetic shock wall. This density increase could partly mitigate the need for the abundance enhancement although it is unlikely that the density jump is large enough to fully compensate. Such models are outside the scope of this paper. An observational test of our model would be to image the N2H+ 1–0 line at high angular resolution: its emission should drop in the inner 900 AU (4) where N2H+ would be destroyed by the enhanced gas-phase CO.