119–126
Highly Ionised Gas as a Diagnostic of the Inner NLR
Abstract
The spectra of AGN from the ultraviolet to the near infrared, exhibit emission lines covering a wide range of ionisation states, from neutral species such as [O I] 6300 Å, up to [Fe XIV] 5303 Å. Here we report on some recent studies of the properties of highly ionised lines (HILs), plus two case studies of individual objects. Future IFU observations at high spatial and good spectral resolution, will probe the excitation and kinematics of the gas in the zone between the extended NLR and unresolved BLR. Multi-component SED fitting can be used to link the source of photoionisation with the strengths and ratios of the HILs.
keywords:
galaxies: active, galaxies: kinematics and dynamics, galaxies: nuclei, galaxies: Seyfert1 Introduction
The detection and initial investigations of highly ionised emission line species in AGN, has been possible for several decades eg. [Pelat et al. (1981)] and [Penston et al. (1984)]. However it is only relatively recently that sensitive near-IR spectroscopy and IFUs have renewed the impetus to use these features as diagnostics of both the ionisation processes and gas kinematics. At high energies eg. X-rays and the ultraviolet, observational evidence has been accumulating in support of the presence of outflows. Although estimates of the mass in the outflow are difficult to make and assumption dependent, in some cases it may be substantial, and the associated kinetic energy a significant fraction of the bolometric luminosity ([Reeves et al. (2009), Reeves et al. (2009)]).
2 Samples of AGN with Highly Ionised Lines
Thanks to advances in the technology of near-IR arrays, we now have significant numbers of AGN with high quality spectra from 1-2.5 eg. [Riffel et al. (2006)] and [Landt et al. (2008)]. Although generally the near-IR spectral resolution is not yet comparable with similar samples at optical wavelengths. Based mostly on optical studies there is now convincing evidence of blue-shifts of the highly ionised species with respect to the systemic velocity, see [Rodriguez-Ardila et al. (2006)] and [Mullaney & Ward (2008)]. In a recent study [Gelbord et al. (2009)] used spectra mined from the SDSS catalogue to select 63 AGN, based on the strength of their [Fe X] 6374 Åline emission. Clearly such a sample has a strong selection effect, but it is valuable to compare its properties with other studies which almost aways draw their targets from the optically brighest and best observed AGN. [Gelbord et al. (2009)] find strong correlations between the X-ray continuum and lines of [Fe X] and [Fe XI], as well as a trend for the broadest HIL profiles to have the highest blue-shifts.
Smaller samples of AGN have been observed via narrow band imaging in the emission line of [Si VII] 2.48. [Prieto et al. (2005)] showed that in a small sample of Seyfert 2s, the region is extended from a few tens up to 150 pc, making it significantly less extended than the NLR. Furthermore, several studies of the HIL, for example recent work by [Mullaney & Ward (2008)], have shown that the profiles of the HILs can often be deconvolved into several components, and that the broadest of these has a FWHM in between those of the BLR and the NLR (as typified by the [O III] line at 5007 Å). Finally, a very recent study of HILs using HST+STIS data([Mazzalay et al. (2010), Mazzalay et al. 2010]), confirm substantial blue-shifts, and also detect line splitting at the core of some galaxies.
3 Case Studies
Although statistical studies of high ionisation line species detected in large samples of AGN, such as those mentioned above are very useful, these need to be complemented by detailed studies of some individual cases. In their seminal study of the optical and near infrared coronal lines in NGC 1068, [Marconi et al. (1996)], demonstrated the diagnostic potential of combining several ratios of HIL of various elements and ionisation species . However, NGC 1068 is a Seyfert 2, and presumably some proportion of the region emitting the highly ionised gas will be blocked by the torus. It would therefore be desirable to make a detailed studies of Seyfert 1s.
3.1 Akn 564
[Mullaney et al. (2009)] used new spectroscopic data on the NLS1 Akn 564, and extended the modeling techniques described in [Ferguson et al. (1997)]. They were able to build a self consistent model which explains both the line ratios and kinematics of the highly ionised gas. In essence this model invokes gas liberated from the the dusty torus, and then accelerated to its terminal velocity. In principle this model can be tested and constrained using additional HIL species, and high spatial resolution spectroscopy.

3.2 NGC 3783
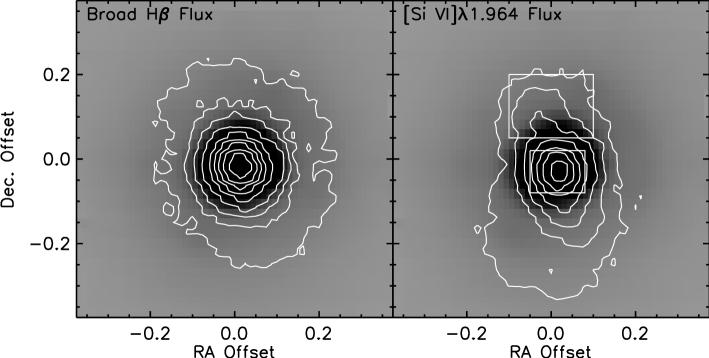
NGC 3783 is a classic Seyfert type 1, and due to its proximity and high flux, it has been intensively studied at all energies. We have used recent near-IR data from SINFONI, to extract maps of several emission lines in the K-band. Of particular interest in this context is the map of [Si VI] at rest wavelength 1.963 (Fig. 1). An elongation can be seen towards the North (top), of a few tenths of an arcsec. The projected physical extent is 42 pc. Interestingly the blue-shift from systemic velocity of both the on and off-nucleus profile is about the same ie. 250 km s-1 (Fig. 2). This lack of a velocity gradient is what might be expected if one were viewing a conical outflow roughly aligned along the line of sight. More detailed modelling of spatially extended emission line ratios is in progress.
4 Future Observational Tests
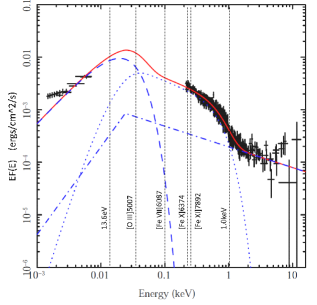
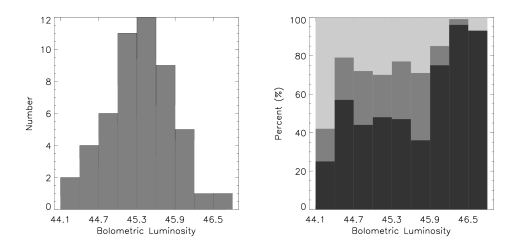
Because the HIL emitting region is very probably statified, good spectral resolution is essential to deconvolve the line profiles. This, combined with high spatial resolution is now possible using IFUs such as SINFONI, and a start has been made on a few nearby AGN. Other routes are also available. For example, one of the key open questions regarding the innermost HIL region, is the nature of the ionisation mechanism. This is assumed to be via photionisation based on estimates of the gas temperature, and good correlations with the high energy continuum. However, the crucial continuum photon energies lie in the unobservable region of the spectrum. To circumvent this, we are analysing a sample of 51 AGN all with excellent X-ray data, plus SDSS spectra. We have fitted their SEDs using three principal components; an accretion disc, a Compton component, and a broken power-law, see Fig. 3 for one example. We shall be able to use the integrated luminosities of each continuum component Fig. 4, to see which correlates best with the HILs. Using black hole mass estimates from the Balmer line profiles and continua, we shall see whether there is any relationship between the Eddington ratio and the strength,velocity width and blue-shift of the HILs.
References
- [Ferguson et al. (1997)] Ferguson J., Korista K., Ferland G., 1997, ApJS, 110, 287
- [Gelbord et al. (2009)] Gelbord J., Mullaney J.R., Ward M., 2009, MNRAS, 397, 172
- [Landt et al. (2008)] Landt H., Bentz M., Ward M., Elvis M., Peterson B., Korista K., Karovska M., 2008, ApJS, 174, 282
- [Marconi et al. (1996)] Marconi A., van der Werf P., Moorwood A., Oliva E., 1996, A&A, 315, 335
- [Mazzalay et al. (2010)] Mazzalay X., Rodriguez-Ardila A., Komossa S., 2010, eprint arXiv:1002.3152
- [Mullaney & Ward (2008)] Mullaney J.R., Ward M., 2008, MNRAS, 385, 53
- [Mullaney et al. (2009)] Mullaney J., Ward M., Done C., Ferland G., Schurch N., 2010, MNRAS, 394, L16
- [Pelat et al. (1981)] Pelat D., Alloin D., Fosbury R., 1981, MNRAS, 195, 787
- [Penston et al. (1984)] Penston M., Fosbury R., Boksenberg A., Ward M., Wilson,A., 1984, MNRAS, 208, 364
- [Prieto et al. (2005)] Prieto M. A., Marco O., Gallimore J., 2005, MNRAS, 364, L28
- [Reeves et al. (2009)] Reeves J., O’Brien P., Braito V., Behar E., Miller L., Turner T., Fabian A., Kaspi S., Mushotzky R., Ward M., 2009, ApJ, 701, 493
- [Riffel et al. (2006)] Riffel R., Rodriquez-Ardilla A., Pastoriza M., 2006, A&A, 457, 61
- [Rodriguez-Ardila et al. (2006)] Rodriguez-Ardila A., Prieto M., Viegas S., Gruenwald R., 2006, ApJ, 653, 1098