Two Red Clumps And The X-Shaped Milky Way Bulge
Abstract
From 2MASS infra-red photometry we find two red clump (RC) populations co-existing in fields toward the Galactic bulge at latitudes 5.5∘, ranging over 13∘ in longitude and 20∘ in latitude. These RC peaks indicate two stellar populations separated by 2.3 kpc; at ()=() the two RCs are located at 6.5 and 8.80.2 kpc. The double-peaked RC is inconsistent with a tilted bar morphology. Most of our fields show the two RCs at roughly constant distance with longitude, also inconsistent with a tilted bar; however, an underlying bar may be present.
Stellar densities in the two RCs changes dramatically with longitude: on the positive longitude side the foreground RC is dominant, while the background RC dominates negative longitudes. A line connecting the maxima of the foreground and background populations is tilted to the line of sight by 20, similar to claims for the tilt of a Galactic bar. The distance between the two RCs decreases towards the Galactic plane; seen edge-on the bulge is X-shaped, resembling some extra-galactic bulges and the results of N-body simulations. The center of this X is consistent with the distance to the Galactic center, although better agreement would occur if the bulge is 2–3 Gyr younger than 47 Tuc.
Our observations may be understood if the two RC populations emanate, nearly tangentially, from the Galactic bar ends, in a funnel shape. Alternatively, the X, or double funnel, may continue to the Galactic center. From the Sun this would appear peanut/box shaped, but X-shaped when viewed tangentially.
Subject headings:
stars: distances, late-type, Galaxy: bulge, structure1. Introduction
Following the detection of an apparent H I bar within 2kpc of the Galactic center, by Liszt & Burton (1980), Blitz & Spergel (1991) found that the 2.4 imaging data of Matsumoto et al. (1982) showed the presence of a tilted bar in the Galactic bulge. That part of the bar closest to the sun was at positive Galactic longitudes. These conclusions were primarily based on the observed fluxes for latitudes =3–9∘ and longitudes at =0,10∘.
Stanek et al. (1994, 1997) studied V and I photometry of Red Clump (RC) stars toward the bulge at longitudes of 1,5∘ (latitudes near =4∘) and found a systematically fainter RCs from positive to negative longitude. This was interpreted, and modelled, as a distance effect which was fit with a tri-axial structure, or tilted bar, with the near-side at positive Galactic longitudes.
Later work on the COBE/DIRBE near and far infrared sky brightnesses data by Dwek et al. (1995) and Binney, Gerhard, & Spergel (1997) confirmed the existence of the tilted Galactic bar. Distances from RC stars, studied for fields at various positions, from Babusiaux and Gilmore (2005), Nishiyama et al. (2005, 2006), and Rattenbury et al. (2007) confirm the general picture of a tilted Galactic bar. In particular, Nishiyama et al. (2005, 2006) claimed to find a secondary inner bar.
The recent radial velocity study of bulge M giants stars, by Howard et al. (2008, 2009), found rotation that is best fit with bar models. In particular, they find that the bulge at 8∘ and 4∘ rotates cylindrically, as do boxy bulges of other galaxies.
Recently, McWilliam et al. (2010) and Zoccali (2010) independently found evidence for two red clumps toward the Galactic bulge region. In the current paper we outline and expand on the evidence of this joint discovery and map the extent of the double red clump over the bulge region.
2. Observational Data
The data discussed here come from the following four photometric catalogs available in the literature:
i) The 2MASS point source catalog (Skrutskie et al. 2006).
ii) Optical WFI photometry at the 2.2m ESO/MPG telescope at La Silla, for a arcmin field at (Zoccali et al. 2003).
iii) Near IR photometry from SOFI at the NTT in La Silla, for a arcmin field centered at (Zoccali et al. 2003).
iv) The OGLE maps of the Galactic bulge, from Udalski et al. (2002).
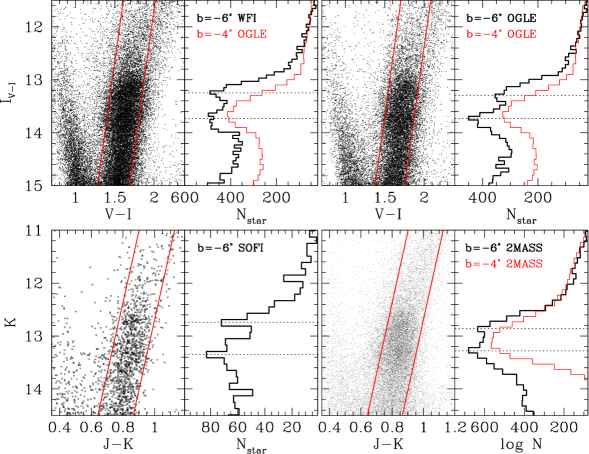
In Figure 1 we show the color magnitude diagram (CMD) of the bulge region centered approximately at , along the minor axis, from four independent photometric data sets, all of them showing a double peaked horizontal branch red clump. The upper panels show the WFI (left) and OGLE (right) optical CMDs together with the luminosity functions (LFs) of RGB stars falling inside the diagonal strip marked in the CMD. The reddening free magnitude 111The magnitude is defined as . was used, following Rattenbury et al. (2007), and adopting the extinction values given in Sumi et al. (2004) for the OGLE fields. The OGLE field shown here is the number 7, centered at . It is worth noticing that Rattenbury et al. (2007) data also show a double peaked red clump in this field (c.f., their Fig. 5). The red thin histograms in both panels show the LF of the OGLE field centered in Baade’s Window (SC46), where the red clump is significantly narrower and uni-modal.
The lower panels of Figure 1 show the near IR CMDs and LFs from the SOFI photometry (left) and the 2MASS point source catalog (right). Again, the red clump is double peaked in this field. The LF for Baade’s Window is also shown as a red thin histogram. The latter was obtained by selecting a 0.8 square degree field, centered at at , from the 2MASS point source catalog. Unfortunately at the completeness of the 2MASS catalog drops abruptly below the red clump, therefore the comparison is not as conclusive as the one for the OGLE catalogs.
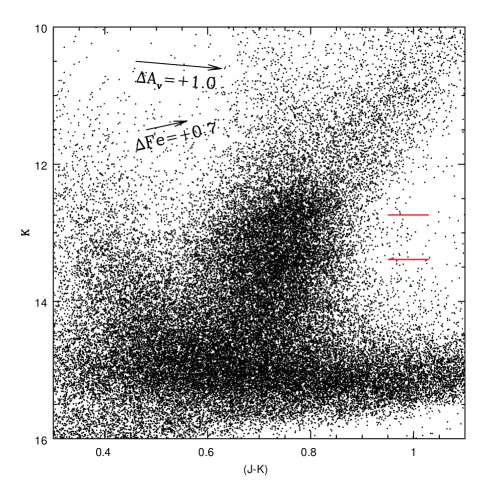
The 2MASS color-magnitude diagram in Figure 2 shows the two RCs at ()=(1,8), which appear tilted, consistent with the predicted metallicity-dependence of the Teramo isochrones (Pietrinferni et al. 2004). The figure also clearly shows that the two RCs possess similar range and mean (JK) colors; as in Figure 1 this suggests that the reddening is foreground and small, and that the two RC populations possess a similar range and mean metallicities.
The mean (JK)2MASS color differences between bright and faint RCs for the 16 fields in this paper that contain both RCs is 0.0170.003 magnitudes. Thus, the colors are practically identical, but in all cases the brighter RC is slightly redder than the faint RC. This systematic difference is in the right sense and size to be due to the change in color of the background red giant branch population between the bright and faint RCs.
A small metallicity difference (about 0.1 dex), between bright and faint RCs could produce the color shift, but it would still be necessary to subtract the red giant branch background effect; thus, any metallicity difference must be smaller than 0.1 dex.
Figure 1 and 2 suggests that the double clump might be due to the presence of two populations at two different distances. A magnitude difference of at kpc would correspond to a distance difference of kpc.
We note here for the first time that in the outer bulge, along the minor axis, bright and faint red clumps coexist, as if the near and far side of the bar both extend towards the minor axis.
Figure 1 demonstrates that the horizontal branch red clump in the field at is significantly broader than the one of Baade’s Window at .
If the double-peaked RCs are due to the distances of two populations, the observations immediately appear inconsistent with a single tilted bar. It is, therefore, important to ask whether the double-peaked RCs could have resulted from stellar evolution, or to effects other than distance.
A few points can be addressed by looking at these figures. First of all, the double clump is real. It is not an artifact of bad photometry, such as a bad match of mosaic data, because it is present in several independent catalogs. We have checked that it is present in each of the 8 chips of the WFI mosaic.
Second, the two peaks cannot be due to the RGB bump (nor the AGB bump) falling close to the RC because in that case the two would also occur in Baade’s Window.
Also, as we will see in Figures 3 & 4, the relative strength of the two RC peaks changes dramatically with longitude, while the population ratios of RGB bump, AGB bump and HB red clump depend on the evolutionary time of these phases, and therefore should be independent of the line of sight.
The double clump cannot be due to two extinction patches in this particular direction, because in that case the separation between the two peaks would be smaller in the band, compared to the band. Instead, the separation is roughly comparable in all the filters. In addition, as mentioned above, the two peaks look very similar in the 8 chips of the WFI mosaic. This would not be the case if they were due to extinction patches. Finally, were extinction responsible for the two peaks, the clump that is magnitudes fainter would also be magnitudes redder than the other one in , which is clearly not the case.
The predicted RCRGB bump I-band magnitude differences from the Teramo stellar evolution code (e.g., Pietrinferni et al. 2004) increase with metallicity, and a match to the observed difference between our putative RCs occurs for 12Gyr isochrone at solar metallicity. However, the predicted RC numbers exceed those of the RGB bump by roughly a factor of 10. This presents a particularly severe problem for the negative longitude fields (see Figure 3), where the faint component dominates, so the proposed RGB bump population exceeds the RC, completely at odds with current stellar evolution ideas. The RGB bump/RC ratio for the negative longitude bulge fields of Figure 3 exceed the stellar evolution predictions by more than a factor of 30. This might be qualitatively understood if metal-rich bulge stars largely terminate their evolution prematurely, after the RGB bump but before the RC, say if their metallicity is higher than currently realized and they experienced significantly enhanced mass-loss. However, as noted above, it would then be necessary to understand why stellar evolution on the giant branch is so different on the positive and negative longitude sides of the bulge; as a result there would still be two separate bulge populations. The similarity of the JK colors of the two populations suggests that there is very little metallicity difference. Given these difficulties, the idea that our two RCs are due to RC plus RGB bump is not a tenable hypothesis. It is likely that the RGB bump is detected as a very small peak in some of the panels of Figure 3; the main effect of the RGB bump is to reduce the clarity of the fainter RC peaks.
Theoretical isochrone RC K-band magnitudes and (JK) colors display metallicity-dependence: more metal-rich RC stars are redder in (JK) and brighter in K. This effect is clearly evident in the Teramo group stellar evolution models (e.g., Pietrinferni et al. 2004).
The theoretical predictions show that RC MK is brighter for younger ages; however, no single age can account for the observed 0.65 mag. difference in RC K0 seen of Figure 2 and 3 for solar-metallicity isochrones, unlike the case for the I-band. The closest that the theoretical RC predictions come to to the observations, at solar composition, is for ages at 2 and 14 Gyrs, but this only accounts for MK of 0.28 mag. A combination of age and metallicity effects could explain the brightness of the observed RC peaks, but this requires unrealistic ages and a mean [Fe/H] near 0.5 dex, which is in conflict with measured bulge abundances. For latitude 8∘ the age explanation would require the majority of stars at positive longitudes to be 2Gyr old and the majority of stars at negative longitudes to be 14 Gyr, with a roughly equal mixture of both at longitudes near 0. However, this is excluded by the age data of Zoccali et al. (2003), at (,)=(0.3,6.2), and Clarkson et al. (2008) at (,)=(1.3,2.7). Both studies find an old bulge 10 Gyr with almost no trace of a younger population. Again, this would not explain how two vastly different age stellar populations could be maintained on opposite sides of the Galactic center. We conclude that it is not possible to account for the observed K-band RC magnitudes with two stellar populations of different ages at a single distance. Thus, we attribute the observed differences in RC magnitude as primarily a distance effect.
We note the similarity of our bulge-wide double RC to the double RC in the bulge globular cluster Terzan 5, found by Ferraro et al. (2009). It is tantalizing that the Galactic longitude of Terzan 5 puts it very close to the peak of our bright RC (but closer to the plane than our fields), and that Ferraro et al.’s preferred Terzan 5 distance, at 5.90.5 kpc, is very similar to our estimated distance for the bright RC, at 6.5 0.2 kpc.
Ferraro et al. (2009) fit the RC region using two isochrones, one at 12 Gyr with [Fe/H]=0.2 dex, and a brighter one with an age of 6 Gyr and [Fe/H]=0.3 dex. The young population is critical for explaining the Terzan 5 double RC. If this explanation were true for the bulge-wide double RC found here it might indicate that the bright RC is due to a huge accreted stellar system.
While a second, young, metal-rich, population is acceptable for an individual globular cluster, it is in conflict with the distribution of cmd ages found by Zoccali et al. (2003) and Clarkson et al. (2008), who find almost no trace of bulge stars with ages less than 10 Gyr. The Zoccali et al. (2003) field is closest to our fields near =, which shows a large fraction of bright and faint RC star populations. Thus, for double RCs due to age and metallicity, rather than distance, there should be large numbers of both young and old populations in the Zoccali et al. (2003) field; yet no significant 6 Gyr population is evident in the Zoccali et al. (2003) data.
The two RCs in Ter 5 are shifted in mean (JK) color by 0.15 magnitudes, consistent with the claimed [Fe/H] difference. However, for our bulge-wide fields the bright and faint RCs have nearly identical mean colors, no matter what the reddening, suggesting no significant metallicity differences. Without a metallicity difference the required ages of the two bulge-wide RC populations, for [Fe/H]0.2, needs to be 2 and 14 Gyrs, as stated above; such age differences are easily ruled-out. Thus, there seems to be no way to appeal to an acceptable combination of age and metallicity to explain the brightness and color of the two bulge-wide double RCs discussed in this paper; thus, we assume that the double RCs reflect a distance effect.
A caveat is that this conclusion relies on the assumption that the age distribution at = is similar to the old ages in the field of Zoccali et al. (2003) and the field of Clarkson et al. (2008).
3. The Double Red Clump Across the Bulge
3.1. Extent in Longitude
In order to map out the extent of the double RC region toward the Galactic bulge we have produced CMDs and LFs similar to Figure 1 for a large number of regions. In Figure 3 we show some of these regions for latitude , with longitudes ranging from ∘ to ∘.
The mean reddening of each field was estimated from the mean 2MASS (JK) color of the red clump. Here we adopt an unreddened 2MASS (JK)0=0.61 for the 8∘ bulge red clump, based on the Alves (2000) mean CIT VK=2.35 for solar neighborhood RC stars, the Alonso et al. (1999) color-Teff relations and the CIT–2MASS color transformations of Carpenter (2005 unpublished) 222http://www.astro.caltech.edu/ jmc/2mass/v3/transformations. The mean metallicity of the Alves (2000) solar neighborhood RC stars is similar to the mean metallicity of the 8∘ bulge field, at [Fe/H]=0.18 dex, based on a linear metallicity gradient computed with the metallicities of nearby fields from Zoccali et al. (2008). Thus, the Alves (2000) RC calibration has the appropriate metallicity for this bulge field, and roughly the right Teff and (JK) color, although because the bulge is significantly older the luminosity of the Solar neighborhood RC stars is different. Note that because the RC (JK) colors show a small metallicity sensitivity our reddening values are close, but not strictly correct, for bulge fields with different mean metallicities. In our analysis we employ the Winkler (1997) reddening law, from which we find AK=0.64 E(JK). We note that Nishiyama et al (2009) find a slightly different reddening law for the bulge, for which they obtain AK=0.528 E(JK). Our K-band extinction correction for (,)=(1,8) at 0.10 mag. would be reduced to 0.08 mag. if we employed the Nishiyama et al. (2009) reddening law. Because these values are very small, being less than the bin width in the luminosity functions presented here, the choice of reddening law does not affect our conclusions.
We prefer to use the (JK) color difference to estimate the average reddening and K-band extinction for each field rather than the (HK) color because the bulge RC (HK) color, in our fields, suffers significant overlap with foreground disk Main Sequence and RC stars.
We do not attempt to correct for extinction of individual RC stars using the reddening-free KHK magnitudes employed by Nishiyama et al. (2005), because this introduces unacceptable errors for our fields. The formula used by Nishiyama et al. (2005) effectively adopts reddening values for each star based on the HK color distance from the mean RC value. However, the RC is not a discrete point, but has an intrinsic color width even for single populations; in 47 Tuc the RC has a 2MASS color width of 0.10 magnitudes in (JK) and 0.13 magnitudes in (HK). Because the bulge contains stars with a range of metallicity the intrinsic width of the RC is even larger than in 47 Tuc. For this reason, distance from the mean RC color is a poor reddening indicator in the low-extinction bulge fields considered here. If we employ KHK from Nishiyama et al. (2005) our bulge luminosity functions would effectively be convolved with an error distribution and the peaks more difficult to identify.
Because the K-band extinctions of our fields are small, typically less than 0.10 magnitudes, it is more reliable to simply correct for the average extinction for each field, implied from the mean RC (JK) color, than to employ the putative reddening-free KHK magnitudes for individual stars. Because of the metallicity-dependence of the RC (JK) and MK values our adopted mean extinctions and implied distances are sensitive to systematic metallicity differences between fields.
In Figure 3 we show the dereddened 2MASS K-band luminosity function, for 8 fields covering longitudes from =6 to =7 degrees, at a latitude of =8 degrees. Each field was constructed using 2MASS data from a 30 arc-minute radius circular aperture on the sky. The luminosity function was derived from a vertical strip, 0.10 magnitudes wide in (JK)0, centered on the mean RC (JK)0 color for each field. The color-magnitude diagrams of all 8 fields show that the bright and faint RC possess similar ranges and mean (JK)0 values, as also seen in Figures 1 and 2. This is most easily understood if the two RCs have similar metallicities and reddenings (i.e., due to foreground reddening). For fields beyond the ranges of Figure 3 we can see the same RCs individually, but not both together, over a large area of sky approximately 2020 degrees in extent.
Globular clusters have a negligible effect on our luminosity functions. In Figure 3 only the field at (,)=3,8 contains a globular cluster, NGC 6624, which covers an extremely small fraction of the field. The distance modulus of NGC 6624 (Harris et al. 1996) indicates K0=14.1, which coincides with a minuscule peak in the luminosity function of Figure 3, and is comparable to the noise.
We determine distances of the two RC populations using the observed 47 Tuc RC plus theoretical corrections for metallicity. For the bulge field in Figure 3 at (,)=(1,8) the bright and faint RC peaks are located at K0=12.64 and 13.29 respectively. Zoccali et al. (2008) suggests that [Fe/H]=0.18 for a bulge latitude of ; Koch & McWilliam (2008) find [Fe/H] for 47 Tuc of 0.76 dex. The Teramo stellar evolution models indicate that the bulge RC is 0.20 magnitudes more luminous than the 47 Tuc in the K-band, due to this metallicity difference, assuming that both systems are 12 Gyr old. If the bulge is younger or more metal-rich the size of the correction increases. The 47 Tuc RC 2MASS K0 magnitude is 11.98 and its distance modulus is 13.22 (Koch & McWilliam 2008). Combined with the metallicity K-band correction we find distances for the bright and faint bulge RCs of 6.5 and 8.8 0.2 Kpc respectively.
As noted earlier, the ratio of bright to faint RC in Figure 3 varies strongly with longitude, with the faint RC dominant at negative longitudes, and the bright peak strongest on the positive longitude side of the bulge. For the latitude fields of Figure 3 the faint RC peaks around and the bright RC peaks near .
We note that the foreground peak, at contains many more RC stars than the peak of the background population, at . Because the background population is at a higher distance above the plane for , a lower star count is expected for the background RC. This provides a qualitative explanation why the negative longitude side of the bulge is fainter at NIR wavelengths than at positive longitudes away from the Galactic plane.

The panels in Figure 3 show that the two RCs remain at similar K0 magnitudes, at latitude , although the relative strength of the faint and bright RCs changes strongly with longitude, with the bright one dominating at positive longitudes, and the faint one at negative longitudes. Closer to the plane, at latitudes , similar behavior is observed: a (single) bright clump at positive , becoming progressively fainter as one crosses the minor axis and moves towards negative .
While the RC populations in the panels of Figure 3 appear at nearly constant K0 magnitude, the ()=() and () panels provide the strongest evidence of locations where the foreground RC is more distant and the background RC closer than the norm. It would be interesting to know whether these distance changes are consistent with spiral locii.
The same two-component RC behavior is seen on the positive latitude side, above the Galactic plane, as evident in Figure 4. Compared to the fields at the double RC peaks are less pronounced at . On the positive latitude side the peak of the RC number counts is near and for the foreground and background populations respectively, which is very similar to the side. Also, like the side, there is marginal evidence in Figure 4 that the foreground and background peaks are closer to the Galactic center at and respectively.

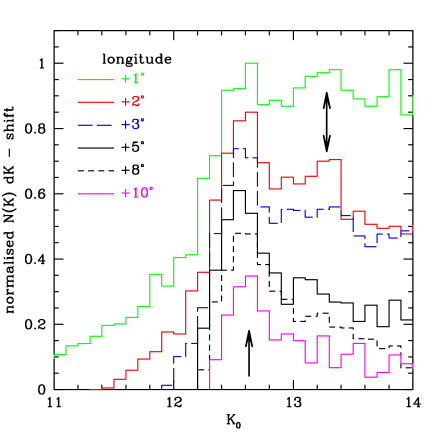
In Figure 5 we overplot the luminosity function at =8∘ for longitudes from 1 to 10∘, showing that the foreground RC lies at almost constant magnitude, although it does seem slightly fainter (more distant) at =10∘ longitude. This structure is a major component of the bulge at positive longitudes; its near-constant distance is completely at odds with a bar tilted at 20∘ to the line of sight, which should have changed distance by more than 2 kpc, over 9∘ in longitude, or about 0.7 magnitudes in brightness.
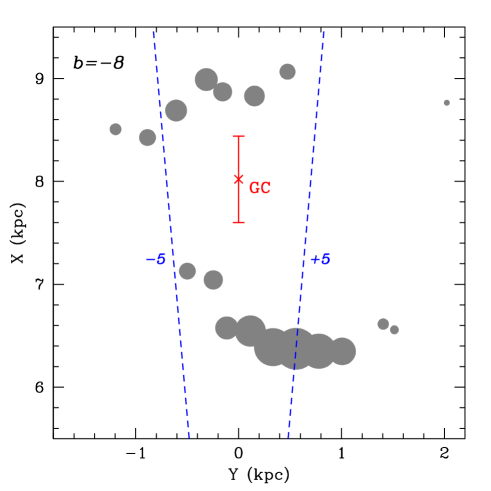
In Figure 6 we plot the RC distances for 12 fields in the latitude plane, using the RC peak magnitudes measured from Figure 3, supplemented with four extra fields. The distances assumed [Fe/H]=0.18 for with a metallicity correction of 0.20 mag. applied to the observed 47 Tuc RC MK (see Koch & McWilliam 2008), based on the theoretical RC calibration of Pietrinferni et al. (2004, 2006). The fields range in longitude from to . The sizes of the dots in Figure 6 are proportional to the number of stars at the peak of the RC.
From Figures 3 and 6, our best estimate of the maximum counts of the foreground and background RC populations are and respectively. A line connecting these background and foreground peaks is tilted to the line by 20, which is identical to the tilt of the Galactic bar claimed by numerous studies. The line joining the foreground and background RC peaks intersects the line at a distance of 7.7 kpc from the Sun, within 1 of the distance to the Galactic center (Ghez et al. 2008), projected onto the plane. The intersection with this putative bar line is close to the half-way distance between the foreground and background, indicating symmetry.
The above facts suggest that the RC populations we have found reside at the ends of the Galactic bar; presumably, at we are seeing vertical projections from the bar ends. The almost constant distances found for the foreground RC population in Figure 5 most likely reflect stars from the nearby end of the bar, spread out into an orbital arc, or partial arc. Our observation that far from the bar ends the RCs appear closer to the Galactic center distance suggests arcs extending from the bar ends; they seem closer to the center than expected from a circular orbit. Because the bar is nearly pointing toward us, the arcs extend roughly perpendicular to the line of sight direction; this can explain why the distance to the foreground RC does not change much over 9∘ in longitude.
Although several groups have modeled the Galactic bar using the red clump magnitude as a measure distance, almost all used low-latitude data, with . The exception is Rattenbury et al. (2007), who included data from 45 OGLE-II fields; only two of these fields exceeded , and were located near .
Rattenbury et al. (2007) found that beyond longitude 6∘ the VI luminosity functions are inconsistent with their initial simplistic tilted bar model used to fit the inner regions. At large negative longitudes the IV-I luminosity functions on the right panel of Figure 7 in Rattenbury et al. (2007) appear to have the same peak value, consistent with no tilt to the bar at all, although they did not comment on this. For large positive longitudes, l6∘ the OGLE VI luminosity functions in Figure 7 of Rattenbury et al. (2007) were much broader than the negative longitude data with a shorter distance modulus. For these OGLE fields (numbers 8–13) the bar model predicted much shorter distances than the data. To fix these inconsistencies Rattenbury et al. (2007) introduced a tri-axial model for the bar, but this added complexity still did not provide satisfactory fits to the luminosity functions at large longitudes positive or negative.
The CMD the (,)=(0,1) field of Babusiaux & Gilmore (2005), published in Figure 4 and 5 of their paper, indicate a double, tilted, RC separated by 0.7 mag. in the K-band. The two RCs show the same (JKs) range and upward tilts indicating that the (JKs) range is dominated by metallicity dispersion, rather than reddening dispersion. While this apparently confirms our double RC finding to =1, the separation is larger than expected from Figure 7 in this work. They also found a second RC at l=5, indicating a more distant structure.
Nishiyama et al. (2005) noted the presence of a weaker RC in b=1 fields with , at KH-K 13.5. They also found a significantly shallower slope of dereddened K magnitude versus longitude in within 4, compared to larger longitudes, and suggested that this is evidence of an inner bar.
A further confirmation of the existence of a double clump at comes from the analysis of Vieira et al. (2007), who measured proper motions for stars in Plaut’s Window. The double clump is barely visible in the CMD of their Figure 4, but it is evident in their Figure 10, although they did not comment on it. The separation between the two clumps is mag, consistent with what we find in Figure 3, and slightly larger than the separation between the clumps at , as if the two populations get further away from each other when going far from the galactic plane.
3.2. Extent in Latitude

In Figure 7 we show a vertical cut in the 2MASS data at constant longitude, , with latitudes ranging from to degrees. The main point to notice in Figure 7 is that the two RC populations are present over a 20 degree range in latitude, although we do not have information for the inner 5 degrees. We note that data for the panels at =10.25 degrees were taken from rectangular boxes, 1.5 degrees in latitude by 4 degrees longitude, for an increased area of sky, necessary to detect the two RC components above the background noise. Thus, these panels in Figure 7 should be divided by a factor of 7.64 to normalize to the counts of the lower latitude fields (30 arc-minute radius circles). Figure 7 (and the 1,8 panel in Figure 3) show that the separation between the foreground and background RCs decreases toward the Galactic plane. At 10∘ the separation in K0 is 0.71 mag., at =8∘ it is 0.64 mag., while at =5.5∘ the separation is 0.44 mag. This indicates that the two RCs are closer together at lower Galactic latitudes. This is consistent with the de-reddened OGLE VI photometry of Baade’s Window (at =4) in Figure 1, showing a single, wide RC.
In Figure 7 the bright RC appears approximately unchanged with latitude, while the faint RC becomes brighter toward the Galactic plane. This suggests that the bright and faint RCs are closer together in distance at lower latitudes. Because the K0 value of the bright RC does not change significantly it might be assumed that the bright RC is at a fixed distance, and that the faint peak is closer at lower latitudes, forming a K-shape morphology. However, for Figure 7 the computation of the de-reddened K-band magnitudes employed a single RC MK value, which we believe is correct for the metallicity of the field at =8∘, but is not correct for fields with different mean metallicities.
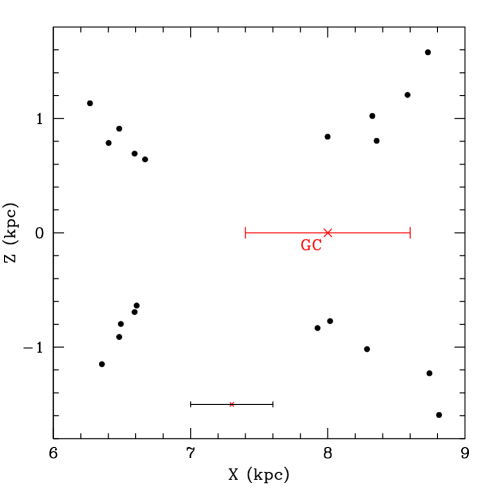
In order to determine more reliable distances from the two RCs we adopt metallicities as a function of Galactic latitude from Zoccali et al. (2008), and the metallicity sensitivity of RC MK from the Teramo stellar evolution models (e.g., Pietrinferni et al. 2004). We note that the RC MK is also sensitive to age; in particular, the Teramo RC models show steeper metallicity-dependence for older ages. Studies of the Galactic bulge age (e.g., Zoccali et al. 2003; Clarkson et al. 2008) show that it is in the range 10–14 Gyr, with a very small population 5% possibly as young as 5 Gyr. We have adopted an age of 12 Gyr and assume a 1 uncertainty of1 Gyr. We simply add the theoretical RC corrections to the observed MK of the 47 Tuc RC. In Figure 8 we show the distances of each RC for each latitude field in Figure 7. Figure 8 shows a remarkable X-shape structure; again, we note that if the metallicity gradient were not taken into account Figure 8 would appear more K-shaped.
An alternative interpretation is that the metallicity of the background field increases toward the Galactic plane, while the foreground field remains at constant mean metallicity. This explanation requires a metallicity increase of 0.7 dex from =10.25 to 5.5∘, which is much greater than the observed metallicity gradient of Zoccali et al. (2008). We therefore abandon this possibility.
Recently, Zoccali et al. (2010), Hill et al. (2010, unpublished) and Babusiaux et al. (2010) claimed that the bulge metallicity gradient of Zoccali et al. (2008) is an artifact, due to a changing ratio of two populations of bulge stars with different metallicities and kinematics. The larger velocity dispersion bulge stars have lower mean metallicities (e.g., Minniti 1996), and reside further from the Galactic plane than the higher metallicity population. We note that the range of [Fe/H] from Zoccali et al. (2008) is such that almost all of the Helium-burning stars in both populations go through the RC phase. Our use of the mean metallicities is appropriate to determine average distances as a function of longitude and latitude, but it is probable that the two populations do not share the same morphology.
We note that there must also be a third population, the inner-halo, as evidenced by the bulge RR Lyrae stars; this population possesses a spherical, rather than bar-like, morphology (Majaess 2010). However, the inner halo does not affect our results because most of its stars would not appear on the RC and because the peak of the halo metallicity function, near [Fe/H]=1.6 dex, was not detected in the study of Zoccali et al. (2008).
Thus, our picture of the 2MASS bulge now suggests a latitudinal narrowing of the two RC populations toward the Galactic center, with roughly constant distances in the longitudinal direction at high latitudes, together with an asymmetry in longitude. This suggests a three dimensional X-structure.
We estimate the minimum fraction of RC stars in the peaks in Figure 3 by subtracting the RGB background below the RC peaks, through interpolation of the RGB above and below the RC region. The minimum counts between the two RGB background-subtracted RC peaks provides a means to estimate the minimum contribution of the peaks to the total RC population. Either the minimum is due to the overlapping wings of the peak profiles, or a smooth RC population, due to the bar, underlying the RC peaks.
Between 20 and 100% of the bulge RC at ()=() is in either the foreground or background peaks. At ()=() the minimum extends practically to the background, so the entire population appears to be either background or foreground at this latitude, with no detectable bar at intermediate distances. For latitudes with (c.f. Figure 7) it is difficult to determine whether the foreground/background components are a few percent or 100% of the population. Detailed modelling will be required for more precise estimates.
The narrowing of the distance between the foreground and background RC populations suggests that the bar is significantly shorter than the distance between the two RCs at . It is also possible that the X-shape dominates over the bar even close to the Galactic plane; however, the BRAVA velocity dispersion is consistent with a bar component, even at .
4. Other Differences Between the Two Populations
Here we investigate published evidence relevant to differences between the bright and faint RC populations.
4.1. Proper Motions
If our bright and faint RC bulge populations are on opposite sides of the Galactic center, then their different distances can be revealed by proper motion studies. Mao & Paczyński (2002) predicted a proper motion difference between bright and faint RC bulge sub-populations near 1.6 mas yr-1 for Baade’s Window, assuming that they correspond to the near and far halves of the Galactic bar.
Sumi et al. (2003) measured proper motions of 47,000 bulge stars from OGLE survey data (at ), with a baseline of 4 years. They found a proper motion difference of 1.50.06 mas yr-1 between bright and faint RC sub-populations, in good agreement with the expectations of Mao & Paczyński (2002). Our analysis of the Sumi et al. (2003) data shows that the proper motion difference is reduced to 1.00.06 mas yr-1 if the bright end of the bright RC population box is reduced to resemble our bright RC sub-population limits. This result indicates that the bright and faint RC populations are, indeed, separated in distance as we assume here for our fields at higher latitudes.
An additional proper motion test can be obtained from the photographic data of Vieira et al. (2007, henceforth V07) for the Plaut field at , with a baseline of 21 years. From 328 bright RC and 365 faint RC stars in the V07 data, with 2MASS photometry, we find only a 1 difference between the mean proper motions of bright and faint RCs, in the longitude direction, at 0.19 mas yr-1. In the Galactic latitude direction the proper motion difference is 0.51 mas yr-1, or about 3, with the faint RC mean proper motion smaller than the bright RC’s.
Our analysis of the V07 data also shows a 3.4 difference in the proper motion dispersions of the bright and faint RC populations in the latitude direction. The faint RC dispersion is smaller than for the bright RC, consistent with the faint RC being more distant, although not as large as would be expected from our adopted distances. However, we expect that the signal will be diluted by contamination from foreground/background RGB stars in the faint/bright RC samples.
Thus, while the V07 mean longitudinal proper motion differences between the two RC populations are not consistent with distance separation, both the mean proper motion and the proper motion dispersion in the latitude direction are consistent with the faint RC at a significantly greater distance.
4.2. Radial Velocities
Two radial velocity studies of the Galactic bulge have been undertaken recently: the extensive BRAVA fiber survey (Howard et al. 2008, 2009) of bright bulge giants, and a Fabry-Perot investigation of bulge giants and RC stars by Rangwala, Williams & Stanek (2009, henceforth RWS09). The two studies show consistent mean velocities and velocity dispersions in the overlap regions.
The BRAVA study is quite extensive, covering a range of 20∘ in longitude, at latitudes of and . The resultant BRAVA velocities are consistent with cylindrical rotation with a peak-to-peak amplitude of 150 km/s for fields at and , or a maximum velocity of 75 km/s. Howard et al. (2008, 2009) conclude that this is consistent with a pseudo-bulge, but not a classical bulge. Shen et al. (2010) model the BRAVA velocities and find a pure bar morphology with no trace of a classical bulge. Because the BRAVA survey did not reach the faint RC, it contains no information on the bright versus faint RC kinematics.
A very important point is that both the BRAVA and the RWS09 velocities are consistent with orbital motion, showing the expected change in sign where stars at positive longitudes, near , are foreground, but background near . This strongly confirms our assumption that the fields near these longitudes are separated in distance, rather than at the same distance with differing RC magnitudes, due to unspecified population effects.
One might ask how the BRAVA velocity-longitude plots can appear continuous and symmetric when it samples stars on opposite sides of the Galactic center that are asymmetrically distributed in longitude. The answer is that for a line of sight through a circular orbit the foreground and background have the same radial velocity, but opposite proper motions. The symmetry of the BRAVA velocities with longitude indicates that the foreground and background populations are equally distant from the center of rotation.
In addition to the overall velocity field RSW09 also dissected the RC into bright and faint components. They found bright minus faint RC velocity differences in their fields of 3511 km/s, which they attributed to non-circular streaming motions. Closer to the minor axis, at , RSW09 found no velocity differences between the two RC populations.
The velocity difference at 5∘ might be understood as the signature of off-center bar rotation, with the axis of rotation closer to the background RC population; however, this possibility appears to be ruled-out by the symmetry of the BRAVA velocities. RWS09 noted that this velocity difference is opposite to the predictions of Mao & Paczyński (2002): faint RC stars have more positive velocities, not the expected more negative values. Thus, the bright/faint RC velocity differences of RWS09 must be investigated further.
4.3. Metallicities
Although many metallicity studies of the Galactic bulge have been undertaken, only Rangwala & Williams (2009, henceforth RW09) have compared [Fe/H] values from bright and faint RC stars. RW09 measured metallicities from the 8542Å Ca-triplet line in their earlier Fabry-Perot data. Based on a calibration with high resolution [Fe/H] values they inferred a mean [Fe/H] for the field at of 0.550.03 dex, and 0.170.03 dex for the field. This metallicity difference suggests that the bright and faint RC are distinctly different populations. However, such a longitudinal, lop-sided, metallicity difference is very difficult to understand for most morphologies; if correct, accretion of a dwarf galaxy seems plausible.
Because a lop-sided metallicity trend would have significant implications for our understanding of the bulge, independent verification of this result is critical. The presence of stars in the RW09 sample with reported [Fe/H] up to 3 dex gives cause for concern that large systematic uncertainties may be present. Andreas Koch (2010, private communication) has made provisional metallicity measurements from the BRAVA spectra; he found no significant asymmetry with longitude, contradicting the unusual metallicities of RW09. We, therefore, significantly downgrade the weight given to the metallicity asymmetry claimed by RW09.
5. Summary and Discussion
From 2MASS K0, (JK)0 color-magnitude diagrams we found two distinct RC populations towards the Galactic bulge, separated by K00.65 magnitudes at latitude , and co-existing in fields over 13∘ in longitude and 20∘ in latitude. The presence of the two RC populations is particularly obvious at a Galactic latitude of 8∘. We detect the individual RC populations over a 2020∘ area of sky, roughly symmetric about the Galactic center. Thus, the two populations cover essentially the entire Galactic bulge/bar region; however, the 2MASS data do not probe the RC within 5∘ of the Galactic plane, due to confusion limitations. We also find that the faint RC is dominant on the negative longitude side of the Galactic center, while the bright RC is the principal population at positive longitudes.
Based on the age and metallicity sensitivity of the RC, predicted by theoretical stellar isochrones of the Teramo group (Pietrinferni et al. 2004), we find that the two RCs cannot be due to any allowed combination of age or [Fe/H] in the Galactic bulge/bar at a single distance. Number statistics firmly rule-out the possibility that the two luminosity peaks are due to RC plus red giant branch bump (RGB bump) or asymptotic giant branch bump (AGB bump). Heretofore unknown stellar evolution effects are also militated against, due to the change in number ratio between positive and negative longitude sides of the Galactic bulge.
The obvious, and natural, explanation is that the faint and bright RC peaks reflect different distances of two populations. At ()=() we estimate distances of 6.5 and 8.8 kpc for the two RCs, based on MK=1.44, computed with theoretical offsets from the observed 47 Tuc K-band absolute magnitude, and assuming an age of 12 Gyr and a mean [Fe/H]=0.18 dex. Figure 6 and 8 should be consulted for distances at other locations. We note that these distances are based on the assumption of a bulge age equal to that of 47 Tuc, near 12 Gyr; our estimated distances increase for younger bulge ages.
Radial velocity data, particularly from the BRAVA survey (Howard et al. 2008, 2009), are consistent with the faint RC population being more distant than the bright RC population. Proper motion results from Sumi et al. (2003) and V07 are also generally consistent with a distance interpretation.
An immediate conclusion is that these two co-existing populations are not consistent with the body of a bar, since the line of sight through a bar should occur at one distance, not two. Other evidence against these populations being in the body of a bar is the fact that both populations mostly exist at fixed distances, independent of longitude; in particular, the foreground RC peak K0 magnitude is unchanged over 9∘ in longitude. This is in stark contrast to a bar, which other studies have claimed is pointed almost directly towards us, tilted by only 20∘ to the line of sight. For a bar tilted at 20∘ the distance change over 9∘ in longitude is expected to exceed 2kpc, or roughly 0.7 magnitudes.
When we plot distance of the peaks versus longitude for latitude , and add approximate number counts, we find that the faint and bright RC counts peak near longitudes and , respectively. A line joining these two maxima is tilted, approximately 20∘ to the line of sight and crosses the line within 1 of the distance to the Galactic center, projected onto the plane; this intersection point is roughly midway between the foreground and background populations.
As a function of latitude our luminosity plots show that the two RC peaks are closer in distance at lower Galactic latitudes (i.e., toward the plane), mostly because of an increase in brightness of the background RC. The two RCs appear to merge around . When we make a crude correction to the RC MK for the metallicity gradient with latitude along the minor axis, by Zoccali et al. (2008), we found that a vertical cut through the bulge/bar, at (from to , i.e., as viewed from the side) shows an X-shaped morphology. The center of the X-shape occurs near 7.30.3 kpc, which is equal to, within the uncertainties, the Galactic center distance of Ghez et al (2008), at 8.00.6 kpc. Better agreement between these two centers would be obtained if the bulge is 2–3 Gyr younger than 47 Tuc, or if the metallicity difference between bulge and 47 Tuc RC stars is larger than we assume, or if there is an unspecified systematic error in the theoretical isochrones.
The narrowing of the distance difference approaching the Galactic plane suggests that if this X-shaped structure is connected to the bar, then the bar is significantly shorter closer to the plane.
The RC peak counts above the troughs in the double peaked RC luminosity functions gave a minimum estimate for the fraction of stars in the X versus stars in a broader RC distribution, perhaps from a bar or spheroidal component. This is a minimum because it is possible that the troughs are partly, or entirely, due to the overlapping wings of the distributions of the foreground/background RC components. We found that at ()=() the foreground/background RC X components are at least 20% of the total RC population; at ()=() the foreground/background X-components must be close to 100% of the total RC; on the other hand, near the estimated fraction due to foreground/background components ranges from almost negligible to 100% of the population.
Our analysis of the 2MASS data contains no compelling direct evidence of a Galactic bar, although one may be present in a smooth RC population between the RC peaks. As noted above, at ()=(), the 2MASS data show no room for a bar. Detailed modelling will be required to constrain a bar population in this data. It seems reasonable, however, that the X-shape may merge into a short bar at latitudes below . We note that the radial velocity data of the BRAVA survey shows an increased dispersion near , as expected from a bar. Detailed models of these radial velocities by Shen et al. (2010) provide excellent fits with a pure bar structure; they found that a spheroidal component can be no more than 8% of the total. Our finding that at least 20% of RC stars are in the X-shape component at , rather than a bar, may be in conflict with the 8% limit of Shen et al. (2010); however, their limit refers to a spherical distribution, rather than arcs at the ends of a bar, so it is possible that no conflict exists.
A reasonable, qualitative, model to explain the observations presented here is that the high-latitude bulge (above 6∘) is dominated by the vertical extent of stars near the foreground and background ends of a Galactic bar. In this scenario stars extend in all directions from the ends of the bar, i.e., in both longitude and latitude. In longitude the stars occupy arcs, or partial orbits, emanating from the bar ends. For this reason, a line connecting the peaks in the foreground/ background RC populations trace the direction of the bar, tilted at 20∘ to the line of sight, assuming that there is no significant rotational lag. The axis of rotation of the bar is marked by the point where this line intersects with . In Figure 8 this point is located at 7.7 kpc from the sun; it happens to lie roughly midway between the two RCs and within 1 of the Galactic center distance. This arrangement should produce symmetry in the mean radial velocity curve, similar to the BRAVA observations. Because the bar is almost end-on, the stars in the arcs, near the bar ends, spread almost tangentially to the line of sight, and thus appear at a nearly constant distance, as observed. However, at large angular distance, in longitude, from the bar ends, the stars along the arcs/orbits are closer to the Galactic center distance, also observed. Since stars emanating from the bar ends do so in all directions, they appear as two roughly circular areas, and take-on a peanut appearance when viewed nearly end-on to the bar; a slight flattening of the peanut may be expected due to the gravitational potential in the latitude direction. When viewed from the side, the structure takes on an X-shape morphology, as the stars emanating from the bar ends merge into the bar. In this case the main component of the bar resides at low Galactic latitudes, and perhaps for this reason the end components are relatively easy to detect at high latitude.
An alternative description is that there is only an X-shaped component which extends to high latitudes, but without connecting to a bar. As before, since we are looking almost end-on to the axis of the X, the foreground and background appear at nearly constant distances. Another, alternative, explanation of the observed two RC components is that we have detected concentrations in the thick disk near the ends of the bar. If correct, this scenario might naturally explain the similarity of the composition of thick disk and bulge red giant stars found by Alves-Brito et al. (2010).
If our two populations represent extensions from the ends of a bar, then their velocities should show cylindrical rotation, similar to bar models, but with a distribution not considered by Shen et al. (2010). One major difficulty is that our results suggest a end-to-end bar length of 2.5 kpc, whereas the best fit model of Shen et al. (2010) indicates a bar half-length of 4kpc.
X-shape, boxy, and peanut morphologies of extra-galactic bulges are well known phenomena, e.g., IC 4767, NGC 128, NGC 4469, IC 2531 (e.g., Whitmore & Bell 1988; Bureau et al. 2006.) The X-shapes are relatively minor components of extra-galactic bulges, and significant image processing is usually required to highlight them, in stark contrast to the strong signal we find here for the Galaxy.
N-body simulations of isolated disk galaxies and the growth of bars (e.g., Patsis et al. 2002; Athanassoula 2005) find X-shape morphologies resulting from bar growth. In particular, the x1v1 resonance mode of Patsis et al. (2002) appears very similar to our results for the Galaxy. If these predictions are correct, the implication is that the bulge X-shape resulted from bar instabilities, and that the Galaxy contains a pseudo-bulge, and a bar, rather than a classical bulge. X-morphologies also result from mergers, although bars are still involved: Mihos et al. (1995) performed numerical simulations of satellite accretion by S0 galaxies, and found that prograde accretion induced the formation of bars, which subsequently buckled and produced X structures. Since the formation of a bar from an isolated disk galaxy relies on interactions between its disk and halo, the overlap between these two mechanisms is greater than at first apparent.
Pseudo-bulges and bars are expected to display cylindrical rotation (e.g., Athanassoula 2005), which is consistent with the radial velocity BRAVA survey as noted by Howard et al. (2008, 2009).
Typical timescales for pseudo-bulge growth is 1 Gyr (e.g., Athanassoula 2008), which may be problematic for a rapid formation timescale for the Galactic bulge (e.g., Ballero et al. 2007), as implied by the enhanced [Mg/Fe] ratios (e.g., Fulbright et al. 2007; Lecureur et al. 2007; McWilliam & Rich 1994); although, both the timescale and the Mg enhancements have associated uncertainties which may bring them into rough agreement.
Another difficulty is that pseudo-bulges/bars are thought to result in well mixed orbits, such that metallicity gradients may not be expected (Zoccali 2010; Howard et al. 2009.) However, the bulge metallicity gradient is well-known (Zoccali et al. 2008), and the metallicities correlate with kinematic properties. It is possible that the gradient simply results from the super-position of two populations (Zoccali et al. 2010; Babusiaux et al. 2010; Hill et al. 2010.) Howard et al. (2009) speculated that dissipative processes during bar formation might explain the metallicity gradient.
While an X-shape bulge qualitatively explains the 2MASS photometry and much of the published kinematic data, some literature results are problematic. The 35 km/s radial velocity difference between bright and faint RC found by RWS09 is difficult to understand; asymmetric bar rotation could explain it, but such an asymmetry in velocities is not obvious in the BRAVA data. Also, the 0.4 dex difference in [Fe/H] between and bulge components, found by RW09, suggests an accreted system, rather than a bar or symmetric X-component; however, provisional metallicities from the BRAVA spectra, by Koch (2010, private communication) do not support an [Fe/H] asymmetry. Perhaps the most important difficulty is that the X-shape is evident in our 2MASS data when the dependence of mean [Fe/H] on Galactic latitude is taken into account, without the metallicity corrections the morphology is more K-shaped. This is a problem because the expectation is that the bar should not possess a metallicity gradient, and while X-morphologies are well known in external galaxies, we are unaware of K-morphologies. The final piece of confusing evidence is the lack of difference between the mean proper motions of bright and faint RC stars in the data of Vieira et al. (2007).
These apparent inconsistencies demand that future work on the kinematics and composition of RC bulge stars be pursued for a more complete picture of the Galactic bulge region. It is particularly important to verify whether there is a metallicity gradient with latitude in the RC X-populations; if so, this would support the idea of Howard et al (2009), that the bar formed with dissipation; if not, then the bulge is K-shaped. If the gradient simply reflects a changing ratio between two populations with different mean [Fe/H], then composition studies of these two populations would be interesting and useful. A definitive investigation of the possible metallicity asymmetry with longitude proposed by Rangwala & Williams (2009) is also necessary. Extant age studies by Zoccali et al. (2003) and Clarkson et al. (2008) should be supplemented with a photometric survey for the ages of bulge stars at =, in order to completely rule-out the possibility that age is responsible for the luminosity difference between the two RCs at this latitude.
Other important future work includes detailed modelling of the 2MASS data, in order to determine the relative proportions of a bar and the foreground/background RC components. A high spatial resolution infrared photometric survey, such as the VISTA Variable in the Vía Láctea survey (VVV, Minniti et al. 2010), covering roughly the same longitudinal extent as the current work, but going to much smaller latitudes will help to determine whether the X-shape continues to the Galactic center, or joins the bar. Analysis of the premilinary VVV catalogues is ongoing (Saito et al. 2010, in preparation). Independent verification of the foreground/background distances, at high latitude, with standard candles, such as Miras, strong-lined RR Lyrae stars, and eclipsing binaries, will also be very helpful.
After this paper was submitted for publication Nataf et al. (2010) reported a split RC toward the Galactic bulge. Their findings are broadly consistent with the results of this paper; in particular, they find very nearly equal (VI) colors, consistent with similar metallicity for the two RC components.
Acknowledgements
Part of this work was performed by AM while visiting the KITP in Santa Barbara, which is supported under NSF grant PHO5-51164. AM thanks Andreas Koch for a useful conversation. MZ acknowledges the FONDAP Center for Astrophysics 15010003, the BASAL Center for Astrophysics and Associated Technologies PFB-06, FONDECYT Regular 1085278, and the MIDEPLAN Milky Way Millennium Nucleus P07-021-F.
References
- Alonso et al. (1999) Alonso, A., Arribas, S., & Martinez-Roger, C. 1999, A&AS, 140, 261
- Alves (2000) Alves, D.R. 2000, ApJ, 539, 732
- Alves-Brito (2010) Alves-Brito, A., Meléndez, J., Asplund, M., Ramírez, I., Yong, D. 2010, A&A, 513, 35
- Athanassoula (2005) Athanassoula, E. 2005, MNRAS, 358, 1477
- Athanassoula (2008) Athanassoula, E. 2008, in “Formation and Evolution of Galaxy Bulges”, IAU Symposium, Volume 245, p. 93-102, eds. Martin Bureau, E. Athanassoula & Beatriz Barbuy (Cambridge: CUP)
- Babusiaux & Gilmore (2005) Babusiaux, C., & Gilmore, G. 2005, MNRAS, 358, 1309
- Babusiaux et al. (2005) Babusiaux, C., et al. 2010, A&A, 519, 77
- Ballero et al. (2007) Ballero, S.K., Matteucci, F., Origlia, L., & Rich, R.M. 2007, A&A, 467, 123
- Binney et al. (1997) Binney, J., Gerhard, O., & Spergel, D. 1997, MNRAS, 288, 365
- Blitz & Spergel (1991) Blitz, L., & Spergel, D.N. 1991, ApJ, 379, 631
- Bureau et al. (2006) Bureau, M., Aronica, G., Athanassoula, E., Dettmar, R.-J., Bosma, A., & Freeman, K.C. 2006, MNRAS, 370, 753
- Cabrera-Lavers et al. (2007) Cabrera-Lavers, A., Hammersley, P.L., González-Fernández, C., López-Corredoira, M., Garzón, F., & Mahoney, T.J. 2007, A&A, 456, 825
- Clarkson et al. (2008) Clarkson, W., et al. 2008, ApJ, 684, 1110
- Dwek et al. (1995) Dwek, E., Arendt, R.G., Hauser, M.G., Kelsall, T., Lisse, C.M., et al. 1995, ApJ, 445, 716
- Ferraro et al. (2009) Ferraro, F.R., et al. 2009, Nature, 462, 483
- Fulbright, McWilliam & Rich (2007) Fulbright, J.F., McWilliam, A., & Rich, A. 2007, ApJ, 661, 1152
- Ghez et al. (2008) Ghez, A.M. 2008, ApJ, 689, 1044
- Harris (1996) Harris, W.E. 1996, AJ, 112, 1487
- Hill (2010) Hill, V., et al. 2010, A&A submitted
- Howard et al. (2008) Howard, C.D., Rich, R.M.,Reitzel, D.B., Koch, A., De Propris, R. & Zhao, H. 2008, ApJ, 688, 1060
- Howard et al. (2009) Howard, C.D., et al., 2009, ApJ, 702, L153
- Koch & McWilliam (2008) Koch, A., & McWilliam, A. 2008, AJ, 135, 1551
- Lecureur et al. (2007) Lecureur, A., Hill, V., Zoccali, M., Barbuy, B., Gómez, M., Minniti, D., Ortolani, S., & Renzini, A. 2007, A&A, 465, 799
- Liszt & Burton (1980) Liszt, H.S., & Burton, W.B. 1980, ApJ, 236, 779
- Majaess (2010) Majaess, D. 2010, AcA, 60, 55
- Mao & Paczyński (2002) Mao, S., & Paczyński, B. 2002, MNRAS, 337, 895
- Matsumoto et al. (1982) Matsumoto, T. et al. 1982, in The Galactic Center, eds. G. Riegler & R. Blandford (New York: American Institute of Physics), 48
- McWilliam & Rich (1994) McWilliam, A., & Rich, R.M. 1994, ApJS, 91, 749
- McWilliam et al. (2010) McWilliam, A., Fulbright, J., & Rich, R.M. 2010, in “Chemical Abundances in the Universe: Connecting First Stars to Planets”, IAU Symposium, Volume 265, p. 279-284, eds. Katia Cunha, Monique Spite & Beatriz Barbuy (Cambridge: CUP)
- Mihos (1995) Mihos, J.C., Walker, I.R., Hernquist, L., Mendes de Oliveira, C., & Bolte, M. 1995, ApJ, 447, L87
- Minniti (1996) Minniti, D. 1996, ApJ, 459. 579
- Minniti (2010) Minniti, D., et al. 2010, NewA, 15, 433
- Nataf et al. (2010) Nataf, D.M., Udalski, A., Gould, A., Fouqué, P., & Stanek, K.Z. 2010, arXiv:1007.5065
- Nishiyama et al. (2005) Nishiyama, S., et al. 2005, ApJ, 621, L105
- Nishiyama et al. (2006) Nishiyama, S., Nagata, T. et al. 2006, Journal of Physics: Conference Series, Volume 54, Proceedings of “The Universe Under the Microscope - Astrophysics at High Angular Resolution”, eds. Rainer Schoedel, Andreas Eckart, Susanne Pfalzner & Eduardo Ros, pp. 62-66 (2006).
- Nishiyama et al. (2009) Nishiyama, S., Tamura, M., Hatano, H., Kato, D., Tanabé, T., Sugitani, K., & Nagata, T. 2009, ApJ, 696, 1407
- Patsis et al. (2002) Patsis, P.A., Skokos, Ch., & Athanassoula, E. 2002, MNRAS, 337, 578
- Pietrinferni et al. (2004) Pietrinferni, A., Cassisi, S., Salaris, M., & Castelli, F. 2004, ApJ, 612, 168
- Pietrinferni et al. (2006) Pietrinferni, A., Cassisi, S., Salaris, M., & Castelli, F. 2006, ApJ, 642, 797
- Rattenbury et al. (2007) Rattenbury, N.J., Mao, S., Sumi, T., & Smith, M.C. 2007, MNRAS, 378, 1064
- Skrutskie et al. (2006) Skrutskie, M.F., et al. 2006, AJ, 131, 1163
- Stanek et al. (1994) Stanek, K.Z., Mateo, M., Udalski, A., Szymanski, M., Kaluzny, J., & Kibiak, M. 1994, ApJ, 429, L73
- Stanek et al. (1997) Stanek, K.Z., Udalski, A., Szymański, M., Kaluzny, J., Kubiak, M., Mateo, M., & Krzeminski, W. 1997, ApJ, 477, 163
- Sumi et al. (2004) Sumi, T., Wu, X., Udalski, A., Szymański, M., & Kubiak, M. 2004, MNRAS, 348, 1439
- Rangwala et al. (2009) Rangwala, N., Williams, T.B., & Stanek, K.Z. 2009, ApJ, 691, 1387 (RWS09)
- Rangwala & Williams (2009) Rangwala, N., & Williams, T.B. 2009, ApJ, 702, 414 (RW09)
- shen et al. (2010) Shen, J., Rich, R.M., Kormendy, J., Howard, C.D., De Propris, R., & Kunder, A. 2010, ApJ, 720, L72
- vieira (2007) Vieira, K., et al. 2007, AJ, 134, 1432
- Whitmore & Bell (1988) Whitmore, B.C., & Bell, M. 1988, ApJ, 324, 741
- Winkler (1997) Winkler, H. 1997, MNRAS, 287, 481
- Zoccali (2003) Zoccali, M., et al. 2003, A&A, 399, 931
- Zoccali (2008) Zoccali, M., Hill, V., Lecureur, A., Barbuy, B., Renzini, A., Minniti, D., Gómez, A., & Ortolani, S. 2008, A&A, 486, 177
- Zoccali (2010) Zoccali, M. 2010, in “Chemical Abundances in the Universe: Connecting First Stars to Planets”, IAU Symposium, Volume 265, p. 271-278, eds. Katia Cunha, Monique Spite & Beatriz Barbuy (Cambridge: CUP)