Where the granular flows bend
Abstract
Based on IMaX/Sunrise data, we report on a previously undetected phenomenon in solar granulation. We show that in a very narrow region separating granules and intergranular lanes the spectral line width of the Fe i 5250.2 Å line becomes extremely small. We offer an explanation of this observation with the help of magneto-convection simulations. These regions with extremely small line widths correspond to the places where the granular flows bend from mainly upflow in granules to downflow in intergranular lanes. We show that the resolution and image stability achieved by IMaX/Sunrise are important requisites to detect this interesting phenomenon.
1 Introduction
Solar granulation is one of the most studied phenomena in the lower solar atmosphere and its properties are thought to be well understood (Bray et al., 1984). Spectral and imaging observational data have allowed solar granulation to be studied in detail. Commonly considered parameters include sizes and lifetimes of granules, velocity and intensity fluctuations together with their correlations, proper motions of individual features, etc. (e.g., Title et al., 1989; Karpinsky, 1990; Nesis et al., 1993; Espagnet et al., 1995; Hirzberger et al., 1997, 1999; Kostik et al., 2009). At the same time, state of the art simulations of solar convection and magneto-convection reproduce very satisfactorily many observational granulation properties, which has made it possible to explain self-consistently the mean shapes of spectral line profiles (Nordlund et al., 2009). Simulations have shown that parameters as micro- and macroturbulent velocities (used widely in the past to match the spectral lines shapes to observations) are not necessary any more as the spectral lines are broadened by the velocity field of the convection motions.
In this Letter, we report on spatially resolved observations of the line broadening by the granular velocity field (or, equivalently, the spatially resolved action of solar microturbulence). The data used in the Letter were obtained with the Imaging Magnetograph eXperiment (IMaX; see Martínez Pillet et al., 2010) that flew on board the Sunrise balloon telescope in June, 2009 (Barthol et al., 2010; Solanki et al., 2010). We study the spatial variations of the full width at half maximum (FWHM) of the Fe i 5250.2 Å line. We found that the FWHM is larger in intergranular lanes and smaller in granules. But the most interesting finding is that the FWHM is particularly small in narrow lanes located at granular/intergranular borders. We found only few works that discuss the relation between the line FWHM and granulation (e.g. Nesis et al., 1992; Hanslmeier et al., 2008), pointing out that the FWHM is anti-correlated with brightness. The observations of Nesis et al. (1992) were interpreted in terms of supersonic flows, which was questioned by Solanki et al. (1996). We did not find any previous mention of the detection of the narrow regions with extremely small FWHM adjacent to intergranular borders. The aim of this Letter is to describe their properties and to offer an explanation for their origin.


2 Observed line width
The IMaX instrument and the details of the data acquisition and reduction are described in Martínez Pillet et al. (2010). Here we use a time series of images of about 23 min duration taken near the solar disc center (UT 00:37). The observational sequence consists of five polarized filtergrams taken at , and mÅ from the Fe i 5250.2 Å line center. We use Level 2 data (reconstructed by deconvolution). The spatial resolution of the reconstructed data is estimated to be 015. The field of view is about 33′′ 33′′ (after removing the apodized areas), with a pixel size of 0055. We use the following parameters extracted from the Stokes data: continuum intensity, line of sight velocity, and FWHM. The latter two parameters were calculated from Gaussian fits to the five intensity wavelength points. The statistical errors of the fitting procedure were within the range of 20–40 m s-1 for the velocities and a few mÅ to 10 mÅ (at most) for the FWHM.
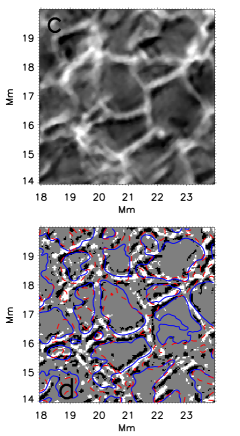
Figure 1 shows an image of the FWHM at one moment of time. This image demonstrates clearly that the width of the Fe i 5250.2 Å intensity profile follows the granulation structure. The FWHM increases in intergranular lanes (appearing as bright regions) and becomes smaller in granules. A more careful inspection of the image reveals that adjacent to almost each intergranular lane there are narrow black regions (that also have elongated lane-like shapes) of smaller widths. The average FWHM of the Fe i 5250.2 line in the granular regions is of 120 mÅ, in intergranular regions is of 140 mÅ, but only 100 mÅ at the borders between granules and intergranular lanes. The unsharp mask filter111The algorithm that works by enhancing the contrast between neighboring pixels in an image applied to this image enhances the gradients and makes the locations with extremely small FWHM more evident (Fig. 1b). Panels c and d with enlarged view of the region of 6 Mm 6 Mm size (marked by the white squares in Figs. 1a and b) give some very clear examples of the dark lanes surrounding bright intergranular spaces. These dark features sometimes appear only on one side of the bright intergranular lane, and sometimes on both sides. In many cases they appear in regions where the normalized continuum intensity , i.e. just at the borders between granules and intergranular lanes. The width of these dark features is about IMaX pixels, i.e. 02. Their lifetime is the same as the lifetime of the intergranular lane they are attached to, see Fig. 2 (left and middle panels). These dark lanes in the FWHM image appear also in the non-reconstructed data (with less contrast), proving that they are not artifacts of the phase diversity reconstruction procedure.


3 Origin of the dark lanes
To find the origin of these dark lanes in FWHM images, we have performed spectral line synthesis of the Fe i 5250.2 Å line in a snapshot of magneto-convection simulations (Vögler et al., 2005). We considered a simulation run with a bi-polar magnetic field structure and an average unsigned magnetic field in the box of 30 G, corresponding to a quiet solar region (for more details on this simulation snapshot see Khomenko et al., 2005). The grid size of the simulations is about 20 km. The synthesis was done in LTE using the SIR code (Ruiz Cobo & Del Toro Iniesta, 1992). No additional line broadening mechanisms, such as macro- or microturbulence were introduced.
We found that the areas with extremely narrow intensity profiles adjacent to intergranular lanes also appear in the simulations. For an adequate comparison with the observations we have degraded the simulation spectra in the following way. Firstly, we performed a convolution of each monochromatic image with an Airy function imitating the action of a 100 cm telescope. Secondly, we convolved the spectra in wavelength with the transmission profiles of the IMaX etalon. Finally, we fit a Gaussian function to the five wavelength points and calculated the width of the Gaussian profiles as a proxy to the intensity profile width, as well as velocity, similar to the observations. The resulting image of the simulated FWHM is shown in Figure 3a.
The FWHM image shows structures similar to the observed ones, i.e. larger FWHM in intergranular lanes and very low FWHM in the narrow regions adjacent to lanes. Note that the average value and the range of variations agree very well in the simulations and observations. Similar to the observations, the dark lanes in the FWHM image correspond to the normalized continuum intensity around unity, i.e. they mark the transition between granules and intergranular lanes (Fig. 3b). Their width is a few pixels (02).

Due to the small width of these dark lanes, about 02, high resolution and image stability are required for their detection. Figure 3c shows the FWHM after the simulated spectra were degraded to Hinode resolution and pixel size (note that the Fe i 6301.5 Å is used in this case). This image preserves brightenings in intergranular lanes corresponding to large FWHM, but the adjacent dark lanes do not show up at this resolution. On the one hand, this comparison demonstrates that IMaX/Sunrise data quality is necessary to detect these features. On the other hand, it proves that the instrument reached indeed very high spatial resolution (Berkefeld et al., 2010).
The IMaX spectral line of Fe i 5250.2 at Å is sensitive to the velocity broadening, but also to magnetic fields via the Zeeman effect, and to temperature. To find out which effect is primarily responsible for the spatial variations of the FWHM, we performed additional calculations. We repeated the spectral synthesis for three cases: (1) magnetic field was set to zero, preserving the variations in the rest of the variables; (2) horizontal variations of the temperature and gas pressure were set to zero using for all the points the mean stratification, but preserving variations of the velocity and magnetic field; (3) velocity was set to zero at all points, while preserving variations in the rest of the variables.
We found that the magnetic field’s influence on the horizontal variations of the FWHM is negligible except for a few isolated locations in intergranular lanes where the field reaches kG values. There the FWHM is additionally enhanced by the Zeeman broadening. Figure 4 gives the variations of the FWHM in the cases (2) and (3). Case (2), where only velocity variations are preserved, looks almost identical to the original case in Fig. 3a. While case (3), where only variations of the thermodynamic variables are preserved, looks very different, showing almost an opposite behaviour to the case (2). Note that, curiously, in the case (3) the broadening due to magnetic field becomes evident in some intergranular lanes where the field is strongest (locations at Mm; Mm and Mm; Mm in the right panel of Fig.4). The broadening due to magnetic field is much weaker compared to the velocity broadening, but is comparable in magnitude to the thermal broadening. The average value of the FWHM and its standard deviation is much lower for the case (3) as compared to the case (2) and to the observations. Thus, we conclude that velocity broadening is the prime responsible for the horizontal variations of the FWHM.
Figure 5 shows several examples of the velocity field at the locations marked by letters in Fig. 3b. At these locations the red line crosses an intergranular lane with enhanced FWHM as well as the transition between granule and intergranule with very low FWHM. As follows from Fig. 5, all these locations have features in common. At the center of an intergranular lane, in the deep photospheric layers, the vertical velocity is mainly a downflow with a magnitude reaching about km s-1. The intergranular lanes are also characterized by a strong vertical velocity gradient. In a few hundred kilometers, the velocity decreases from km s-1 to zero, following the change of its sign at the top of the atmosphere. These strong velocity gradients have immediate implications on the width of the Fe i 5250.2 Å line profiles, whose core forms around 400 km (Gurtovenko & Kostik, 1989). The action of these vertical velocity gradients over the height range of formation of the line is similar to the action of microturbulence velocity, producing additional broadening of the profiles. We conclude that the large FWHM in intergranular lanes is produced by a microturbulence-like effect due to strong vertical velocity gradients, unlike the mechanism based on super-sonic flows proposed by Nesis et al. (1992). Similar conclusion, as for the enhancement of the FWHM in intergranular lanes, was previously reached in the work of Gadun et al. (1997) from studying the line-parameter variations in the two-dimensional hydrodynamic simulations.
Figure 5 shows that the regions with extremely low FWHM correspond to the locations where the granular flow bends. These locations are the transitions from granules with upflowing velocities to intergranular lanes with downflows. As the velocity vector bends there, the vertical velocity component is close to zero and the vertical velocity gradient is very small as well. It makes the velocity broadening at these transition locations extremely low, thus producing narrow profiles, as detected in the IMaX observations. In Fig. 3b the red dashed contours mark the location with zero vertical velocity in simulations. It shows that almost always these locations coincide with dark lanes in FWHM image.
The IMaX data only have five points in wavelength, making it impossible to check the conclusions about the velocity gradients, obtained from simulations. However, the absolute values of the LOS velocities are reliably obtained from these data. According to simulations, the regions with extremely low FWHM correspond to locations with almost zero vertical velocities. In Fig. 2 (right panel), we plot the LOS velocity histograms obtained from the IMaX data over the whole time series. This figure shows the existence of the three distinct families of features. Granules, selected as locations with , have the velocity histogram peak at km s-1. Intergranular lanes, selected as locations with , show downflowing velocities with the histogram peak at 0.4 km s-1. This histogram almost coincides with the one obtained by selecting locations with enhanced FWHM given by white regions in Fig. 1b. Finally, there is a third distribution corresponding to the borders between granules and intergranular lanes. It is obtained by selecting locations with low FWHM given by the black regions in Fig. 1b. Its maximum appears at zero LOS velocity. This observational confirmation supports the conclusion based on simulations that the regions with extremely small FWHM correspond to locations where the velocity vector bends, producing a zero LOS velocity component.
4 Conclusions
In this Letter we have investigated the spatial distribution of the full width at half maximum of the Fe i 5250.2 Å intensity profiles in the IMaX/Sunrise data. We have shown that the FWHM becomes large in intergranular lanes and is very small in narrow 02 wide strips adjacent to the lanes. The lifetime of these narrow regions is the same as the intergranular lanes they are attached to and they evolve in parallel. Based on the similarity between IMaX observations and simulations of magneto-convection, we have offered an explanation for the formation of these profiles with small FWHM. We suggest that these profiles appear in regions where the granular flow bends. There, the velocity broadening is extremely small, as the LOS velocity component is close to zero and has very small gradients. This conclusion is supported by the analysis of the LOS velocity histograms in the IMaX data. We claim that the Sunrise/IMaX resolution and image stability is the necessary condition to detect these narrow transition zones between granules and intergranular lanes.
References
- Barthol et al. (2010) Barthol, P., Gandorfer, A., Solanki, S. K. et al. 2010, Solar Phys., submitted
- Berkefeld et al. (2010) Berkefeld, T. et al. 2010, Solar Phys., submitted
- Bray et al. (1984) Bray, R. J., Loughhead, R. E., & Durrant, C. J. 1984, The solar granulation (Cambridge and New York, Cambridge University Press, 1984, 270 p.)
- Espagnet et al. (1995) Espagnet, O., Muller, R., Roudier, T., Mein, N., & Mein, P. 1995, A&AS, 109, 79
- Gadun et al. (1997) Gadun, A. S., Hanslmeier, A., & Pikalov, K. N. 1997, A&A, 320, 1001
- Gurtovenko & Kostik (1989) Gurtovenko, E. A. & Kostik, R. I. 1989, Fraunhofer Spectrum and the System of Solar oscillator Strengths (Kiev: Russian Language Edition, Naukova Dumka)
- Hanslmeier et al. (2008) Hanslmeier, A., Kučera, A., Rybák, J., & Wöhl, H. 2008, Sol. Phys., 249, 293
- Hirzberger et al. (1999) Hirzberger, J., Bonet, J. A., Vázquez, M., & Hanslmeier, A. 1999, ApJ, 527, 405
- Hirzberger et al. (1997) Hirzberger, J., Vázquez, M., Bonet, J. A., Hanslmeier, A., & Sobotka, M. 1997, ApJ, 480, 406
- Karpinsky (1990) Karpinsky, V. N. 1990, in The Solar Photosphere: Structure, Convection and Magnetic Fields, ed. J.-O. Stenflo, Proceedings IAU Symposium 138 (Kiev) (Dordrecht: Kluwer), 23–27
- Khomenko et al. (2005) Khomenko, E. V., Martínez González, M. J., Collados, M., Vögler, A., Solanki, S. K., Ruiz Cobo, B., & Beck, C. 2005, A&A, 436, L27
- Kostik et al. (2009) Kostik, R., Khomenko, E., & Shchukina, N. 2009, A&A, 506, 1405
- Martínez Pillet et al. (2010) Martínez Pillet, V., J. C. del Toro Iniesta, Alvarez-Herrero, A., & et al. 2010, Solar Phys., submitted
- Nesis et al. (1992) Nesis, A., Bogdan, T. J., Cattaneo, F., Hanslmeier, A., Knoelker, M., & Malagoli, A. 1992, ApJ, 399, L99
- Nesis et al. (1993) Nesis, A., Hanslmeier, A., Hammer, R., Komm, R., Mattig, W., & Staiger, J. 1993, A&A, 279, 599
- Nordlund et al. (2009) Nordlund, Å., Stein, R. F., & Asplund, M. 2009, Living Reviews in Solar Physics, 6, 2
- Ruiz Cobo & Del Toro Iniesta (1992) Ruiz Cobo, B. & Del Toro Iniesta, J. C. 1992, ApJ, 398, 375
- Solanki et al. (1996) Solanki, S. K., Rüedi, I., Bianda, M., & Steffen, M. 1996, A&A, 308, 623
- Solanki et al. (2010) Solanki, S. K., Barthol, P., 2010, Solar Phys., submitted
- Title et al. (1989) Title, A. M., Tarbell, T. D., Topka, K. P., Ferguson, S. H., Shine, R. A., & SOUP Team. 1989, ApJ, 336, 475
- Vögler et al. (2005) Vögler, A., Shelyag, S., Schüssler, M., Cattaneo, F., Emonet, T., & Linde, T. 2005, A&A, 429, 335