On the Origin of the Extended H Filaments in
Cooling Flow Clusters
Abstract
We present a high spatial resolution H survey of 23 cooling flow clusters using the Maryland Magellan Tunable Filter (MMTF), covering 1–2 orders of magnitude in cooling rate, dM/dt, temperature and entropy. We find 8/23 (35%) of our clusters have complex, filamentary morphologies at H, while an additional 7/23 (30%) have marginally extended or nuclear H emission, in general agreement with previous studies of line emission in cooling flow cluster BCGs. A weak correlation between the integrated near-UV luminosity and the H luminosity is also found for our complete sample, with a large amount of scatter about the expected relation for photoionization by young stars. We detect H emission out to the X-ray cooling radius, but no further, in several clusters and find a strong correlation between the H luminosity contained in filaments and the X-ray cooling flow rate of the cluster, suggesting that the warm ionized gas is linked to the cooling flow. Furthermore, we detect a strong enhancement in the cooling properties of the ICM coincident with the H emission, compared to the surrounding ICM at the same radius. While the filaments in a few clusters may be entrained by buoyant radio bubbles, in general, the radially-infalling cooling flow model provides a better explanation for the observed trends. The correlation of the H and X-ray properties suggests that conduction may be important in keeping the filaments ionized. The thinness of the filaments suggests that magnetic fields are an important part of channeling the gas and shielding it from the surrounding hot ICM.
1 Introduction
The high densities and low temperatures of the intracluster medium (hereafter ICM) in the cores of some galaxy clusters imply massive amounts of gas cooling radiatively out of the ICM. Early studies (see review by Fabian 1994) suggested that cooling flows on the order of 100–1000 M⊙ yr-1 should be depositing massive amounts of cold gas onto the brightest cluster galaxy (hereafter BCG) in the cluster core. The lack of evidence for such large amounts of cold molecular gas or young stars is often referred to as the “cooling flow problem”. More recent studies suggest that the cooling region is much smaller than previously thought (Peres et al. 1998), which implies overall lower estimates on the mass deposition rate. Additionally, it is now generally accepted that some form of heating balances the radiative cooling, leading to cooling flow rates on the order of 1–10 M⊙ yr-1. Mechanical and radiative feedback from AGN and starbursts (e.g. Peterson & Fabian 2006, Veilleux, Cecil & Bland-Hawthorn 2005), gas sloshing in the cluster core (e.g. Zuhone et al. 2009), merger shocks (e.g. Randall et al. 2002) and conduction from the surrounding ICM (e.g. Voigt & Fabian 2004) have all been suggested as possible contributors to ICM heating. However, the relative importance of each process remains unclear.
The presence of optical line-emitting nebulae, found primarily in cooling flow clusters, is a clue that cooler ( 104 K) gas coexists with the ICM and that cooling flows may not be entirely ruled out (Hu et al. 1985, Heckman et al. 1989, Crawford et al. 1999; Jaffe et al. 2005, Hatch et al. 2007). However, while several intriguing ideas have been put forward, the origin of this gas and the mechanism for heating it are, as yet, unknown. While the presence of cool gas could be attributed to the purported cooling flow, one would then naively expect a relatively symmetric geometry and a strong connection of optical emission lines with X-ray properties. However, this is not generally the case. Crawford et al. (2005) investigate a specific scenario, the extended H filament in Abell 1795, and suggest as an explanation a cooling wake, produced by a symmetric cooling flow falling onto the brightest cluster galaxy (hereafter BCG) which has a high relative velocity at the center of the cluster. Oegerle & Hill (2001) find that 15% of BCGs are moving with a high peculiar velocity, so an asymmetric distribution of warm gas in this fraction of clusters would be relatively straightforward to explain in this context. Potentially contributing heating/ionization sources in the filaments include (i) the central AGN, (ii) hot young stellar population outside the cD galaxy nucleus, (iii) X-rays from the ICM itself, (iv) heat conduction from the ICM to the colder filaments, (v) shocks and turbulent mixing layers, and (vi) collisional heating by cosmic rays (Crawford et al. 2005; Ferland et al. 2009).
In star forming regions, the presence of ionized hydrogen is a prime indication of the rate and location of star formation. While several cooling flow clusters have been observed to have non-zero star formation rates at their center, based on UV (Hicks & Mushotzky 2005) and infrared (O’Dea et al. 2008) observations, it is not immediately clear whether newly formed stars are fully responsible for the flux and morphology of the observed H emission. Indeed, there has been very little work done on the spatial correlation between the star forming and warm components in cooling flow cluster centers. What has become clear from recent studies is that, in general, the measured star formation rate in the BCG is consistently less than the spectroscopically determined X-ray cooling rate for the cluster by a factor of 3-10 (i.e. Rafferty et al. 2006; O’Dea et al. 2008), implying that not all of the cooling gas is turning into stars with a Salpeter (1955) IMF.
A major problem standing in the way of an explanation of these filaments is that there are still only a small number of known cases with clearly extended emission beyond the nucleus of the BCG. This is due to the paucity of narrow-band filters which can be tuned to cosmological redshifts. Attempts have been made to quantify the fraction of BCGs which exhibit H emission using the Sloan Digital Sky Survey (e.g. Edwards et al. 2007). However, spectroscopic studies usually only tell us about the very center of the BCG, which can be bright in H if an AGN is present. What is needed is a deep, wide-field, narrow-band survey of clusters of various richness in order to assess the ubiquity, extent, and topology of the warm gas. Some progress has been made towards this end by Jaffe et al. (2005), using the Taurus Tunable Filter (TTF; Bland-Hawthorn & Jones 1998). The use of a tunable filter allows the observer to tune to a large range in wavelengths with a narrow bandwidth ( 10Å). The ability to tune the wavelength is particularly useful when observing cooling flow clusters, of which there are very few in the local Universe.
In the pilot study leading to this survey paper, McDonald & Veilleux (2009; hereafter MV09) observed Abell 1795 in H with the Maryland Magellan Tunable Filter (hereafter MMTF; Veilleux et al. 2010) in H. The well-known southeast filament which extends 50 kpc from the BCG was found to be, in fact, two separate thin strands. These thin filaments were resolved into chains of point sources in the far-UV with the Hubble Space Telescope (HST) Advanced Camera for Surveys Solar Blind Channel. We suggested that these strands of H were, in fact, a cooling wake produced by the cooling flow falling onto a cD galaxy which is plowing through the center of the cluster. As the gas cools, it collapses into thinner filaments, eventually leading to star formation which will ionize the gas. The thinness of the filaments suggests that magnetic fields are likely important to prevent turbulence from erasing them, but this is just speculation without any direct evidence of a strong magnetic field in the filaments. Although it is likely more complicated than this (we observe higher-than- expected [N II]/H ratios, and a slight spatial offset between the UV and H), this scenario can explain the general structure of the H complex.
In order to have a more complete picture of the extended H emission in galaxy clusters, we have undertaken a survey of 23 clusters with a wide variety of properties using the MMTF. In the following section we describe our sample selection, as well as the acquisition and analysis of the data. In §3, we present the results of the analysis and in §4 discuss the various implications of these results. Finally, in §5 we present a summary of the results. Throughout this paper, we assume the following cosmological values: H0 = 73 km s-1 Mpc-1, = 0.27, = 0.73.
2 Data Collection and Analysis
In order to have a more complete picture of cool core clusters, we have undertaken a multi-wavelength survey of 23 cooling flow clusters. From an initial sample size of 232 clusters, which cover 2 orders of magnitude in dM/dt and with X-ray temperatures ranging from 1-12 keV, (full sample from White et al. 1997) we enforced the following cuts: and . These cuts ensured that (1) the cluster was visible with Magellan, (2) the appropriate blocking filters were available to observe redshifted H, and (3) the cluster angular size did not exceed that of MMTF (30′). These two cuts removed a total of 44 and 62 clusters from the full sample, respectively, leaving a total of 126 observable clusters. From this list, we selected 23 clusters to cover the full range of properties, from very rich clusters with high cooling rates (e.g., Abell 1795, Abell 2029) to low-density clusters with little or no cooling flow (e.g., Ophiuchus, Abell 3376). A summary of these properties for our sample clusters is given in Table 1. As is shown in Table 1, the range in classical cooling rates for this sample is from 6.3–431 M⊙ yr-1, which means that, while we cover a large range in properties, we are examining only cooling flow clusters. This selection criteria should produce a higher fraction of line-emitting BCGs compared to an un-biased cluster sample (see Edwards et al. 2007).
For these 23 clusters, we have data at H (MMTF; 23/23), red continuum (MMTF; 23/23), near-IR (2MASS; 23/23), UV (GALEX, XMM-OM; 21/23) and X-ray (Chandra; 19/23). For those clusters hosting a radio galaxy, we have also extracted VLA 1.4 GHz fluxes from the NVSS (Condon et al. 1998) survey (17/23). The availability of these data are summarized in Table 1.
In the following subsections, we describe in detail the acquisition and reduction of these data.
| Name | z | E(B-V) | TX | Ṁclass |
|---|---|---|---|---|
| (1) | (2) | (3) | (4) | (5) |
| Abell 0085 | 0.0557 | 0.038 | 6.5 | 108 |
| Abell 0133 | 0.0569 | 0.019 | 3.5 | 110 |
| Abell 0478 | 0.0881 | 0.517 | 6.8 | 736 |
| Abell 0496 | 0.0329 | 0.132 | 4.8 | 134 |
| Abell 0644 | 0.0704 | 0.122 | 6.5 | 136 |
| Abell 0780 | 0.0539 | 0.042 | 4.7 | 222 |
| Abell 1644 | 0.0475 | 0.069 | 5.1 | 12 |
| Abell 1650 | 0.0846 | 0.017 | 5.1 | 122 |
| Abell 1795 | 0.0625 | 0.013 | 5.3 | 321 |
| Abell 1837 | 0.0691 | 0.058 | 2.6 | 12 |
| Abell 2029 | 0.0773 | 0.040 | 7.4 | 431 |
| Abell 2052 | 0.0345 | 0.037 | 3.4 | 94 |
| Abell 2142 | 0.0904 | 0.044 | 10.1 | 369 |
| Abell 2151 | 0.0352 | 0.043 | 2.9 | 166 |
| Abell 3158 | 0.0597 | 0.015 | 5.3 | 9.6 |
| Abell 3376 | 0.0597 | 0.056 | 3.5 | 6.3 |
| Abell 4059 | 0.0475 | 0.015 | - | - |
| Ophiuchus | 0.0285 | 0.588 | 8.6 | 41 |
| Sersic 159-03 | 0.0580 | 0.011 | 2.4 | 288 |
| Abell 2580 aafootnotemark: | 0.0890 | 0.024 | 4.3 | 95 |
| Abell 3389 aafootnotemark: | 0.0267 | 0.076 | 2.0 | 22 |
| Abell 0970 bbfootnotemark: | 0.0587 | 0.055 | 4.1 | 20 |
| WBL 360-03 bbfootnotemark: | 0.0274 | 0.028 | 1.8 | 10 |
(1) - Cluster name
(2) - NED redshift of BCG (http://nedwww.ipac.caltech.edu)
(3) - Reddening due to Galactic extinction from Schlegel et al. (1998)
(4) - Cluster X-ray temperature (keV) from White et al. (1997)
(5) - Classical cooling rates (M⊙ yr-1) from White et al. (1997)
a - No available Chandra data
b - No available Chandra, GALEX or XMM-OM data
2.1 H: MMTF
The MMTF has a very narrow bandpass (5–12Å) which can be tuned to any wavelength over 5000-9200Å(Veilleux et al. 2010). Coupled with the exquisite image quality at Magellan and the wide field of the Inamori-Magellan Areal Camera & Spectrograph (IMACS), this instrument is ideal for detecting emission-line filaments in distant clusters. During 2008-09, we observed all 23 clusters at both H (=6563Å) and continuum ( 60Å), for a total of 20 minutes each. If H was detected in a 20-minute exposure, it was followed up for an additional 40 minutes at each wavelength. The typical image quality for these exposures was
These data were fully reduced using the MMTF data reduction pipeline111http://www.astro.umd.edu/veilleux/mmtf/datared.html, which performs bias subtraction, flat fielding, sky line removal, cosmic ray removal, astrometric calibration and stacking of multiple exposures (following Veilleux et al. 2010; see also Jones, Bland-Hawthorn, Shopbell 2002). The continuum image was then PSF and intensity matched to the narrow-band images to allow for careful continuum subtraction. The stacked images were calibrated using spectrophotometric standards from Oke (1990) and Hamuy et al. (1992, 1994) The error associated with our absolute photometric calibrations is 15%, which is typical for tunable filters and spectrographs. Finally, the data were corrected for Galactic extinction, following Cardelli et al. (1989) using reddening estimates from Schlegel et al. (1998). We do not attempt to correct for intrinsic extinction since the dust content of the optical filaments is not well known. All of these procedures are described in detail in Veilleux et al. (2010).
For systems with complicated morphologies, H fluxes were measured by creating (by eye) a region which generously traced the H emission and calculating the total signal within this region. For more symmetric morphologies, a circular aperture centered on the emission peak was used, with the radius chosen to contain all of the obvious emission. Our measured H fluxes (see Table A.1) agree well with those in the literature (e.g., Cowie et al. 1983, Owen et al. 1995, Edge 2001, Jaffe et al. 2005) for the 12 systems with previously published data. In 9 systems we measure slightly higher ( 1.7) total flux, most likely due to our better sensitivity and larger field-of-view. In all other cases, the published “H” flux also include a contribution from [N II] 6548, 6583 and is therefore overestimated. In all cases, the H emission measured from our data is not contaminated by [N II] emission.
2.2 Near-UV: GALEX and XMM-OM
One possible source of H ionization in these clusters is photoionization from hot, young stars. In this scenario we would expect to see associated UV emission, perhaps with filamentary morphology as well. In order to properly assess if this is the case, we have used archival GALEX (1350-1750Å, 1750-2800Å) and XMM-OM (1820-2320Å, 2078-2517Å, 2595-3215Å) data for most of the clusters in our sample. The GALEX data for Abell 1795 comes from our own program (GALEX GI Cycle 5 Program 31; PI Veilleux). These data were corrected for Galactic extinction, following Cardelli et al. (1989) using Galactic reddening estimates from Schlegel et al. (1998).
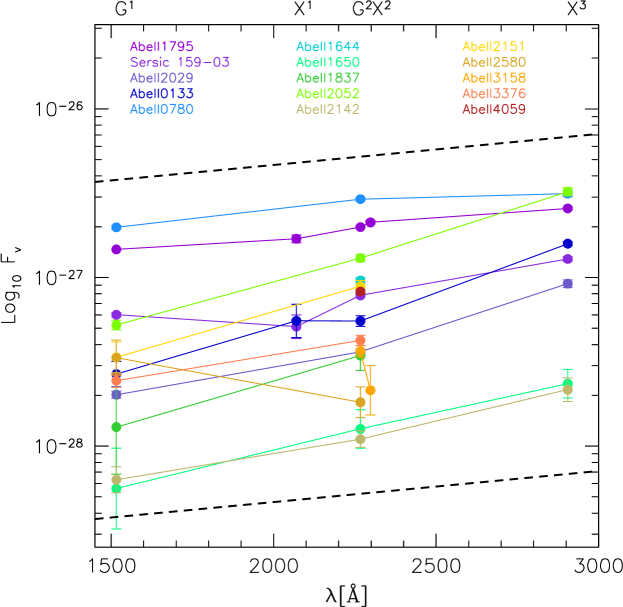
In order to determine the star formation rate (SFR) from the NUV flux, we follow the prescription described in Kennicutt (1998). This technique assumes that SFR with no dependence on wavelength ( is flat) over the range of 1500-2800Å. In Figure 1, we confirm that this assumption is roughly valid for the clusters in our sample and, thus, if dust is present it does not follow the galactic reddening law. For 18 clusters, we have GALEX near-UV (2267Å) data, while the remaining 3 have XMM-OM UVW1 (2905Å) data. The difference in flux that we predict between these filters (from Figure 1) is . Thus, we proceed with merging these two sources of UV data with the caveat that UV fluxes for Abell 0478, 0496 and 1650 may be 30% too high.
Accompanying J-band images were also obtained from 2MASS in order to remove the expected NUV emission from the old stellar population. Motivated by the techniques described in Hicks et al. (2005, 2010), we attempt to remove the NUV contribution from old stellar populations, which we infer from the J-band data. The relationship between the GALEX NUV and 2MASS J-band fluxes follow a powerlaw:
| (1) |
Hicks et al. define a non-star forming control sample in order to calibrate this relationship, consisting of 17 cluster ellipticals and 22 BCGs in clusters without measurable cooling flows. The BCGs in this control sample cover a similar range in J-band luminosity and redshift to the clusters in our sample. Hicks et al. (2010) find = -0.85 0.016 and = 0.89 0.045, with a scatter of 0.08, based on fluxes measured in 7′′ apertures. Since we are interested in detecting extended emission, we instead use a 30′′ aperture, which has the net effect of changing the zero-point of this relation (due to the NUV-J color gradient). Thus, we adjust the zero-point by hand so that it passes through the points with the lowest NUV/J ratios. We find = -0.55 and note that the observed scatter about this fit matches well that quoted by Hicks et al. (2010). Fig. 2 shows this fit, along with that found by Hicks et al. (2010), for the BCGs in our sample. Using this relation, we scaled the measured J-band fluxes to obtain the NUV contribution from the old stellar population, and then subtracted this from the measured NUV flux. Our value of is slightly larger than that of Hicks et al. (2010), due to our use of a larger aperture. We show in the right-hand panel of Fig. 2 that, beyond the 7′′ aperture used by Hicks, the NUV/J ratio is higher at all radii out to 30′′. Thus, a slight increase in is justified.
We do not attempt to correct for intrinsic extinction, due to the fact that not all of our clusters have reddening estimates, thus the lower envelope in Fig. 2 could also contain dusty, star forming galaxies. However, from Crawford et al. (1999), we find that the typical intrinsic extinction in BCGs with strong H emission is E(B-V) = 0.29 0.135. This would induce a scatter of 0.5 in the NUV-J relation. Since the measured scatter is much lower (0.08), we propose that the majority of the galaxies used in the Hicks et al. (2010) NUV-J relation are relatively dust-free. Furthermore, it is unclear how the dust is distributed in the BCG (e.g. Lauer et al. 2005) and, thus, any intrinsic extinction correction would require a significant amount of guesswork.
 |
 |
2.3 X-Ray: Chandra
Archival data from the Chandra X-ray Observatory were retrieved for 19 of our 23 sample clusters. These data were reprocessed with CIAO (version 4.1.2) and CALDB (version 4.1.1) using the latest time-dependent gain adjustments and maps to create new level 2 event files. Due to the large angular extent of the clusters in our sample, we were required to construct blank-sky background event files, using the ACIS blank-sky background database, to properly account for background flux. The new level 2 event files were cleaned for flares, using the routine, by examining the light-curve and removing any spurious bursts in intensity. These data cleaning and calibration procedures are all outlined in detail in the CIAO science threads222http://cxc.harvard.edu/ciao/threads/.
In order to separate any filaments or interesting morphology from the X-ray halo, we performed an unsharp masking technique on each image, subtracting a 10′′ Gaussian smoothed image from a 1.5′′ Gaussian smoothed image. The resulting image highlights any fine structure in the X-ray morphology.
For each cluster, background-subtracted spectra were extracted using . Updated response files were created using and , following the CIAO science threads. Counts were grouped into bins with 20 counts per bin, over the range 0.3 to 11.0 keV. Spectra were extracted in a variety of regions to better understand the relationship between the ICM and the H emission. These regions are described below, followed by a description of the spectral modeling which we apply to these spectra.
2.3.1 Radial Profiles
For all clusters, spectra were extracted from a series of concentric annuli. The maximum annulus was chosen by eye (typically the largest allowable in the CXO field-of-view) and then the interior annuli were chosen iteratively (following Sun et al. 2009) with rout/rin = 1.25–1.6 so that each annulus contained a minimum of 10,000 counts. This choice of spacing allows for a reliable deprojection and fit to the spectra. The innermost annulus was chosen to have an inner radius of 2 pixels, to exclude any contribution from the AGN. The data in this inner region of 2-pixel radius is used to identify possible AGN emission.
2.3.2 Filaments
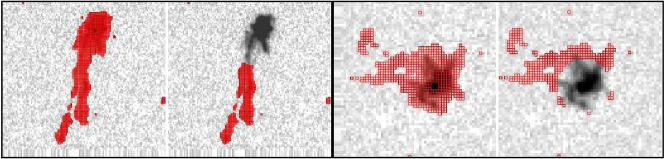
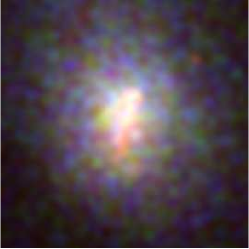
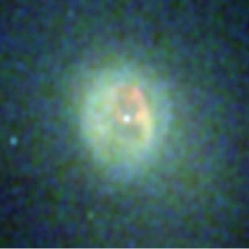
In order to properly investigate any possible connection between the ICM and the presence of H filaments, we also extract X-ray spectra in regions where we detect H emission. A mask was created from the MMTF images by first registering them to the CXO images using the IRAF wregister task. The typical error involved in this process is dependent on the relative astrometric calibrations, which was typically a fraction of a pixel, or 0.1′′. The registered image was then smoothed by 1′′ using a Gaussian kernel. Finally, all pixels with a flux greater than 3- above the background and within RHα (defined as the outermost radius of H emission, measured from the peak of the H emission, see §3.1) were included in the mask. We extracted spectra in four different regions: (1) 0 r RHα, coincident with H, (2) 0 r RHα, anti-coincident with H, (3) 0.3RHα R RHα, coincident with H, (4) 0.3RHα R RHα, anti-coincident with H. These spectra allow for a direct comparison between X-ray derived properties inside and outside of the H filaments, both near the center and at larger radii. An example of the on-filament extraction regions is shown in Figure 3, for Abell 1795 and Abell 0496.
2.3.3 Spectral Modeling
In order to derive physical quantities from the X-ray spectra, we used the XSPEC spectral fitting package (Arnaud 1996). As mentioned above, spectra in radial annuli have also been extracted. This allows for the computation of various parameters such as and as a function of radius. Since the emission in any given annulus is a combination of emission at that radius and also at larger radii seen in projection, we need to deproject the data in each radial bin. We do this using two different techniques: direct spectral deprojection (DSDEPROJ; Russel et al. 2008) and the PROJCT routine in XSPEC. We find DSDEPROJ to yield more stable radial profiles, in agreement with Russel et al. (2008), who showed that PROJCT produces highly fluctuating radial profiles when applied to a spectrum that represents gas at multiple temperatures. Thus the majority of the analysis uses the results from this deprojection. However, it should be mentioned that all of the relevant quantities which we derive from these profiles are robust to the spectral deprojection method used. Along with the spectral deprojection, we used a photoelectric absorption model (PHABS) multiplied by a model for thermal bremsstrahlung emission from a hot diffuse gas (MEKAL). The elements were assumed to be present in the Solar ratios, as measured by Anders & Grevesse (1989). The free parameters for this combination of models are the column density of hydrogen, , the plasma temperature in keV, , the metal abundance of the plasma, , and the normalization of the model, which is directly related to the electron density in the plasma, . The model normalization () is related to the electron density by:
| (2) |
where is the angular diameter distance to the source, in cm, and is the volume of the emitting region. We assume that the X-ray halo is spherical, in order to make the volume calculation straightforward. In order to determine the electron density inside and outside of the ionized filaments, we also need to assume something about their thickness. We discuss this problem further in a later section.
Finally, in order to determine the mass deposition rate in the cooling flow (Ṁspec), we also apply a second set of models to the radially-binned spectra. This new set of models consists of the same deprojection and photoelectric absorption mentioned above, multiplied by the combination of a thermal plasma (MEKAL) and a second plasma component that is cooling (MKCFLOW). The MKCFLOW model has two temperature parameters, high T and low T, which we lock to the temperature of the plasma and to 0.1 keV, respectively. The choice of the low temperature is arbitrary - we simply need it to be lower than the Chandra detection limit ( 0.5 keV) so that this represents gas that has cooled out of the X-ray regime. The metal abundance in the cooling gas is also required to be the same as the plasma. Thus, the only free parameter in this new component is the normalization, which is precisely the spectrally-determined cooling flow rate, Ṁspec.
2.4 1.4 GHz Radio: NVSS
The total 1.4 GHz radio flux at the center of a cluster is a useful diagnostic of AGN activity. For the 20 clusters with in our sample, we used the 1.4 GHz fluxes measured from the NRAO VLA Sky Survey (NVSS; Condon et al. 1998).
3 Results
3.1 Warm Ionized Filaments
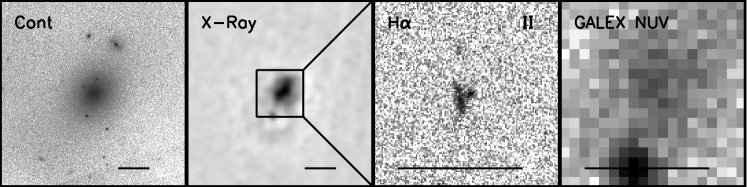
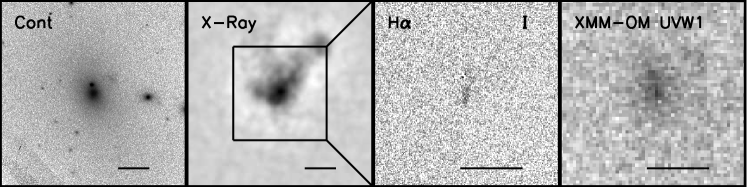
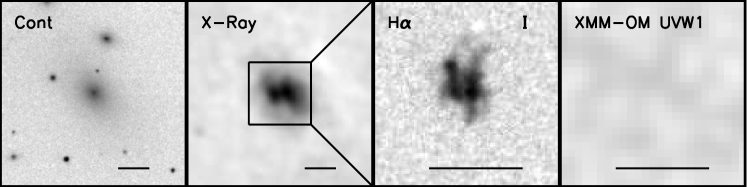
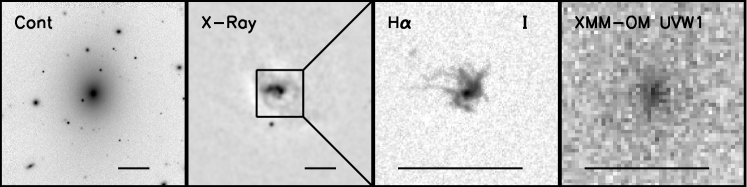
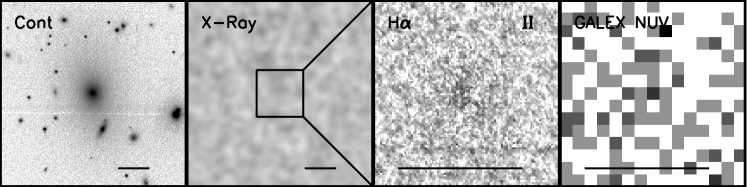
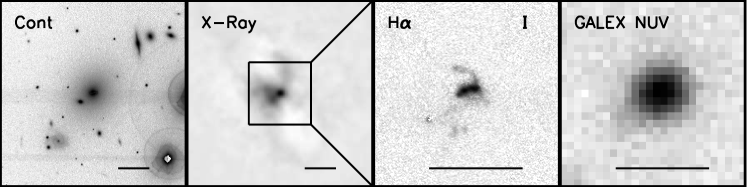
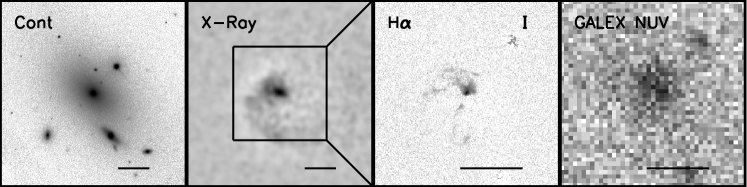
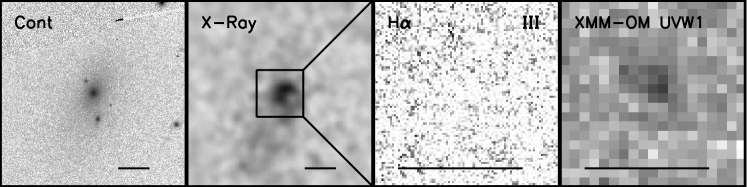
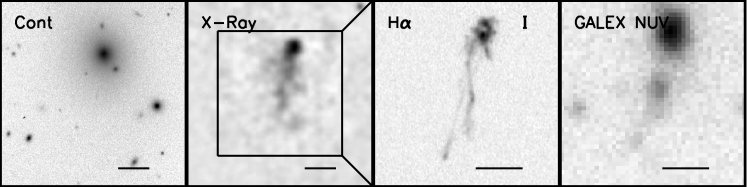
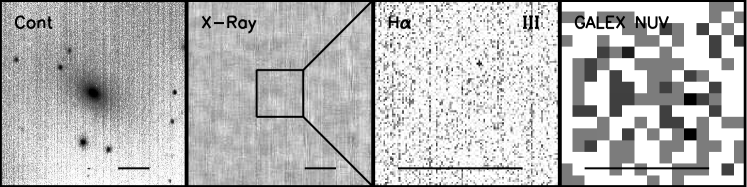
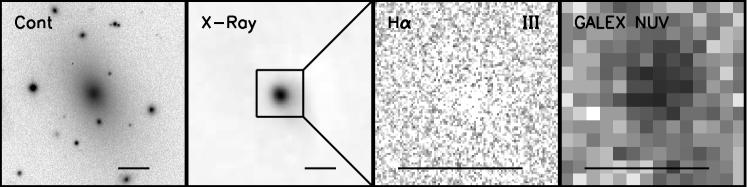
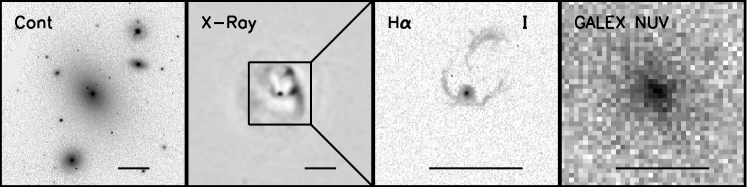
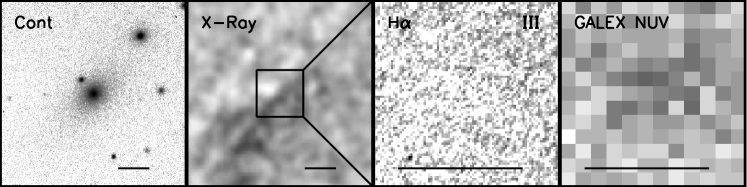
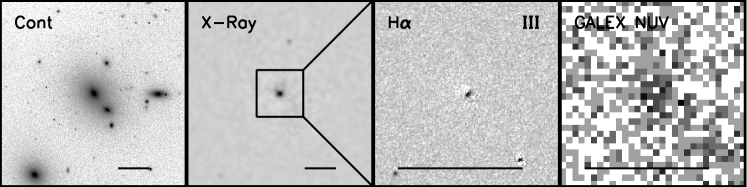
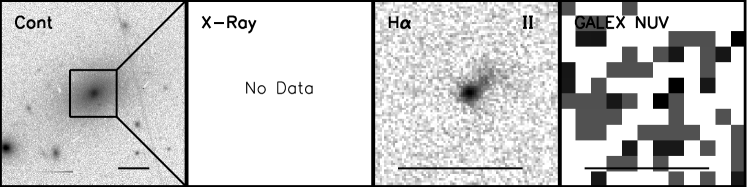
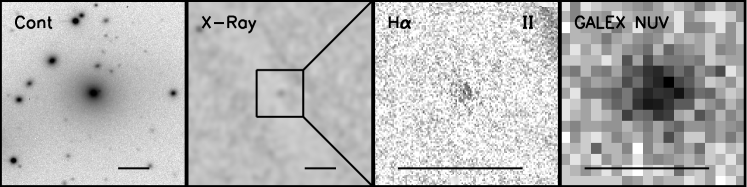
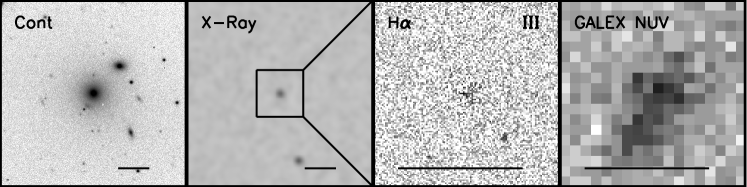
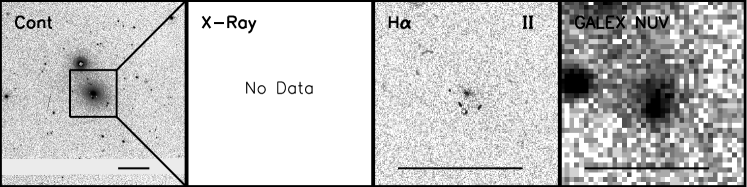
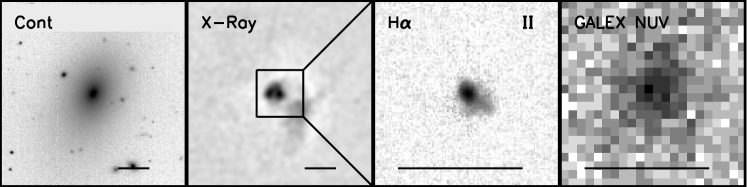
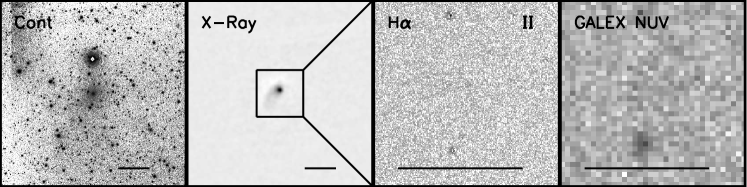
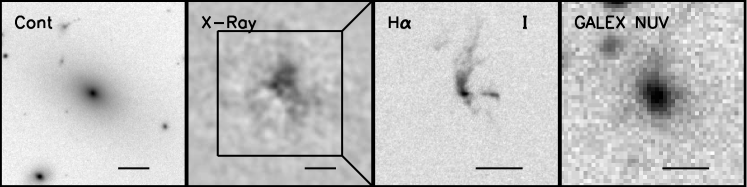
This survey is the largest sample of cooling flow clusters with high-resolution, narrow-band imaging to date. The success of this survey has been striking, with multiple extended filaments seen in 8/23 clusters and slightly extended or nuclear emission seen in an additional 7/23 clusters. The remaining 8 clusters have no detectable H emission. This detection rate of 65% is consistent with the value of 71 found by Edwards et al. (2007) for BCGs in cooling flow clusters (for BCGs in both cooling and non-cooling clusters, Edwards et al. find the fraction to be 15%). Figure 4 shows the unsharp masked X-ray and archival UV data, along with the new MMTF continuum and H images, centered on the BCG. Upon inspection of these images, the following trends are immediately evident:
-
•
There is a strong correlation between the X-ray and H morphology. Clusters with ionized filaments tend to have structure in the X-ray. This structure is brightest at lower energies (0.5-2 keV, see Figure 5), suggesting that the optical filaments live in or near cooler X-ray structures.
-
•
There does not appear to be a correlation between the presence of filaments and the presence of other galaxies near the BCG. In fact, Abell 2151 and Abell 2029 each have one or more significant companions within the optical radius of the BCG but exhibit no detectable H emission. Of the 7 clusters with extended H filaments, only 3 (Abell 0478, Abell 1644, Abell 2052) have significant companions within the optical radius of the BCG. In a select few cases, the direction of the detected filaments may correlate with the position of nearby galaxies (e.g., Abell 0478, Abell 1644).
-
•
The observed warm filaments are never wider than the MMTF PSF (), except in the case of Sersic 159-03. At a typical redshift of 0.06 (d 250 Mpc), this corresponds to an upper limit on the typical filament width of 0.7 kpc.
-
•
In some cases, where the filaments are very extended (Abell 1644, Abell 1795, Sersic 159-03), there is evidence for matching morphology in the near-UV. This is especially true in the case of Abell 1795, which we have confirmed with much higher resolution near-UV images in MV09 and McDonald et al. (in prep; hereafter M+10). However, it is challenging to match the NUV and H morphologies in general due to the mismatch in the PSF widths.
The properties of the observed H filaments are summarized in Table A.1 and a detailed discussion of individual clusters can be found in the appendix. Based on the properties of the H emission, the sample can be divided into 3 categories: those with complex, extended filaments (type I), those with nuclear emission or only slightly extended (i.e. a few PSF widths) emission (type II) and those with no observable emission (type III). We use this convention throughout the remainder of our discussion to easily identify trends at other wavelengths which could explain both the flux and morphology of the H emission.
| Abell 0085 |
 |
| Abell 0133 |
 |
| Abell 0478 |
 |
| Abell 0496 |
 |
| Abell 0644 |
 |
| Abell 0780 (Hydra A) |
 |
| Abell 1644 |
 |
| Abell 1650 |
 |
| Abell 1795 |
 |
| Abell 1837 |
 |
| Abell 2029 |
 |
| Abell 2052 |
 |
| Abell 2142 |
 |
| Abell 2151 |
 |
| Abell 2580 |
 |
| Abell 3158 |
 |
| Abell 3376 |
 |
| Abell 3389 |
 |
| Abell 4059 |
 |
| Ophiuchus |
 |
| Sersic 159-03 |
 |
3.2 Star Formation
A likely explanation for the presence of H emission is photoionization by massive, young stars. However, while several studies to date have found star formation in the central cluster galaxy, very little work has been done on correlating the observed H filaments with young stars for a large sample of clusters. As mentioned earlier, archival near-UV data from GALEX and XMM-OM exist for 21 of our 23 sample clusters. Figure 6 shows that there is a weak correlation (Pearson R = 0.51) between the near-UV and H luminosities. This result is not surprising since the cooling flow in these systems is allegedly depositing some cold gas onto the BCG and triggering some star formation activity. However, there is considerably more scatter than one would expect if the ionization was purely from continuous star formation, suggesting that modifications to the star formation law (i.e. altering the IMF), or alternative physical mechanisms entirely, may be needed to explain the observed NUV/H ratios.
 |
 |
 |
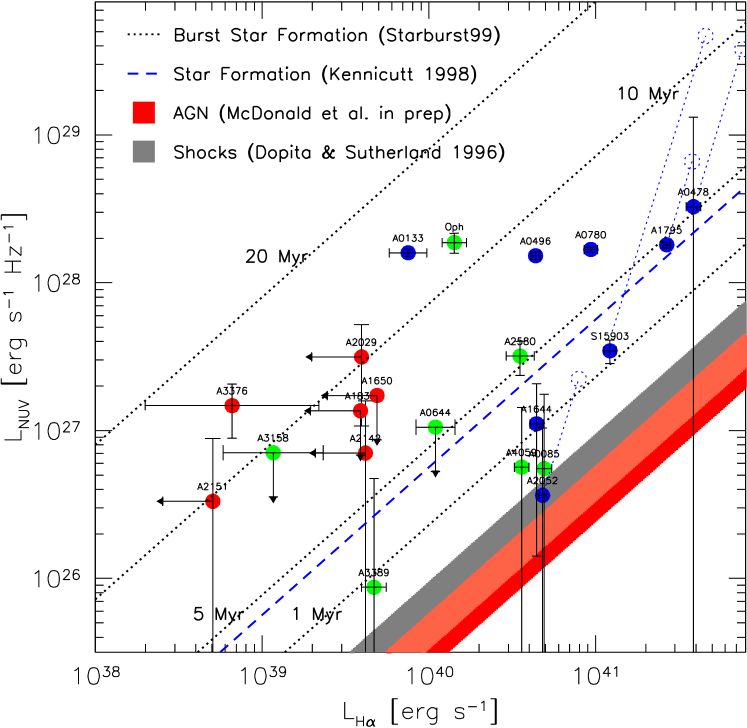
In Figure 6, we also show the NUV/H ratios for several different processes, including continuous star formation (described by Kennicutt 1998). Using models from Starburst99 (Leitherer et al. 1999) we age a burst of star formation from 1–20 Myr in order to see the evolution of the NUV and H flux. These models assume a metallicity of 0.4Z⊙ and a Kroupa IMF (Kroupa 2001) with . The NUV/H ratio is quite sensitive to the IMF assumed, but the overall trends remain the same. As the massive stars die off, the UV/H ratio increases rapidly. This scenario is promising, since several clusters have NUV/H ratios above the value predicted by Kennicutt et al. (1998) and there are very few physical mechanisms that can produce such ratios. In this scenario, star formation took place in a burst as gas crosses Rcool and the NUV/H ratio is a direct indicator of the time elapsed since this burst. If this is indeed the reason for the high UV/H ratios, we would expect higher resolution UV data to show age gradients along the length of any filaments. This trend was not seen in Abell 1795 (McDonald & Veilleux 2009), although there was a slight offset between the UV and H emission which made quantifying a gradient difficult. An alternative explanation for the high NUV/H ratios is the dependence of this quantity as a function of H surface density (Meurer et al. 2009). For star formation in regions with low H surface brightness (i.e. UGCA44) the UV/H ratio is a factor of 5 higher than for a region with higher surface brightness (i.e. NGC 1566). Thus, both scenarios of an aging burst of star formation and star formation in low surface density environments can yield the scatter above the Kennicutt relation that we observe. A third potential source of high UV/H ratios is intrinsic reddening due to dust in the BCG. We show, in Figure 6, the effect of correcting for intrinsic reddening, using extinction measurements from Crawford et al. (1999) and Jaffe et al. (2005). Applying this correction tends to move points further above the Kennicutt relation, suggesting that the high UV/H ratios we measure are not due to dust in the BCG.
Figure 6 presents the global NUV and H luminosities, since the poor spatial resolution of the GALEX/XMM-OM data does not allow us to discriminate between filament and nuclear emission. In MV09, however, we show that the UV/H ratio in the nucleus of Abell 1795 is quite low (LFUV/LHα 710-14 Hz-1). In M+10 (in prep), we show that this is typical for AGN (central point source) in BCGs based on HST far-UV imaging of cooling flow cluster cores. This means that the effect of including the nuclear contribution in the luminosity calculation would move the data below the Kennicutt relation.
Finally, we show the UV/H ratio expected from shock heating (Dopita & Sutherland 1996). Again, this produces low ratios and thus could only be a strong contributer in very few of the clusters. Most notably, Figure 6 shows that the NUV/H ratio for Abell 2052 is consistent with shock heating, and we observe that the H emission traces the outer shell of a cavity carved in the ICM by a radio jet seen at 1.4GHz (see Figure 4). This is strong evidence for the H-emitting gas to be shock heated by an AGN outflow in this object.
3.3 X-Ray Profiles
Figure 7 shows the radial profiles for various parameters derived from the X-ray data: temperature (kT), density (ne), metal abundance, specific entropy (K = kTn keV cm2), cooling time (tcool = 108(K/10 keV cm2)3/2(kT/5 keV)-1 Gyr) and mass deposition rate (dM/dt). There appears to be very little difference in the shape or absolute normalization of the density profile between clusters with and without optical filaments. Likewise, while there is a large spread in the values, there appears to be very little correlation between the radial abundance profile and the presence of optical emission. Interestingly, there appears to be a very strong correlation between the absolute level of the temperature profile and our filament type classification. That is, for clusters with extended, bright optical filaments (type I), the temperature is lower at all radii. For those with nuclear or no emission (types II or III), the temperature is higher at all radii. Since the presence of H filaments has been shown to be enhanced in cooling flow clusters (Edwards et al 2007), one would expect the core temperature to be correlated with the presence of filaments. We find that this correlation extends from the core to much larger radius, such that the temperature at all radii from the very center out to the cooling radius is lower in clusters with extended H filaments.
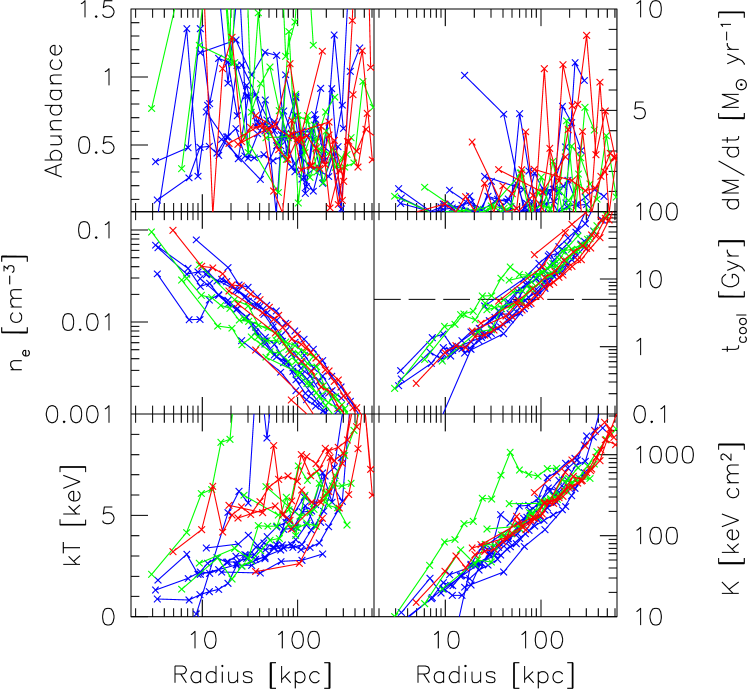
The motivation for producing these radial profiles was to look for a correlation between the entropy profile and the presence of optical filaments, which was alluded to by Donahue et al. (2006). However, while previous authors (e.g. Cavagnolo et al. 2008) have found that the central entropy, K0, is much lower in clusters with H emission, we find that the entropy is lower everywhere interior to the cooling radius for clusters with extended H emission. Naively, one would expect strong AGN feedback and cluster-cluster mergers to raise both the local temperature and entropy, thus impeding the formation of H filaments. However, simulations have found that, under the correct circumstances, AGN feedback can lead to the formation of cold filaments as radio-blown bubbles rise to large radii (e.g. Fabian et al. 2003, Revaz et al. 2008, Pope et al. 2010).
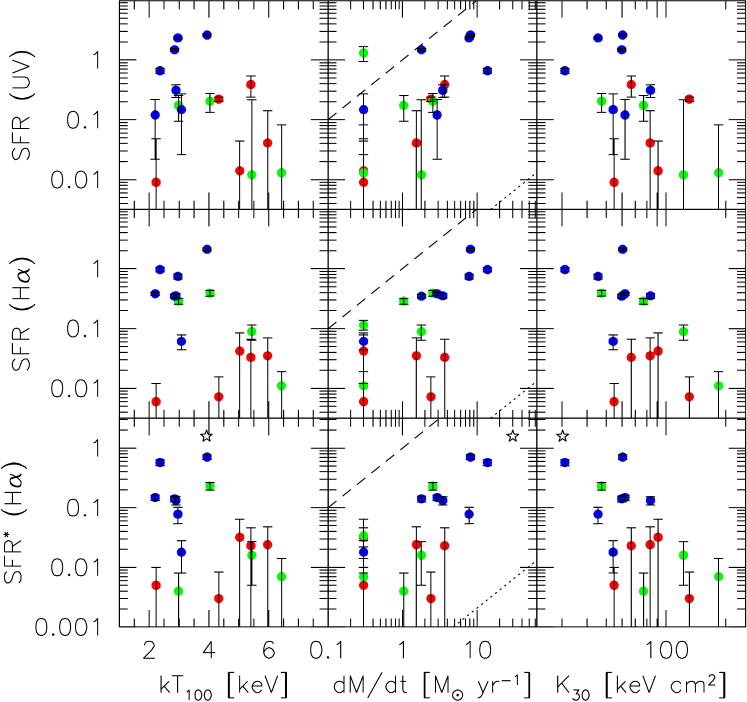
We observe that both the temperature and entropy are lower in the inner 100 kpc for clusters with observable H filaments (Figure 7). In order to quantitatively compare this phenomenon to the presence of ionized filaments, we consider quantities derived with this scale in mind. Figure 8 shows the comparison of the NUV and H luminosities with the average temperature inside of 100 kpc (kT100), the specific entropy at 30 kpc (K30) and the mass deposition rate (dM/dt). The UV and H luminosities are shown in terms of their inferred star formation rates, derived using Kennicutt (1998), so that the comparison to dM/dt is straightforward. However, these values are linearly proportional to the luminosity and so any observed correlation is independent of this choice of scaling.
In Figure 8, we see a strong correlation between the UV or H luminosity and both the entropy and dM/dt over three orders of magnitude. Previous works (e.g. Cavagnolo et al. 2008) have pointed out that systems with lower core entropy tend to have UV/H emission, however we show that the entropy outside of the core is, potentially, an even better tracer of H emission. We prefer this diagnostic since several of our clusters have relatively low surface brightness X-ray emission, making it difficult to constrain the entropy in the core where the signal-to-noise is low. The lower entropy systems tend to have brighter H filaments, with Abell 1795, Sersic 159-03 and Perseus A occupying the lowest-entropy and highest H luminosity regime. The correlation between dM/dt and the H luminosity suggests a link between the cooling flow and either the presence or ionization of the warm gas. The observed H luminosity is 1-2 orders of magnitude too high for it to be due to recombination from the hot X-ray gas, assuming a single H photon per recombination. On the other hand, even if all of the H is due to star formation, there is not enough ongoing star formation to account for all of the gas in the cooling flow. However, one should be cautious when using the X-ray derived dM/dt since they do not represent the true mass of gas cooling out of the X-ray, since it is still unclear how cooling proceeds below soft X-ray energies (Peterson & Fabian 2006). Note, nevertheless, that there appears to be a temperature threshold of 5 keV for ionized filaments, below which nearly all clusters in our sample have extended H emisison. It is unclear at present whether there is a lower temperature threshold below 2 keV, which is the domain of galaxy groups.
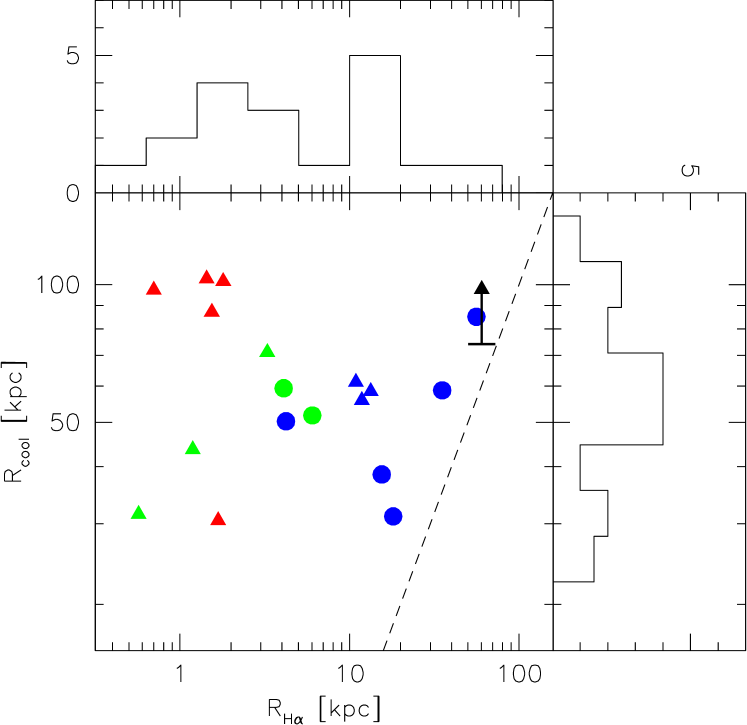
From the radial X-ray profiles and the 2-dimensional H data, we are also able to derive two interesting scale radii. These are: Rcool, the radius at which the cooling time of the X-ray gas is equal to 5 Gyr, and RHα, the maximum extent of the H filaments. The relationship between these radii is shown in Figure 9. While there is a large observed range in the radius of the H emission, there appears to be a hard edge at Rcool – we never observe H emission beyond the radius where the X-ray cooling time is 5 Gyr. This is a strong indication that the H emission is intimately linked to the X-ray cooling flow. The fact that the data appear to prefer a certain timescale (5 Gyr) for the cooling radius is a new and puzzling discovery. Interestingly, recent studies have shown that beyond z 0.5 the frequency of clusters with cool cores is significantly lower than in the local Universe (see e.g. Vikhlinin et al. 2007, Santos et al. 2008). This redshift corresponds to a lookback time of 5 Gyr, which provides further motivation for our choice of cooling radius. Thus, if cooling flows were unable to begin until 5 Gyr ago as the evidence suggests, we would expect the radius at which tcool = 5 Gyr to be a natural boundary for the H filaments.
Additionally, if we adopt the idea of stars forming in bursts, as indicated by the location of the points in Figure 6, our data show that the emission from the youngest stars tends to be much more extended, while the emission from stars formed in a burst 10 Myr ago tend to be concentrated in a nuclear region, lending some support to a radially-infalling scenario.
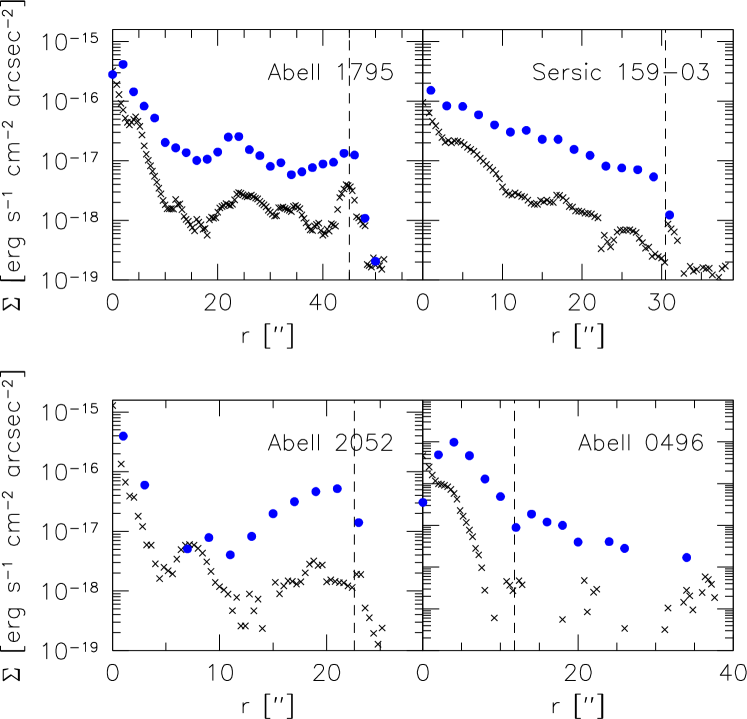
Since we are claiming a link between the cooling radius and the maximum radius of H emission, it is important to assess whether we are truly seeing all of the H emission, or if a deeper exposure would yield RHα/Rcool 1. In Figure 10, the H surface brightness profiles of the three clusters with RHα/Rcool 1 are shown. At RHα, there is a clear drop-off in the surface brightness in all three systems, suggesting that this is a real limit, not a function of our exposure depth. For clusters with RHα 0.5Rcool (e.g. Abell 0496, Figure 10, the edge of the filament blends into the background much more smoothly, suggesting that these filaments may in fact extend even further.
3.4 Properties of X-Ray Gas On and Off of Filament
Using smoothed H images as masks, we were able to extract CXO spectra on and surrounding the warm ionized filaments, as described in §2.3.2. The off-filament spectra were fit with a single-temperature model, while two cases were considered for the on-filament spectra. In order to quantify the so-called “iron bias” (Böhringer et al. 2009), which results from fitting a multi-temperature spectrum with a single-temperature model, we try fitting both one-temperature and two-temperature models to the on-filament spectra. A two-temperature model is clearly motivated if we assume that the ICM conditions are different on-filament, since it allows us to account for the ICM seen in projection in front of and behind the filaments. The S/N of the on-filament spectra are typically insufficient to constrain the temperatures, abundances and relative normalization in a two-temperature model, so we opt to freeze the temperature and abundance for one of the two models to the off-filament conditions.
As we mentioned in §2.3, measuring the electron density on-filament requires an assumption about the geometry of the extraction region. For circular annuli, this is straightforward since we assume a spherical cluster. Since we can not be certain about the geometry of the filaments, we consider two limiting cases: 1) the filaments are thin tubes and extend no further than the width of our MMTF PSF ( 1 kpc) into the plane of the sky; 2) the filaments are sheets seen edge-on with length equal to the observed size of the cluster. For the first case we model the spectrum with a two-temperature plasma to represent the thin filament embedded in the surrounding ICM, while the second case is modeled as a single-temperature slab of gas. The fact that we only see filaments that are unresolved in width suggests that the filaments are indeed thin and not sheets seen in projection. However we proceed under the assumption that both geometries are reasonable, thus bounding the “true” solution somewhere in between.
Fortunately, the assumption of geometry does not affect the calculation of the abundance or temperature. The on-versus-off filament temperature and abundance ratios are shown in Figure 11, for both single-temperature and two-temperature models. Immediately obvious from this figure is the fact that the filaments tend to be cooler than the immediate surroundings – the typical temperature in the filament is 50% of that in the nearby gas. The fact that the X-ray gas near the H filaments is significantly cooler than the surrounding ICM is further evidence that the H filaments may be taking part in the cooling flow. Additionally, the on-filament metallicity tends to be significantly lower, reaching values less than 40% of the off-filament values for about half of our systems. This does not appear to be the case for the 2-temperature model applied to the “outer filament” spectrum, suggesting that the low on-filament metallicity may be a result of the iron bias (Böhringer et al. 2009). However, this is also the lowest S/N of the four scenarios considered. Thus, deeper data are required in order to say for certain what the true abundance gradient between the on- and off-filament spectra is. There are very few physical processes that decrease metallicity so, if the on-filament abundance is in fact lower with respect to the surrounding ICM, it is more likely that the low-metallicity gas has been transported from elsewhere.


A hint as to the origin of this low-metallicity gas can be found if we look at the 5 clusters with the largest on-off filament metal abundance contrast. With the exception of Abell 2052, all of these clusters have very strong radial abundance gradients. On the other hand, those clusters which do not have a strong on-off filament metal abundance contrast have relatively flat radial abundance gradients. To further drive this home, we show in Figure 12 the relationship between the on- and off-filament abundance and the abundance in four regimes: (1) r 0, (2) r rcool, (3) r rcool and, (4) r rcool. This figure shows that, in general, the metallicity in the filaments matches best with the metallicity at rcool. For those four clusters with strong on-off filament abundance gradients (excluding Abell 2052), the on-filament abundance matches almost exactly the local abundance at rcool. For the remaining four clusters, the on-filament abundance looks roughly the same as the abundance at all radii, due to the relatively flat abundance gradient. If we consider a two-temperature model for the on-filament spectrum, the correlation between the on-filament metallicity and the metallicity at the cooling radius becomes considerably less significant. Again, more data is needed in order to achieve a high enough on-filament S/N in order to constrain the abundance in a two-temperature model. A direct link between the on-filament metallicity and the metallicity outside of the cooling radius would further strengthen the connection between the H filaments and the cooling flow. Furthermore, it would offer some evidence against the common hypothesis that the gas in the H filaments comes from the central region, either from radio-blown bubbles (i.e. Revaz et al. 2008) or from gas sloshing (i.e. Johnson et al. 2010). While in some cases the match between the core and and on-filament abundances is good, it is overall worse than the match to the abundance at Rcool. However, there are two biases which are likely conspiring to increase the uncertainty in the core abundance measurement. First, we expect the core abundance to be most affected by the iron bias, implying that the core abundances which we quote are likely lower limits. At the same time, our coarse binning in the central region (chose to ensure a high S/N deprojection) means that any strong dip in the central abundance will be smeared out, leading to a slightly higher measured abundance. As an example, for Abell 4059 we find a dip in the abundance profile in the center, with a central value of 1.0, while Reynolds et al. (2008) quote a value of 0.3 due to their higher resolution. Using a 2-component model, Reynolds et al. find that the core abundance dip changes to an excess, with a central value of 2.5. Thus, it is clear that the value of the central abundance is highly dependent on the model and binning chosen, and is therefore uncertain.
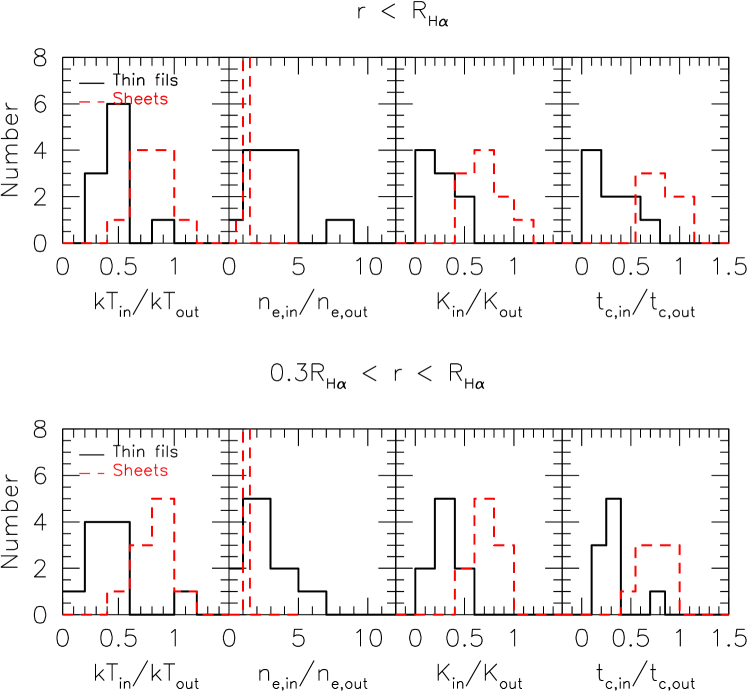
In addition to the X-ray temperature and metallicity in the filaments, we can also measure various additional properties such as electron density, entropy and cooling time, as shown in Figure 13. The distribution of these properties offers further evidence for a link between the X-ray cooling flow and the H emission. Assuming the thin-filament geometry, the density inside of the filament is typically a factor of a few higher than the surrounding ICM. Coupled with the temperature decrease mentioned above, this yields drastically lowered entropy and cooling times inside of the filament. With cooling times ranging from 10%-40% of the surrounding ICM, these regions are, by definition, part of the cooling flow. It should also be noted that, even if we assume that the geometry is that of single-temperature sheets seen in projection, the cooling time and the entropy are lower overall inside of the filaments.
The overall results from extracting X-ray spectra coincident and anti-coincident with the observed H filaments tell an interesting story. The H filaments appear to reside in a portion of the ICM with higher densities that is cooling more rapidly than its surroundings, resulting in lower temperatures. The metallicity inside of the filaments resembles more closely the metallicity at the cooling radius than the adjacent off-filament gas, albeit with a considerable amount of uncertainty. These two results, coupled with the fact that the observed H emission seems to know about the cooling radius (RHα Rcool), suggests that the observed H filaments are coupled to the cooling flow.
3.5 Properties of BCGs
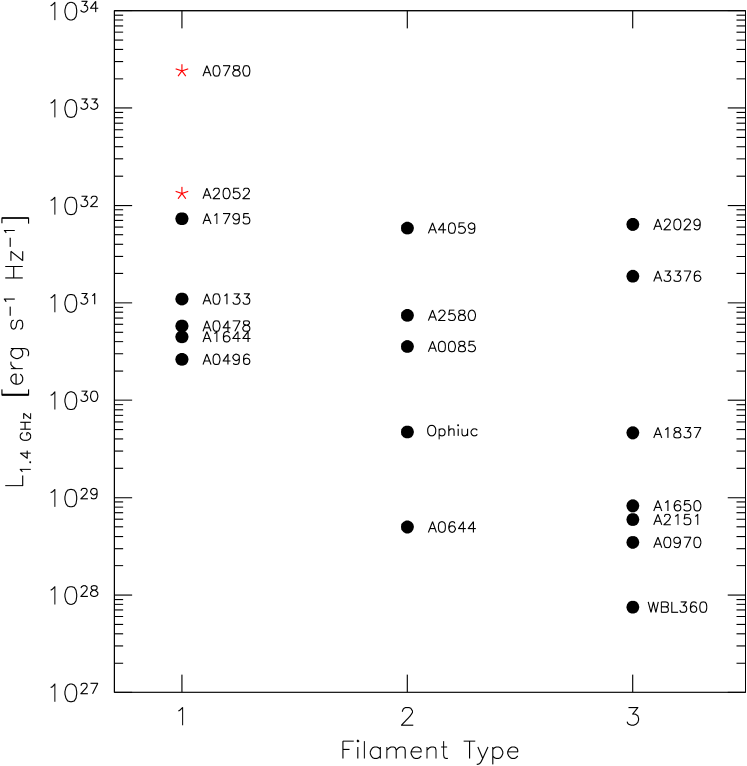
As a method of probing whether or not these clusters harbor an AGN in their central galaxies, we consider the 1.4 GHz radio power as well as the presence of an X-ray point source in the cluster core. The distribution of radio luminosities for our sample is shown in Figure 14. We note that all clusters with filaments have a significant radio detection, while only 5/15 of the clusters without filaments have a significant radio detection. Thus, the presence of radio emission is not predictive of whether there will be extended H filaments. The two clusters with detected X-ray point sources in the BCG, Abell 0780 (Hydra A) and Abell 2052 have large cavities in their X-ray halos, suggesting that the AGN is strongly influencing the surrounding medium. The H in these two clusters is very likely linked to this activity. If we consider the remaining clusters, the correlation between radio power and the presence of H filaments becomes much weaker, suggesting that the two phenomena are not directly tied to one another. Instead, whatever weak correlation that is seen could be due to the fact that cool core clusters, which tend to have H filaments (Figure 8), will also have a more ready supply of fuel for the central AGN, leading to increased radio feedback. Further discussion of the implication of these, and other, results follow in the next section.
We can also consider the relationship between the BCG itself and the presence of optical filaments. Figure 15 shows the total K′-band flux for the BCG versus the total H flux contained in filaments. The K′-band flux is a good approximation to the total stellar mass, with only a very small deviation with galaxy color (Bell & de Jong 2001). There is no obvious correlation between the the galaxy brightness (or stellar mass, approximately) and the presence of H filaments, suggesting that the observed filaments are related instead to the X-ray properties of the cluster core.
4 Discussion: Origin of the H Filaments
In the previous sections we have provided several new clues to the origin of the observed H filaments:
- •
-
•
There is a strong correlation between the H flux in filaments and both the X-ray determined cooling flow rate, dM/dt, and cluster entropy over 3 orders of magnitude (Figure 8).
-
•
The extent of the H filaments never exceeds the cooling radius. This appears to be a hard limit to the radius of these filaments (Figure 9).
-
•
The metallicity of the X-ray gas coincident with the H filaments is often lower than the non-coincident ICM at the same radii. The on-filament X-ray metallicity is consistent with that measured near the cooling radius or beyond (Figure 12).
-
•
The temperature and cooling time of the X-ray gas coincident with the H filaments is significantly lower than that of the surrounding ICM (Figure 13).
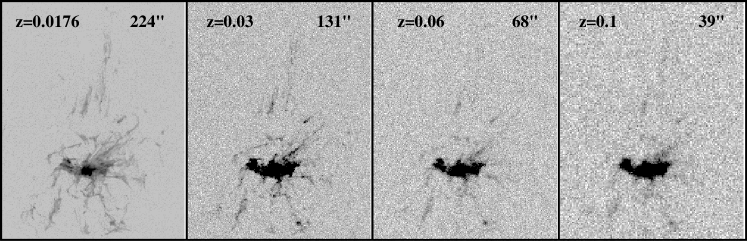
These results suggest a direct link between the hot ICM and the warm ionized filaments. However, before we discuss their implications, we would be remiss if we did not mention the spectacular H filaments detected in the nearby cooling flow cluster, Perseus. A great deal of literature has been devoted to the study of these filaments, which are seen in molecular gas (Salomé et al. 2008), warm ionized hydrogen (Conselice et al. 2001) and X-ray (Fabian et al. 2006). However, while the observed filaments are indeed impressive, we would argue that they are “typical” among what we classify as our type I clusters. In Figure 16 we show the effect of placing Perseus A at larger redshift, and simulating a 20-minute exposure using the MMTF under typical observing conditions. By a redshift of 0.06, which is roughly the mean redshift of our sample, the majority of the fine structure has been washed out, leaving only a small number of detectable filaments. These redshifted images look similar in morphology to our detections of filaments in the 7 clusters which we label as type I. Additionally, we show in Figure 8 that Perseus A occupies a similar space to the other clusters with filamentary H in temperature, cooling rate and temperature. The total luminosity in H is significantly higher than in all other clusters, however this is probably again partially due to its proximity: if a filament completely disappears into the background we will choose a smaller aperture and, thus, measure a smaller total luminosity.
We finish by discussing the results summarized above in the context of several current theories which attempt to explain the presence of the observed H filaments: buoyant radio bubbles, gas sloshing in the central potential, accretion of gas-rich galaxies, filamentary cooling flows, ICM conduction and magnetic fields.
4.1 Origin of the Cool Gas
4.1.1 Buoyant Radio Bubbles
In an effort to explain how an AGN can deposit energy into the ICM and quench cooling, much work has been focused on the evolution of bubbles blown in the ICM by radio jets (e.g. Reynolds et al. 2005, Vernaleoet al. 2007, Revaz et al. 2008). Due to the local density contrast, these bubbles are buoyant and will rise to larger radius, transporting energy from small radii to large. While rising, the shape of the bubble evolves and can leave behind a trail of cooler gas that morphologically matches the observed H filaments in Perseus A (Reynolds et al. 2005, Revaz et al. 2008). Radio bubbles have been observed in several clusters to date, including some in our sample (e.g. Abell 0780, Abell 2052), which lends further support to this scenario.
This scenario is consistent with the low temperatures seen in the X-ray ICM coincident with the H filaments and with the fact that all of the clusters with extended filaments have non-zero 1.4 GHz flux. Some clusters (e.g. Abell 0780, Abell 2052) show H emission along the edges of known radio-blown bubbles lending further support to this scenario. It is unclear exactly how the strong correlation between the H radius and the cooling radius fits in this scenario, although it could be that this relation is tied to the ionization and not to the source of the gas. The low ICM abundance coincident with the H filaments appears to match well with the abundance beyond the cooling radius, but it may also match the core abundance, which previous works (e.g., Sanders et al. 2002, 2007) have found to be metal-poor in several nearby clusters.
4.1.2 Gas Sloshing
The gravitational disruption of a cluster core by mergers or interactions with other clusters or galaxies can lead to the ICM “sloshing” about the central potential, creating cold fronts that have been observed in several clusters to date (e.g. Zuhone et al. 2009, Johnson et al. 2010). While this is certainly an important mechanism for heat transport and is very likely ongoing in several clusters with observed cooling fronts, it does not seem to be a plausible general explanation for the presence of warm filaments. The morphology of the H filaments in our sample tends to be radial, with very few exceptions. The gas sloshing scenario predicts cool, low-entropy gas along fronts which are aligned perpendicular to the radial direction. The process of sloshing in the cluster core should also smooth out any abundance gradients, however we detect possible abundance contrasts between the X-ray gas on-filament and off-filament. Finally, the magnitude of the gas sloshing should be dependent on the strength of the merger or disruption event. However, we see a clear limit to the length of the filaments (RHα Rcool), which is inconsistent with the sloshing picture.
4.1.3 Accretion of Younger Galaxies/Groups
While the direction of some of the observed filaments seemingly coincides with the location of smaller galaxies (e.g. Abell 0478, Abell 0496, Abell 0780), it is unlikely that the warm gas has been stripped from these galaxies. If this were the case, one would expect the filaments to extend all the way to the satellite galaxy, in some cases, which is not seen. Likewise, we would not expect a single galaxy, or small group of galaxies, to have a strong effect on the distribution of the hot X-ray gas. However, much of the structure seen in H is seen also in the Chandra X-ray images. Additionally, the strong correlation between the mass deposition rate and cluster entropy would be unexplained by such a formation method.
A back-of-the-envelope calculation seems to rule out this mechanism as the source of the observed H filaments. The typical H luminosity that we observe in filaments is 51040 erg s-1, which corresponds to 3.71052 recombinations per second (assuming case B recombination). If we assume that the diffuse ionized medium in the stripped galaxy is pure hydrogen and is being stripped from a galaxy like our Milky Way, and then recombining only once as it cools in the absence of ionizing radiation, this corresponds to 950 M⊙ yr-1 of recombining gas. Assuming a total diffuse HII mass of 109 M⊙ for a typical massive spiral (Lequeux 2005), this implies that all of the stripped gas would recombine in 1 Myr. Thus, in order to consistently produce warm ionized filaments via gas stripping, the BCG would have to strip the gas disk from a spiral galaxy every few Myr, which is unreasonably short, given the typical cluster crossing times of 1 Gyr. Alternatively, if we invoke an additional ionization source once the gas has been stripped from the galaxy (e.g. X-ray conduction from the ICM), a smaller amount of stripped gas could lead to the observed fluxes of H. We will revisit this issue in much greater detail in subsequent papers.
4.1.4 Filamentary Cooling Flows
In this scenario, the observed H filaments directly trace the cooling flow (i.e. Cowie et al. 1980; Fabian et al. 1984; Heckman et al. 1989). The X-ray ICM begins to cool dramatically at the cooling radius, while falling inwards at roughly the free-fall speed. As the gas cools, small density contrasts in the ICM grow and thin, high-density filaments form. Once sufficiently cool, the gas in these filaments can be re-ionized via star formation, collisional heating (e.g. Ferland et al. 2009) or drag heating (e.g. Pope et al. 2008). This scenario is consistent with H filaments extending to Rcool, with the observed correlation between X-ray and H properties and with the low metallicity and high cooling rates found in the X-ray gas coincident with H filaments. Additionally, the fact that we only see H filaments out to a radius where gas can cool in 5 Gyr agrees well with observations that the frequency of cool cores beyond a lookback time of 5 Gyr is significantly lower than the local Universe. Thus, the cooling flow scenario is our preferred formation scenario for the optical filaments.
The thinness of the observed H filaments relative to their extent (Table A.1) is reminiscent of the thin, filamentary structure seen in hydrodynamic simulations of cool gas flows (e.g. Hattori et al. 1995, Pope et al. 2008, Ceverino et al. 2010). Figure 3 from Ceverino et al. (2010) shows long ( 50 kpc), thin ( 10 kpc) filaments of cold gas which resemble our observations of H filaments. While the physical scales are slightly different, they describe the process which cool ( 5104 K) filaments embedded in a spherical halo of hot ( 3105 K) gas may form. The formation of these cool filaments is used by the authors to explain how star formation proceeds in spiral galaxies at high redshift, but the physical processes should be similar for gas cooling from the hot phase to the cool phase, regardless of whether we are considering gas streaming onto an isolated spiral galaxy or a central cluster galaxy.
In MV09 we argued that the most plausible scenario for the creation of the long, thin filament in Abell 1795 was a cooling wake caused by a cooling flow occurring around the moving cD galaxy. This claim was made based on the observation by Oegerle & Hill (2001) that Abell 1795 has a significant peculiar velocity relative to the cluster. However, we find that the second most asymmetric case, Abell 0496, which also has filaments extending only in one direction, has a negligible peculiar velocity. Likewise, several BCGs with no H emission (e.g., Abell 2029, Abell 2151) or nuclear-only H emission (e.g. Abell 2580) have a peculiar velocity as high, or higher, than Abell 1795. Thus, while this may play a role in determining the direction of the filaments, it is not likely the most important factor in their formation.
This scenario makes the prediction that the filament material should be in near free-fall. The jury is still out on this issue, as several works (i.e. Hatch et al. 2007, Oonk et al. 2010) argue against radial infall in H filaments, while others (i.e. Lim et al. 2008, Wilman et al. 2009) argue for it. Thus, a homogenous sample of kinematic measurements is needed to complement this census of the warm and hot medium and provide a strong argument either for or against the radially-infalling cooling flow.
4.2 Evidence for Conduction
Conduction from the X-ray ICM is a promising scenario which could provide the energy necessary to ionize the cooling gas. Nipoti & Binney (2004) predict that, if conduction is responsible for ionizing the H filaments, there should be an excess of soft X-rays surrounding the filaments. This is consistent with our findings that the soft X-ray morphology matches well with the H morphology and that the temperature of the X-ray gas coincident with the warm filaments is significantly cooler than the surrounding ICM. In an attempt to address the plausibility of this scenario for ionizing the observed H filaments in our sample, we turn to a study of thermal conduction in 16 cooling-flow clusters by Voigt & Fabian (2004). Of these 16 clusters, there are 5 which overlap with our sample: Abell 0478, Abell 0780, Abell 1795, Abell 2029 and Sersic 159-03. Of the five clusters in this overlapping sample, four show very extended, filamentary H emission. The conductivity inside of the cooling radius for these four clusters ranges from = 0.3–2.3, while for the lone overlapping cluster with no H emission, the effective conductivity is = 0.2 (Voigt & Fabian, 2004). Estimates of the minimal value required for conduction to to transport heat from the hot ICM to cooler regions varies from 0.01 (Churazov et al. 2001) to 0.3 (Narayan & Medvedev 2001).
The fact that we observe cooler X-ray gas coincident with the H filaments, coupled with the relatively large conductivity measurements in clusters with filaments (albeit with a small sample size) suggests that conductivity may be responsible for much of the energy required to ionize these filaments. However, future work is needed to expand on the number of clusters with effective conduction measurements and to determine if the energetics of the warm filaments match what we would expect from ICM conduction.
4.3 Role of Magnetic Fields
Given the typically large axial ratio of the H filaments (length/thickness 30, according to Table A.1), magnetic fields likely play a role in the formation of these filaments, in one or more of several ways: (i) by channeling the inflow of clumps of gas along field lines, giving them coherent structure (Fabian et al. 2003), (ii) preventing the hot, turbulent ICM from shredding the filaments (Hatch et al. 2007), (iii) to help the growth of thermal instabilities, leading to thin high-density filaments (Hattori et al. 1995), and (iv) suppressing conduction of heat from the ICM to the cooling gas (Voigt & Fabian 2004).
High-resolution X-ray spectra of these clusters could constrain the level of turbulence in the ICM (e.g., Sanders et al. 2010). These measurements, combined with the observed thinness of the H filaments and MHD models could constrain the strength of the intracluster magnetic field required to sustain such filaments, in a similar manner to Loewenstein & Fabian (1990). This would be a nice consistency check on the magnetic field strengths derived from rotation measures.
5 Summary and Future Prospects
This study represents the highest resolution survey of warm ionized filaments in cooling flow clusters beyond 100 Mpc to date. Complex, filamentary morphologies are seen in 8/23 (35%) of our clusters, with slightly extended or nuclear emission seen in additional 7/23 (30%). We find a weak correlation between the total H luminosity and the near-UV luminosity from young stars, which suggests that photoionization from young stars may play a role in producing the observed H. UV imaging of higher spatial resolution is needed to spatially correlate the H and UV emission, and to remove the contribution to the UV luminosity from the AGN and/or central starburst. While the H and X-ray data support the buoyant radio bubble hypothesis as a source of cool gas in some cases, we believe that the cooling flow model does a better job of explaining the properties of the ensemble of clusters. We observe correlations between the soft X-ray morphology and the H morphology, the X-ray cooling rate and the H luminosity contained in filaments. We find evidence for a correlation between the X-ray metal abundance of gas coincident with the H filaments and at the cooling radius, however more data are required in order to obtain reliable on-filament abundance measurements. The maximum radial extent of the H emission and the cooling radius appear to be linked, such that RHα Rcool, where Rcool is the radius at which the X-ray gas can cool in less than 5 Gyr. This radius appears to be physically motivated, as the choice of timescale agrees well with the lookback time at which cooling flow clusters begin to emerge. Additionally, we find that the X-ray gas coincident with observed H filaments is cooling on a much shorter ( 20%) timescale than the surrounding ICM. These results suggest that the H filaments trace the X-ray cooling flow, and that this flow is initiated at the cooling radius. There does not appear to be a strong correlation between the presence of filaments and the structural properties of the BCG, suggesting that the H filaments are not related to any feedback processes from the central galaxy. Based on our results, we propose that the gas is cooling out of the X-ray ICM in clumps at roughly the cooling radius and collapsing into thin streams as it falls onto the BCG. The observed asymmetry is likely due to the cooling flow being channeled along magnetic field lines. Based on the X-ray and H correlations, as well as the high effective conductivity in clusters with H filaments, it is likely that this cool gas is conducting heat from the surrounding ICM in order to remain ionized. Several questions remain unanswered in this scenario, such as the cooling process for the hot gas below 0.5 keV, and the exact ionization mechanism for the warm gas. Upcoming papers in this series will carefully address these and other issues.
Acknowledgements
Support for this work was provided to M.M., S.V., and D.S.N.R. by NSF through contract AST 0606932. S.V. also acknowledges support from a Senior Award from the Alexander von Humboldt Foundation and thanks the host institution, MPE Garching, where part of this work was conducted. We thank C.S. Reynolds and S. Teng for useful discussions and the referee for their careful read of the paper and insightful suggestions. We thank the technical staff at Las Campanas for their support during the ground-based observations, particularly David Osip who helped in the commissioning of MMTF.
References
- Anders & Grevesse (1989) Anders, E., & Grevesse, N. 1989, Geochim. Cosmochim. Acta, 53, 197
- Arnaud (1996) Arnaud, K. A. 1996, Astronomical Data Analysis Software and Systems V, 101, 17
- Bell & de Jong (2001) Bell, E. F., & de Jong, R. S. 2001, ApJ, 550, 212
- Bland-Hawthorn & Jones (1998) Bland-Hawthorn, J., & Jones, D. H. 1998, Publications of the Astronomical Society of Australia, 15, 44
- Blanton et al. (2003) Blanton, E. L., Sarazin, C. L., & McNamara, B. R. 2003, ApJ, 585, 227
- Boehringer & Werner (2009) Boehringer, H., & Werner, N. 2009, arXiv:0907.4277
- Cardelli et al. (1989) Cardelli, J. A., Clayton, G. C., & Mathis, J. S. 1989, ApJ, 345, 245
- Choi et al. (2004) Choi, Y.-Y., Reynolds, C. S., Heinz, S., Rosenberg, J. L., Perlman, E. S., & Yang, J. 2004, ApJ, 606, 185
- Churazov et al. (2001) Churazov, E., Brüggen, M., Kaiser, C. R., Böhringer, H., & Forman, W. 2001, ApJ, 554, 261
- Condon et al. (1998) Condon, J. J., Cotton, W. D., Greisen, E. W., Yin, Q. F., Perley, R. A., Taylor, G. B., & Broderick, J. J. 1998, AJ, 115, 1693
- Cavagnolo et al. (2008) Cavagnolo, K. W., Donahue, M., Voit, G. M., & Sun, M. 2008, ApJ, 683, L107
- Ceverino et al. (2010) Ceverino, D., Dekel, A., & Bournaud, F. 2010, MNRAS, 440
- Conselice et al. (2001) Conselice, C. J., Gallagher, J. S., III, & Wyse, R. F. G. 2001, AJ, 122, 2281
- Cowie et al. (1980) Cowie, L. L., Fabian, A. C., & Nulsen, P. E. J. 1980, MNRAS, 191, 399
- Cowie et al. (1983) Cowie, L. L., Hu, E. M., Jenkins, E. B., & York, D. G. 1983, ApJ, 272, 29
- Crawford et al. (1999) Crawford, C. S., Allen, S. W., Ebeling, H., Edge, A. C., & Fabian, A. C. 1999, MNRAS, 306, 857
- Crawford et al. (2005) Crawford, C. S., Sanders, J. S., & Fabian, A. C. 2005, MNRAS, 361, 17
- Donahue et al. (2006) Donahue, M., Horner, D. J., Cavagnolo, K. W., & Voit, G. M. 2006, ApJ, 643, 730
- Dopita & Sutherland (1996) Dopita, M. A., & Sutherland, R. S. 1996, ApJS, 102, 161
- Dupke et al. (2007) Dupke, R., White, R. E., III, & Bregman, J. N. 2007, ApJ, 671, 181
- Durret et al. (2005) Durret, F., Lima Neto, G. B., & Forman, W. 2005, A&A, 432, 809
- Edge (2001) Edge, A. C. 2001, MNRAS, 328, 762
- Edwards et al. (2007) Edwards, L. O. V., Hudson, M. J., Balogh, M. L., & Smith, R. J. 2007, MNRAS, 379, 100
- Fabian et al. (1984) Fabian, A. C., Nulsen, P. E. J., & Canizares, C. R. 1984, Nature, 310, 733
- Fabian (1994) Fabian, A. C. 1994, ARA&A, 32, 277
- Fabian et al. (2000) Fabian, A. C., et al. 2000, MNRAS, 318, L65
- Fabian et al. (2003) Fabian, A. C., Sanders, J. S., Crawford, C. S., Conselice, C. J., Gallagher, J. S., & Wyse, R. F. G. 2003, MNRAS, 344, L48
- Fabian et al. (2006) Fabian, A. C., Sanders, J. S., Taylor, G. B., Allen, S. W., Crawford, C. S., Johnstone, R. M., & Iwasawa, K. 2006, MNRAS, 366, 417
- Ferland et al. (2009) Ferland, G. J., Fabian, A. C., Hatch, N. A., Johnstone, R. M., Porter, R. L., van Hoof, P. A. M., & Williams, R. J. R. 2009, MNRAS, 392, 1475
- Fujita et al. (2004) Fujita, Y., Sarazin, C. L., Reiprich, T. H., Andernach, H., Ehle, M., Murgia, M., Rudnick, L., & Slee, O. B. 2004, ApJ, 616, 157
- Hamuy et al. (1992) Hamuy, M., Walker, A. R., Suntzeff, N. B., Gigoux, P., Heathcote, S. R., & Phillips, M. M. 1992, PASP, 104, 533
- Hamuy et al. (1994) Hamuy, M., Suntzeff, N. B., Heathcote, S. R., Walker, A. R., Gigoux, P., & Phillips, M. M. 1994, PASP, 106, 566
- Hatch et al. (2007) Hatch, N. A., Crawford, C. S., & Fabian, A. C. 2007, MNRAS, 380, 33
- Hattori et al. (1995) Hattori, M., Yoshida, T., & Habe, A. 1995, MNRAS, 275, 1195
- Heckman et al. (1989) Heckman, T. M., Baum, S. A., van Breugel, W. J. M., & McCarthy, P. 1989, ApJ, 338, 48
- Hicks & Mushotzky (2005) Hicks, A. K., & Mushotzky, R. 2005, ApJ, 635, L9
- (37) Hicks et al. 2010, submitted
- Hu et al. (1985) Hu, E. M., Cowie, L. L., & Wang, Z. 1985, ApJS, 59, 447
- Jaffe et al. (2005) Jaffe, W., Bremer, M. N., & Baker, K. 2005, MNRAS, 360, 748
- Johnson et al. (2010) Johnson, R. E., Markevitch, M., Wegner, G. A., Jones, C., & Forman, W. R. 2010, ApJ, 710, 1776
- Jones et al. (2002) Jones, D. H., Shopbell, P. L., & Bland-Hawthorn, J. 2002, MNRAS, 329, 759
- Kennicutt (1998) Kennicutt, R. C., Jr. 1998, ARA&A, 36, 189
- Lauer et al. (2005) Lauer, T. R., et al. 2005, AJ, 129, 2138
- Leitherer et al. (1999) Leitherer, C., et al. 1999, ApJS, 123, 3
- Lequeux (2005) Lequeux, J. 2005, The interstellar medium, Translation from the French language edition of: Le Milieu Interstellaire by James Lequeux, EDP Sciences, 2003 Edited by J. Lequeux. Astronomy and astrophysics library, Berlin: Springer, 2005,
- Lim et al. (2008) Lim, J., Ao, Y., & Dinh-V-Trung 2008, ApJ, 672, 252
- Loewenstein & Fabian (1990) Loewenstein, M., & Fabian, A. C. 1990, MNRAS, 242, 120
- McDonald & Veilleux (2009) McDonald, M., & Veilleux, S. 2009, ApJ, 703, L172
- (49) McDonald, M. et al. 2010, in preparation (M+10)
- Meurer et al. (2009) Meurer, G. R., et al. 2009, ApJ, 695, 765
- Narayan & Medvedev (2001) Narayan, R., & Medvedev, M. V. 2001, ApJ, 562, L129
- Nipoti & Binney (2004) Nipoti, C., & Binney, J. 2004, MNRAS, 349, 1509
- O’Dea et al. (2008) O’Dea, C. P., et al. 2008, ApJ, 681, 1035
- Oegerle & Hill (2001) Oegerle, W. R., & Hill, J. M. 2001, AJ, 122, 2858
- Oke (1990) Oke, J. B. 1990, AJ, 99, 1621
- Oonk et al. (2010) Oonk, J. B. R., Jaffe, W., Bremer, M. N., & van Weeren, R. J. 2010, arXiv:1002.3297
- Owen et al. (1995) Owen, F. N., Ledlow, M. J., & Keel, W. C. 1995, AJ, 109, 14
- Peres et al. (1998) Peres, C. B., Fabian, A. C., Edge, A. C., Allen, S. W., Johnstone, R. M., & White, D. A. 1998, MNRAS, 298, 416
- Peterson & Fabian (2006) Peterson, J. R., & Fabian, A. C. 2006, Phys. Rep., 427, 1
- Pope et al. (2008) Pope, E. C. D., Hartquist, T. W., & Pittard, J. M. 2008, MNRAS, 389, 1259
- Pope et al. (2010) Pope, E. C. D., Babul, A., Pavlovski, G., Bower, R. G., & Dotter, A. 2010, MNRAS, 851
- Rafferty et al. (2006) Rafferty, D. A., McNamara, B. R., Nulsen, P. E. J., & Wise, M. W. 2006, ApJ, 652, 216
- Randall et al. (2002) Randall, S. W., Sarazin, C. L., & Ricker, P. M. 2002, ApJ, 577, 579
- Rasera et al. (2008) Rasera, Y., Lynch, B., Srivastava, K., & Chandran, B. 2008, ApJ, 689, 825
- Reiprich et al. (2004) Reiprich, T. H., Sarazin, C. L., Kempner, J. C., & Tittley, E. 2004, ApJ, 608, 179
- Revaz et al. (2008) Revaz, Y., Combes, F., & Salomé, P. 2008, A&A, 477, L33
- Reynolds et al. (2005) Reynolds, C. S., McKernan, B., Fabian, A. C., Stone, J. M., & Vernaleo, J. C. 2005, MNRAS, 357, 242
- Reynolds et al. (2008) Reynolds, C. S., Casper, E. A., & Heinz, S. 2008, ApJ, 679, 1181
- Russell et al. (2008) Russell, H. R., Sanders, J. S., & Fabian, A. C. 2008, MNRAS, 390, 1207
- Salomé et al. (2008) Salomé, P., Combes, F., Revaz, Y., Edge, A. C., Hatch, N. A., Fabian, A. C., & Johnstone, R. M. 2008, A&A, 484, 317
- Salpeter (1955) Salpeter, E. E. 1955, ApJ, 121, 161
- Sanders & Fabian (2002) Sanders, J. S., & Fabian, A. C. 2002, MNRAS, 331, 273
- Sanders et al. (2004) Sanders, J. S., Fabian, A. C., Allen, S. W., & Schmidt, R. W. 2004, MNRAS, 349, 952
- Sanders & Fabian (2007) Sanders, J. S., & Fabian, A. C. 2007, MNRAS, 381, 1381
- Sanders et al. (2010) Sanders, J. S., Fabian, A. C., Smith, R. K., & Peterson, J. R. 2010, MNRAS, 402, L11
- Sanderson et al. (2005) Sanderson, A. J. R., Finoguenov, A., & Mohr, J. J. 2005, ApJ, 630, 191
- Schlegel et al. (1998) Schlegel, D. J., Finkbeiner, D. P., & Davis, M. 1998, ApJ, 500, 525
- Veilleux et al. (2005) Veilleux, S., Cecil, G., & Bland-Hawthorn, J. 2005, ARA&A, 43, 769
- Veilleux et al. (2010) Veilleux, S., et al. 2010, AJ, 139, 145
- Vernaleo & Reynolds (2007) Vernaleo, J. C., & Reynolds, C. S. 2007, ApJ, 671, 171
- Vikhlinin et al. (2007) Vikhlinin, A., Burenin, R., Forman, W. R., Jones, C., Hornstrup, A., Murray, S. S., & Quintana, H. 2007, Heating versus Cooling in Galaxies and Clusters of Galaxies, 48
- Voigt & Fabian (2004) Voigt, L. M., & Fabian, A. C. 2004, MNRAS, 347, 1130
- White et al. (1997) White, D. A., Jones, C., & Forman, W. 1997, MNRAS, 292, 419
- Wilman et al. (2009) Wilman, R. J., Edge, A. C., & Swinbank, A. M. 2009, MNRAS, 395, 1355
- Wise et al. (2007) Wise, M. W., McNamara, B. R., Nulsen, P. E. J., Houck, J. C., & David, L. P. 2007, ApJ, 659, 1153
- ZuHone et al. (2009) ZuHone, J. A., Markevitch, M., & Johnson, R. E. 2009, arXiv:0912.0237
| Name | Fil | FHα,tot | FHα,fil | RHα | Axial | kT100 | K30 | Rcool | Ṁspec | kTin/kTout | Zin/Zout | RX,nuc | FNUV | F | F1.4 |
|---|---|---|---|---|---|---|---|---|---|---|---|---|---|---|---|
| Type | Ratio | ||||||||||||||
| (1) | (2) | (3) | (4) | (5) | (6) | (7) | (8) | (9) | (10) | (11) | (12) | (13) | (14) | (15) | (16) |
| Abell 0133 | I | 0.11(0.03) | 0.03(0.02) | 4.2 | 32.0 | 3.1 | 54 | 50.3 | 0.0 | 2.08/2.54 | 0.95/1.35 | 3.37 | 0.41(0.01) | 0.04(0.09) | 167 |
| Abell 0478 | I | 2.46(0.25) | 0.83(0.14) | 13.3 | 15.9 | 7.8 | 68 | 58.4 | 0.0 | 5.28/5.75 | 0.66/0.84 | 2.41 | 3.99(2.56) | 3.82(0.04) | 37 |
| Abell 0496 | I | 2.00(0.13) | 0.81(0.08) | 11.8 | 23.7 | 2.8 | 60 | 55.9 | 1.5 | 1.72/2.52 | 0.60/1.00 | 2.24 | 5.46(0.18) | 4.93(0.12) | 121 |
| Abell 0780 | I | 1.60(0.15) | 0.16(0.05) | 10.9 | 22.0 | 3.0 | 45 | 61.2 | 7.5 | 3.21/2.99 | 0.66/0.53 | 0.77 | 3.24(0.03) | 2.84(0.09) | 40800 |
| Abell 1644 | I | 0.97(0.09) | 0.36(0.05) | 18.1 | 33.3 | 2.9 | 83 | 31.1 | 3.2 | 1.79/2.48 | 0.45/1.34 | 1.82 | 0.97(0.04) | 0.51(0.11) | 98 |
| Abell 1795 | I | 3.39(0.17) | 1.13(0.10) | 56.0 | 63.7 | 3.9 | 60 | 85.0 | 7.8 | 2.99/4.33 | 0.59/0.53 | 1.43 | 2.64(0.01) | 2.32(0.07) | 925 |
| Abell 2052 | I | 2.01(0.11) | 0.77(0.07) | 15.5 | 41.4 | 2.2 | 62 | 38.5 | 2.6 | 1.07/1.94 | 0.19/0.77 | 0.64 | 0.99(0.01) | 0.09(0.21) | 5500 |
| Sersic 159-03 | I | 1.79(0.15) | 1.06(0.12) | 35.3 | 41.5 | 2.4 | 31 | 58.7 | 13.4 | 1.97/2.42 | 0.42/0.49 | 1.25 | 0.97(0.01) | 0.71(0.06) | - |
| Abell 0085 | II | 0.79(0.08) | 0.46(0.06) | 4.1 | 5.9 | 4.0 | 47 | 59.3 | 2.2 | 2.65/2.86 | 0.52/1.48 | 4.11 | 0.56(0.02) | 0.20(0.08) | 57 |
| Abell 0644 | II | 0.11(0.03) | 0.02(0.01) | 3.3 | 1.0 | 5.4 | 122 | 71.1 | 1.5 | -/- | -/- | - | 0.02(0.05) | -0.27(0.07) | 0 |
| Abell 2580 | II | 0.22(0.04) | 0.01(0.01) | 8.0 | 2.8 | - | - | - | - | -/- | -/- | - | 0.19(0.01) | 0.03(0.04) | 46 |
| Abell 3158 | II | 0.02(0.01) | 0.00(0.01) | 1.0 | 2.8 | 6.4 | 184 | 43.6 | 0.0 | -/- | -/- | 0.50 | 0.34(0.01) | 0.06(0.07) | - |
| Abell 3389 | II | 0.33(0.06) | 0.02(0.02) | 1.2 | 1.0 | - | - | - | - | -/- | -/- | - | 1.66(0.04) | 0.50(0.27) | - |
| Abell 4059 | II | 0.79(0.08) | 0.00(0.00) | 6.0 | 4.5 | 3.0 | 77 | 51.8 | 0.7 | 1.59/2.04 | 0.49/1.15 | 1.21 | 0.70(0.02) | 0.18(0.12) | 1280 |
| Ophiuchus | II | 0.87(0.15) | 0.25(0.08) | 0.1 | 1.0 | 13.4 | 284 | 31.5 | 0.0 | -/- | -/- | 1.63 | 6.56(1.54) | 5.42(0.27) | 29 |
| Abell 0970 | III | 0.01(0.01) | 0.01(0.01) | 0.2 | 1.0 | - | - | - | - | -/- | -/- | - | -(-) | -(-) | 0 |
| Abell 1650 | III | 0.03(0.03) | 0.03(0.03) | 0.1 | 1.0 | 5.0 | 91 | 30.5 | 0.0 | -/- | -/- | 1.33 | 0.13(0.01) | -0.12(0.06) | 0 |
| Abell 1837 | III | 0.04(0.04) | 0.03(0.03) | 0.3 | 1.0 | - | - | - | - | -/- | -/- | - | 0.34(0.06) | -0.07(0.10) | 5 |
| Abell 2029 | III | 0.03(0.03) | 0.02(0.02) | 0.2 | 1.0 | 5.4 | 67 | 87.1 | 3.4 | -/- | -/- | 2.10 | 0.54(0.01) | 0.17(0.09) | 528 |
| Abell 2142 | III | 0.03(0.03) | 0.02(0.02) | 0.1 | 1.0 | 6.0 | 83 | 101.6 | 1.2 | -/- | -/- | - | 0.12(0.01) | -0.02(0.03) | 0 |
| Abell 2151 | III | 0.02(0.02) | 0.02(0.02) | 0.8 | 1.0 | 2.2 | 55 | 97.3 | 8.4 | -/- | -/- | 1.74 | 0.51(0.02) | 0.07(0.11) | 2 |
| Abell 3376 | III | 0.01(0.01) | 0.00(0.00) | 1.4 | 1.0 | 4.3 | 130 | 85.7 | 2.1 | -/- | -/- | 0.48 | 0.43(0.02) | 0.22(0.05) | 261 |
| WBL 360-03 | III | 0.03(0.03) | 0.02(0.02) | 0.1 | 1.0 | - | - | - | - | -/- | -/- | - | -(-) | -(-) | 0 |
(1) Cluster name (2) Filament type, following the convention set out in §3.1 (3) Total H flux, in units of 10-14 erg s-1 cm-2 (4) H flux contained in filaments, in units of 10-14 erg s-1 cm-2 (5) Maximum radius of H emission, in units of kpc (6) Ratio of filament length to width, where the width is typically taken to be the PSF FWHM ( 0.6′′) (7) Average X-ray temperature of the cluster in the inner 100 kpc, in units of keV (8) Specific entropy of the cluster at a radius of 30 kpc, in units of keV cm2 (9) Cooling radius of cluster, in units of kpc (10) Spectrally-determined cooling flow rate, in units of M⊙ yr-1 (11) Ratio of X-ray temperatures of the gas coincident with the H filaments to the surrounding ICM derived from a single-temperature plasma model (12) Ratio of X-ray metal abundance of the gas coincident with the H filaments to the surrounding ICM derived from a single-temperature plasma model (13) FWHM of the X-ray nucleus in units of arcseconds (point source has RX,nuc 0.7′′). Nucleii which are consistent with point sources are shown in bold. (14) Total GALEX NUV flux coincident with the BCG, in units of 10-27 erg s-1 cm-2 Hz-1 (15) Total GALEX NUV flux coincident with the BCG, with the contribution from old stars removed (following §2.2), in units of 10-27 erg s-1 cm-2 Hz-1 (16) Radio flux, from the NVSS, in units of mJy.
Properties of Individual Clusters
In this section, we comment on the clusters in our sample for which the H emission is interesting in terms of its flux (or lack thereof) or morphology. We discuss possible formation mechanisms and implications on current theories as they apply to each case.
Abell 0085
A large ring can be seen in the X-ray image south of the cluster core, resembling the outer edge of a bubble. Unlike Abell 2052, however, this X-ray edge has no H counterpart. This cluster is one of three which has asymmetric H emission on small scales only. Based on the high H/NUV ratio, it is possible that the gas could be ionized by a recent burst of star formation in the BCG center. Previous works (e.g. Durret et al. 2005) have suggested that this cluster has undergone intese merging activity, based on the temperature/metallicity maps from XMM-Newton. This scenario is consistent with the relatively high temperature and entropy that we measure, compared to clusters with more filamentary H emission.
Abell 0133
A single, thin H filament extends northeast from the center of this cluster for 25 kpc. This filament is only barely detected, but the detection significance is increased slightly by the exact coincidence with an X-ray filament. This cluster appears to be very similar to Abell 1795 in both morphology (long, thin strands in a single direction) and ionization mechanism (NUV/H ratio is consistent with ongoing star formation). Based on XMM-Newton observations, Fujita et al. (2004) came to the conclusion that this X-ray filament is likely due to a buoyant radio bubble, since it was the only scenario put forward that did not directly oppose their results. However, we show that the metallicity in the filament is consistent with coming from larger radii, not smaller radii, therefore it is inconsistent with the buoyant radio bubble scenario.
Abell 0478
The X-ray morphology and H morphology match up very well in this cluster, as seen in Figure 4 and also the unsharp masked X-ray image in Sanderson et al. (2005). There appears to be two nuclei in both the H and X-ray emission, while the continuum image is that of a normal, undisturbed elliptical galaxy. The available UV data for this cluster is quite poor, but it appears that there is a significant amount of on-going star formation in the center of this cluster. However, the combination of shallow data and high extinction (E(B-V)=0.52) makes it difficult to trust these data. Without a deeper UV image of the cluster core, it is difficult to determine the heating source. This cluster also has the highest H luminosity of any other in our sample and a significant amount of structure extending beyond the optical radius of the galaxy, making it one of the most intriguing clusters in our sample.
Abell 0496
This cluster has arguably the most interesting H morphology of any cluster in our sample. There are at least 5 distinct filaments, with various shapes and directions. The two longest filaments run parallel to each other for 12 kpc. Using unsharp mask HST images, Hatch et al. (2007) found significant structure in the dust which may be coincident with some of our detected H filaments. Dupke et al. (2007) also discuss the presence of a cold front, as can be clearly seen in Figure 4, which may be due to an off-center encounter with a massive dark matter halo roughly 0.5 Gyr ago. Regardless of the method of producing this morphology in the X-ray, we note that the H filaments do not extend beyond the cold front in this cluster ( 15 kpc), despite the fact that the cooling radius is nearly 50 kpc.
Abell 0780 (Hydra A)
Wise et al. (2007) present a summary of the X-ray and radio properties of this cluster, showing the excellent correlation between the radio jets and the X-ray cavities. The arcing H filament that we detect north of the BCG appears to be spatially correlated with the radio jet. The NUV emission for this cluster is very bright, but it is unclear if it is has morphological similarities to the H emission without higher resolution UV imaging. A very bright star to the west of the BCG made the data reduction slightly more complicated for this cluster, leading to a lower S/N in the region with the southern filaments.
Abell 1644
An arcing trail of cool gas extends south from the core of this cluster. This morphology is likely the result of an off-axis encounter with a subcluster (Reiprich et al. 2004). We detect a curved H filament coincident with the cool x-ray gas, as well as two perpendicular H strands to the west and north of the cluster core. These previously-undetected filaments have large length-width ratios, suggesting that turblence must be low or the magnetic field strength must be high in this cluster core. Additionally, we find very little evidence for an AGN in this cluster, in terms of the radio power, X-ray morphology and hard X-ray flux.
Abell 1795
A pair of thin ( 100pc), intertwined filaments extend south from the cluster core for 50 kpc (MV09). These filaments appear to be heated by strands of young stars which lie along the full extent of both filaments. However, the elevated [NII]/H ratios found in MV09 and the literature suggest that either the star formation is dominated by massive stars, or another ionizing mechanism is also important. These twin filaments are coincident with a giant X-ray filament which is unresolved by Chandra. Additionally, this cluster has powerful radio jets which are offset in angle from the filament direction. The cooling wake hypothesis may be valid in this case, as the BCG appears to have a strong peculiar velocity relative to the cluster (Oegerle & Hill 2001). However, we note that a cooling wake should intuitively have slightly more turbulence than a straight cooling flow, which is inconsistent with the picture of long, thin filaments that we observe.
Abell 2029
This cluster is the most massive in our sample and also has the most massive BCG. However, despite being exceptionally bright at X-ray, NUV and 1.4 GHz, we detect no H emission. A clue as to why this may be lies in the unsharp mask image of the X-ray gas. Unlike most other massive clusters, Abell 2029 is quite symmetric with no signs of any structure in the X-ray image. This suggests that the X-ray structure which we observe in all H-bright clusters is necessary to produce the filamentary H emission. This provides yet another link between the H filaments and the cooling X-ray gas and, at the same time, offers a counter-argument to the idea of buoyant radio bubbles being responsible for the emission.
Abell 2052
The H emission surrounding the BCG in this cluster is coincident with radio-blown bubbles in the central region of the cluster. These bubbles to the north and south of the cluster core are filled with radio emission, which likely originated from the AGN within the BCG (Blanton et al. 2003). Since the H emission is seen primarily along the edges of the northern bubble, we suspect that shocks may be responsible for the heating in this case. The very low NUV/H ratio seen in Figure 6 further supports this hypothesis. As this cluster is more strongly influenced by the AGN than any other cluster in our sample, it is an outlier in some of our plots. As an example, in Figure 12 Abell 2052 is represented by the point with the lowest on-filament metal abundance. This abundance measurement is most consistent with the core abundance, not the abundance at the cooling radius. Thus it is possible that our simple picture of the H filaments being tied to the cooling flow may not apply to this cluster.
Abell 4059
The core of this cluster contains two peaks, only one of which is reproduced in H. The H emission extends for a short distance to the west, coincident with an extended arm in the X-ray image (Choi et al. 2004). The radio emission from this cluster extends north, perpendicular to the direction of H emission, suggesting that the radio jets are not playing a role in the heating.
Sersic 159-03
The optical emission in this cluster has been observed by Jaffe et al. (2005) and more recently by Oonk et al. (2010). Both authors find molecular gas which traces the ionized gas out to 20 kpc. We are able to detect H to 35 kpc, where the surface brightness blends into the background. It is likely that a deeper exposure would detect the ionized gas out to the cooling radius of 60 kpc. There is no evidence for an AGN in the core of this cluster, despite the fact that it has some of the most extended and complex filaments. This suggests that the phenomenon of warm ionized filaments in clusters is likely independent of the presence of an AGN.