11email: odysseas@snm.ku.dk
22institutetext: INAF, Osservatorio Astronomico di Roma, Via di Frascati, 33 00040 Monte Porzio Catone (RM), Italy
33institutetext: INAF, Osservatorio Astrofisico di Arcetri, Largo E. Fermi 5, 50125 Firenze, Italy
Wide field CO J = 32 mapping of the Serpens Cloud Core
Abstract
Context. Outflows provide indirect means to get an insight on diverse star formation associated phenomena. On scales of individual protostellar cores, outflows combined with intrinsic core properties can be used to study the mass accretion/ejection process of heavily embedded protostellar sources.
Aims. The main objective of the paper is to study the overall outflow distribution and association with the young population of the Serpens Core cluster. In addition, the paper addresses the correlation of the outflow momentum flux with the bolometric luminosity of their driving sources using this homogeneous dataset for a single star forming site.
Methods. An area comprising 460230 of the Serpens cloud core has been mapped in 12CO J = 32 with the HARP-B heterodyne array at the James Clerk Maxwell Telescope; J = 32 observations are more sensitive tracers of hot outflow gas than lower J CO transitions; combined with the high sensitivity of the HARP-B receptors outflows are sharply outlined, enabling their association with individual protostellar cores.
Results. Most of 20 observed outflows are found to be associated with known protostellar sources in bipolar or unipolar configurations. All but two outflow/core pairs in our sample tend to have a projected orientation spanning roughly NW-SE. The overall momentum driven by outflows in Serpens lies between 3.2 and 5.1 10-1 M⊙km s-1, the kinetic energy from 4.3 to 6.7 1043 erg and momentum flux is between 2.8 and 4.4 10-4 M⊙ km s-1 yr-1. Bolometric luminosities of protostellar cores based on Spitzer photometry are found up to an order of magnitude lower than previous estimations derived with IRAS/ISO data.
Conclusions. We confirm the validity of the existing correlations between the momentum flux and bolometric luminosity of Class I sources for the homogenous sample of Serpens, though we suggest that they should be revised by a shift to lower luminosities. All protostars classified as Class 0 sources stand well above the known Class I correlations, indicating a decline in momentum flux between the two classes.
Key Words.:
stars: formation - sub-mm lines: ISM - ISM: jets and outflows - ISM: molecules1 Introduction
The Serpens cloud core is an active region of low mass star formation harboring a great diversity of star-birth associated phenomena. Since its first identification as a stellar nursery by Strom et al. (1976), several studies have revealed several mm sources identified as protostellar condensations (Testi & Sargent 1998), 10 Class 0 candidates (Casali et al. 1993; Hurt & Barsony 1996; Harvey et al. 2007; Winston et al. 2007), at least 20 Class I sources (Kaas et al. 2004; Winston et al. 2007; Harvey et al. 2007) along with a more evolved population of 150 Class II sources detectable in the near-IR (Eiroa & Casali 1992; Giovannetti et al. 1998; Kaas 1999). The remarkably high stellar density and star formation efficiency (5 Evans et al. 2003), along with its proximity ( 310 pc de Lara et al. 1991) have rendered Serpens an observationally attractive site for star formation studies, as evidenced by the extensive literature.
Star formation activity in Serpens is also manifested by dynamic mass-loss phenomena such as optical and near-IR detections of Herbig Haro objects (Gomez de Castro et al. 1988; Reipurth & Eiroa 1992; Davis et al. 1999; Ziener & Eislöffel 1999), near-IR molecular jets (Hodapp 1999; Eiroa et al. 1997; Herbst et al. 1997) and molecular outflows. Individual outflows in Serpens have been recorded in a wide variety of molecular tracers and different transitions (e,g, CS Testi et al. (2000); Mangum et al. (1996); Wolf-Chase et al. (1998), H2CO Mangum et al. (1996), CH3OH Garay et al. (2002); Testi et al. (2000), HCO+ Gregersen et al. (1997); Hogerheijde et al. (1999), HCN, SO and SiO Hogerheijde et al. (1999); Garay et al. (2002), NH3 (Torrelles et al. 1992)). Wide field, homogenous outflow mapping of the Serpens Core has so far been performed only at the J = 10 (Narayanan et al. 2002) and J = 21 (White et al. 1995; Davis et al. 1999) transitions of carbon monoxide. This region has been mapped very recently also in the CO J = 32 as part of the JCMT Gould Belt Legacy Survey (GBS) to investigate the large scale mass and energetics of the cloud (Graves et al. 2010).
In this paper, we present a new CO J=32 map covering 460 230 of the Serpens core, with the aim of studying with an unprecedented detail the individual outflows of the region; compared to lower J maps, the higher energy transition (corresponding to a smaller beam for the same dish aperture) coupled with the higher sensitivity reached by the HARP-B observations delineate better than before individual outflows. The advantage of higher energy transitions in mapping outflows is instructively illustrated in Figure 3 of Narayanan et al. (2002), where higher-J CO close-ups are presented towards the Class 0 source SMM4: higher J maps suffer from much less confusion as the ”warm” outflowing gas is better disentangled from the ”cold” cloud material; this is particularly important in Serpens, where protostellar sources are closely clustered and their outflows tend to overlap and mix.
Discriminating individual outflows enables the detailed investigation of a series of phenomena related to their generation. Outflow emission traces the swept-up ambient gas that has been entrained by a jet/wind that is directly linked to a protostar; in the opposite sense, i.e. backtracking the outflow lobes, the latter can be associated with individual protostellar sources. In addition, outflow activity is thought to begin almost simultaneously with the formation of a hydrostatic core; therefore outflows paired to protostellar clumps can be employed as independent means for the identification of the existence of embedded protostars (e.g. Hatchell & Dunham 2009).
Alternatively, outflows can be employed to study the accretion and mass ejection process in otherwise highly obscured and unaccessible protostellar environments. There is increasing evidence that the momentum flux or ”thrust” of molecular outflows is linked with the luminosity of the protostellar core (e.g. Cabrit & Bertout 1992; Bontemps et al. 1996; Wu et al. 2004; Hatchell et al. 2007a). Such correlation implies that independently of the details of the mass accretion and ejection mechanisms, both quantities are energetically governed in common by infall. Still, observational determination of both outflow thrust and bolometric luminosity in clustered protostellar environments remains challenging, and therefore their exact correlation remains not well defined.
In this context, in §2 we present the HARP-B observations and give an outline of the data reduction. Morphological characteristics of outflows and their association with individual protostellar sources are discussed in §3. In §4, we derive outflow properties such as the column density, mass , momentum, kinetic energy and the momentum flux.. In §4.4 we estimate the bolometric luminosity employing recent Sptizer mid and far-IR photometry for the sources associated with the observed outflows. §5 examines the correlation between the bolometric luminosity and momentrum flux, for the homogenous sample of sources in Serpens. In the same section, the relation between the bolometric luminosity with the outflow mass and mechanical luminosity are discussed. Finally, in §6 we summarize and draw the main conclusions of this work.
2 Observations and data reduction
12CO J = 32 on-the-fly (OTF) maps were obtained between 09 April and 09 June 2007 with the HARP-B heterodyne array (Smith et al. 2008) and ACSIS correlator (Dent et al. 2000; Lightfoot et al. 2000) on the James Clerk Maxwell Telescope (JCMT). The mapped area was covered by consecutive scans in ”basket-weave” mode at a position angle of 322o. Each scan was offset from its neighbourings by 87.3 in the orthogonal direction and signal was integrated every 7.3 along the scan direction with an effective integration time of 3 seconds per point. The resulting map dimensions are 7.74.3, however the fully sampled area is somewhat smaller as the borders are not fully sampled due to a number of non-functional HARP-B receptors at the time the observations were performed. The spectral resolution is 488 KHz which corresponds to 0.41 km s-1 at the frequency of 345.795 GHz. Single maps were coadded and initial data cubes were converted with makecube command in the STARLINK/SMURF package. The resulting map is centered at = 18h29m49s.7, = 01o1522.8 (epoch J2000) and has a pixel size of 7.3, which is just below the Nyquist sampling limit for the 14 beamwidth of each HARP-B receptor. A correction of nMB=0.6 for the main beam efficiency was applied, and further reduction was performed with the CLASS/GreG packages. The mean rms noise in brightness temperature TB per spectrum across the map is 0.08K, which is slightly deeper than the 0.1K reported in (Graves et al. 2010), while the 1-sigma rms level for the map is at 0.27 K km s-1. Pixels exhibiting an rms noise greater than 6-sigma of the mean were discarded in the final maps.
3 Outflow Morphology
3.1 Global
The global morphology of the high-velocity gas in the investigated region, can be evidenced in Figure 1, presenting the CO J = 32 intensity map integrated over the high velocity blue shifted (-30 km s-1 VLSR 0 km s-1) and red shifted (18 km s-1 VLSR 48 km s-1) wings, superimposed over a (grayscale) Spitzer-MIPS 24 m image. The 24 m band was selected for being sensitive in tracing continuum emission from protostellar envelopes surrounding deeply embedded sources, and providing superior spatial resolution than the other, longer-wavelength MIPS bands. In Figure 1, the dashed rectangle delineates the extent of the mapped area, and solid line rectangles A, B and C indicate areas that are discussed in detail in §§3.2 - 3.4. CO J = 32 representative spectra sampling the map of Fig. 1 at different offsets are displayed in Figure 2; dashed vertical lines mark the velocity intervals over which the intensity is integrated, and the solid line indicates the cloud systemic velocity ( 9 km s-1), coinciding with the self-absorption profile. Low velocity cuts at 9 km s-1 from the body of the line ensures that the ambient contribution is excluded. High velocity cuts are imposed by the rms noise level of the maps; the higher sensitivity obtained with these observations ( 4 times higher than the one reached by Davis et al. 1999) with the same the same telescope) allow to extend the high velocity cutoffs to 40 km s-1 from the VLSR.
In Fig. 2, two types of high velocity wing morphologies are distinguishable: in the lower two panels, high velocity gas forms continuous, fading-off wings as a function of velocity from VLSR; in the upper two panels high velocity gas exhibits a semi-detached distribution, with a secondary peak tracing clumps of high velocity blue and red-shifted gas. The latter wing morphology is indicative of high velocity ”bullets” of gas, commonly observed in molecular jets from Class 0 protostars (e.g. Bachiller et al. 1991)
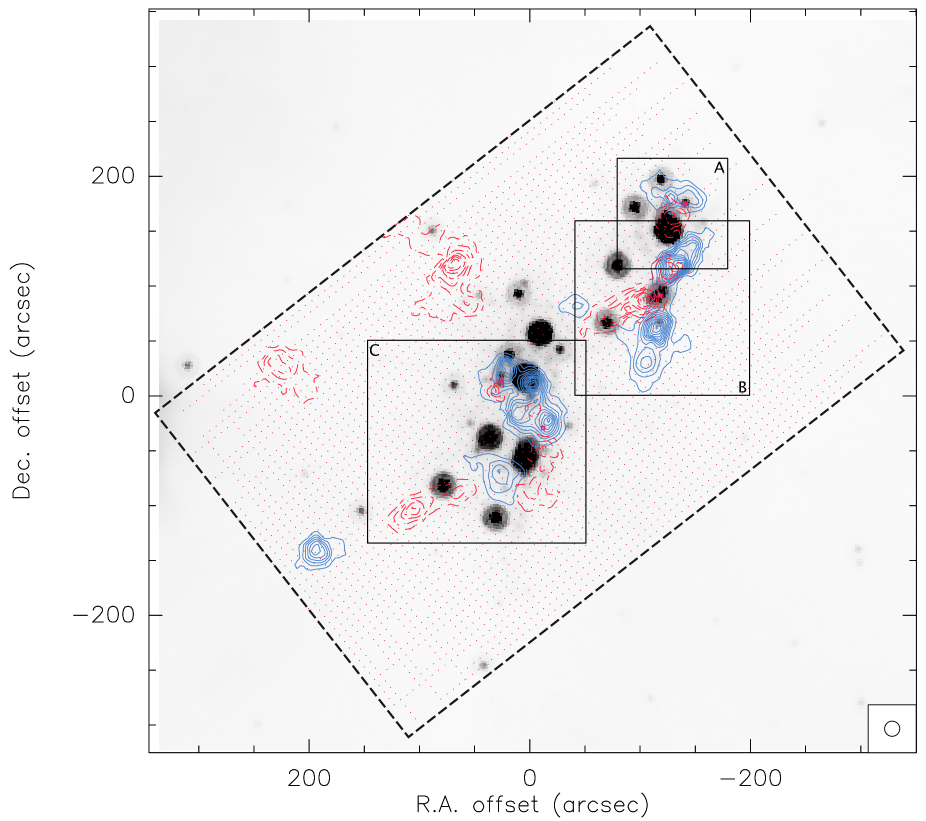
The large scale spatial distribution of the poorly evolved Class0/I young stellar objects in Serpens, identified on the basis of their SED (Hurt & Barsony 1996; Larsson et al. 2000; Winston et al. 2007), infrared excess and spectral indices (Kaas 1999; Kaas et al. 2004; Enoch et al. 2008; Winston et al. 2007), or detection of luminous millimeter and sub-millimeter continuum sources (Casali et al. 1993; Testi & Sargent 1998; Davis et al. 1999; Williams & Myers 2000), displays concentrations into two clumps located at the NW (areas A and B) and SE (area C), separated by 200 (Casali et al. 1993), as traced by the 24m MIPS background image in Figure 1. Not surprisingly, most of the outflow activity observed in same figure is tightly constrained to the same NW and SE clumps, as powerful molecular outflows are known to be driven by very young stellar objects (Richer et al. 2000). Twelve out of fourteen sources classified as bona-fide Class0/I sources (Winston et al. 2007) lie within the extent of the CO J = 32 HARP-B map.
The distribution of more evolved Class II sources in contrast, shows no signs of clustering but are found to be more dispersed (Kaas 1999). It has been suggested that the difference in the spatial distribution of YSOs at different evolutionary stages reflects different star forming episodes in Serpens (Casali et al. 1993; Hurt & Barsony 1996; Kaas et al. 2004).
In §§3.2 - 3.4 we examine the particular characteristics for each one of the defined areas A-C and attempt to attribute the observed outflows to individual sources. From this perspective, isolated outflows that are not comprised within the examined areas could not be connected to any of the protostellar sources in the mapped area. High velocity CO J = 32 intensity maps are examined in conjuction with Spitzer IRAC band-2 (4.5 m) and MIPS band-1 (24 m) images from Winston et al. (2007). Within the IRAC band-2 fall a number of high-excitation energy pure rotational and ro-vibrational H2 lines, which trace warm, shocked gas from the underlying protostellar jets; such emission assists in the coupling between outflows and candidate driving sources. Possible connections are also derived comparing with data from the very rich literature on Serpens, that covers observations of near-IR jets to high density sub-millimeter and millimeter molecular outflow tracers. From this analysis, we identify 11 sources that most likely are responsible for the bulk of molecular outflow activity observed in the Serpens Core. About half of sources appear to drive bipolar outflows and from these, four exhibit H2 jet-like emission associated with these outflows. The projected position angles of outflows, estimated from the peaks of outflow emission with respect to the corresponding driving sources, tend to have, within uncertainties mainly due to the limited resolution of the maps, an orientation in the NW-SE direction (see Table 1 and Figures 3, 5, and 7). This alignemnt that has been attributed to influence of the helical component of the large scale magnetic field (Gomez de Castro et al. 1988), however recent polarimetry observations (Sugitani et al. 2010) indicate a hourglass shaped field centered between the NW and SE clumps, which in many cases is aligned perpendicularly to the direction of the observed outflows. Therefore no secure conclusions can be drawn from the present data on the role of the local magnetic field and the outflow alignment.

For the positional determination and characterization of the evolutionary state of the YSO’s in the present study, we have employed the analytical catalogues of Winston et al. (2007). To avoid confusion, when existing we adopt the nomenclature of SMM sources listed in Casali et al. (1993), whereas for the rest we use the Spitzer ID from the Winston et al. (2007) catalogue with the letter W as a prefix
3.2 Area A
Figure 3 presents a magnification of the outflow activity within Area A (Fig. 1) superimposed over an IRAC band 2 (upper) and MIPS band 1 (lower) grayscale images while Figure 4 shows individual velocity channel maps, that have assisted in the identification of the outflowing gas with respect to the ambient material, and in the association of blue- and red-shifted outflow lobe pairs emitted from the same source. In both panels of Fig. 3 the positions of known Class0/I sources from the catalogue of Winston et al. (2007) are labeled along with prominent high velocity outflow lobes; the extended blue-shifted emission at the south is discussed in the next section. Being located close to the border of the CO map, area A is not fully sampled; contour levels employed here are the same as in Fig. 1 for the sake of consistency, however outflows are better delineated in the velocity channel maps close to the low velocity cutoffs of Fig. 4, where contour levels start at 0.25 K km s-1 and are spaced by the same amount.
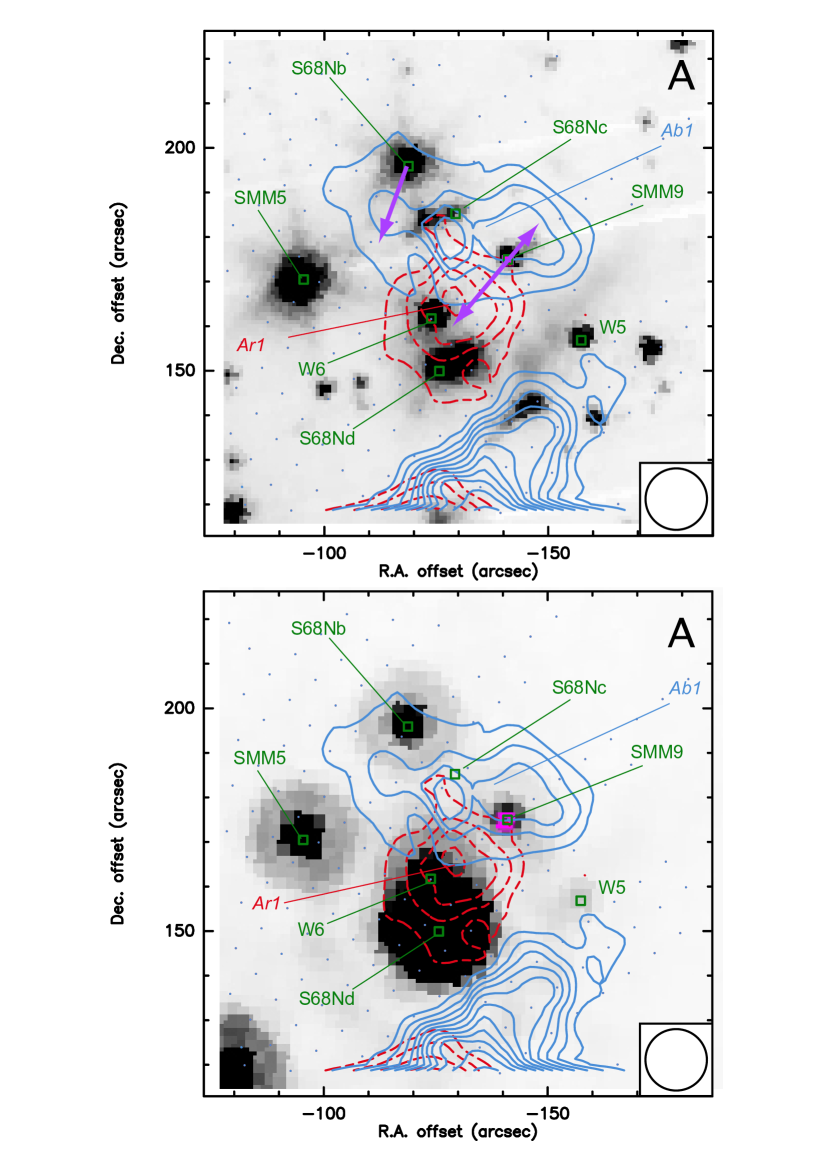
Area A covers the S68N region at the northwest of the Serpens Core; submillimeter single dish (Davis et al. 1999) and interferometric observations (Testi & Sargent 1998; Williams & Myers 2000) have revealed the existence of four cores, named S68Na through d, with S68Na most likely coinciding with the continuum source SMM9 (White et al. 1995; Wolf-Chase et al. 1998). To the east, the continuum source SMM5 (Casali et al. 1993) is possibly associated with the bright near-IR cometary nebula EC53 (Eiroa & Casali 1992; Hodapp 1999); however, while the head of the cometary nebula lies close to the sub-mm source, the latter is not detected in the near-IR.
The blue and red shifted lobes Ab1 and Ar1 in Figure 3 most likely represent a bipolar outflow from S68Na/SMM9 at a projected position angle (P.A.) of 150o. Although Ab1 being at the far edge of the map is not well outlined, the jet like emission in the IRAC image adjacent to the driving source and pointing to the NE possibly indicates the direction of the underlying jet, which in this case coincides with the orientation of the associated outflow. Maps of CS J = 21 (Wolf-Chase et al. 1998; Testi et al. 2000; Williams & Myers 2000), methanol (Testi et al. 2000; Garay et al. 2002) and SiO (Garay et al. 2002) outline a similar bipolar outflow connected to SMM9 at a position angle of 135o-145o, and therefore are in support to such correlation.
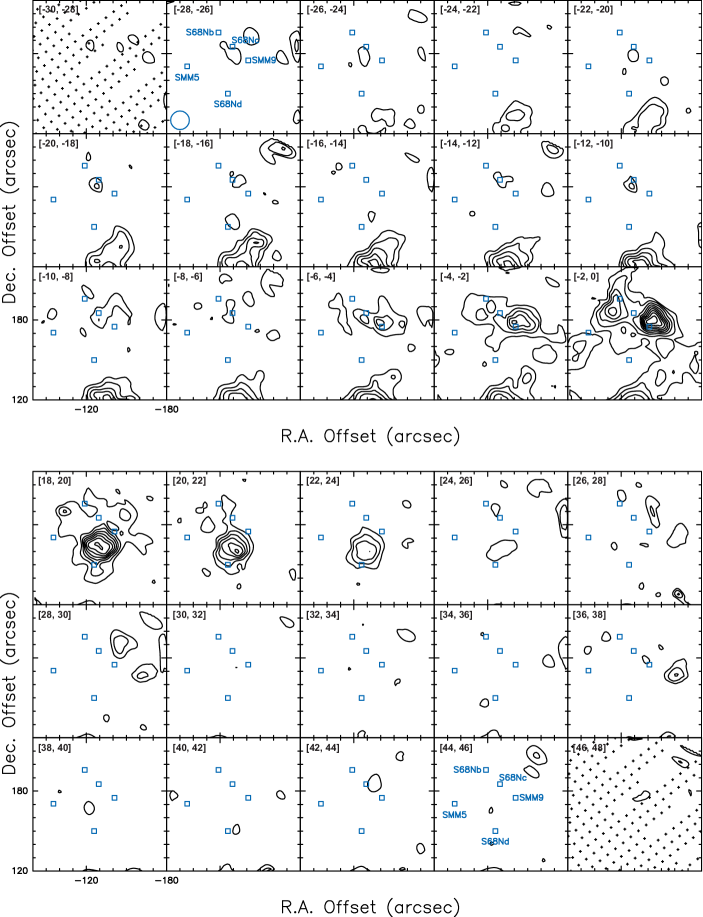
The extension of lobe Ab1 to the east lying roughly between S68Nb and SMM5 is harder to associate. The underlying jet-like emission in the IRAC image very close to S68Nc pointing to the SE is resolved as a series of knots in near-IR H2 1-0 () S(1) (2.12 m) imaging (Hodapp 1999); proper motions show that these knots are moving towards SMM5 (Hodapp 1999), therefore favoring S68Nc as their progenitor. Still, it is doubtful if there exists an embedded protostar within the S68Nc clump, as it is scarcely detected in the far-IR and sub-mm continuum (Winston et al. 2007; Davis et al. 1999), and only appears as an elongated condensation at 3 mm (Williams & Myers 2000). In the [-2, 0] velocity channel map of Fig. 4, Ab1 displays an orientation towards the south, implying a possible connection with S68Nb; as other sources do not provide convincing evidence, we tentatively associate the extension of lobe Ab1 to the source S68Nb.
In the [-2,0] and [18, 20] channels of Figure 4, two weak (blue and red-shifted) lobes pointing to the SE and NW from SMM5 and possibly associated to this source are recorded. Due to the contour level selection, these lobes are not visible in Fig. 3, however we consider them as real and name them Ab2 and Ar2 (see table 2). Similar weak red-shifted emission with roughly the same orientation is only recorded in the J = 1 CO map of Narayanan et al. (2002).
3.3 Area B
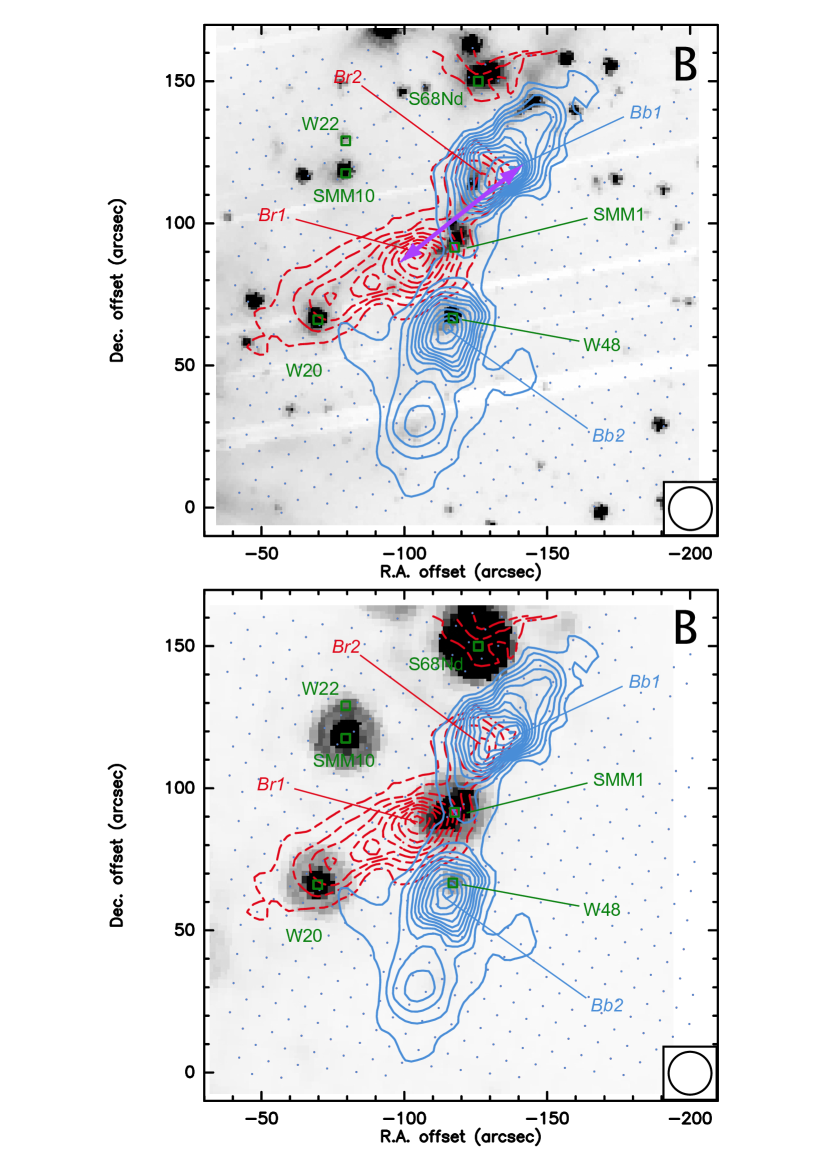
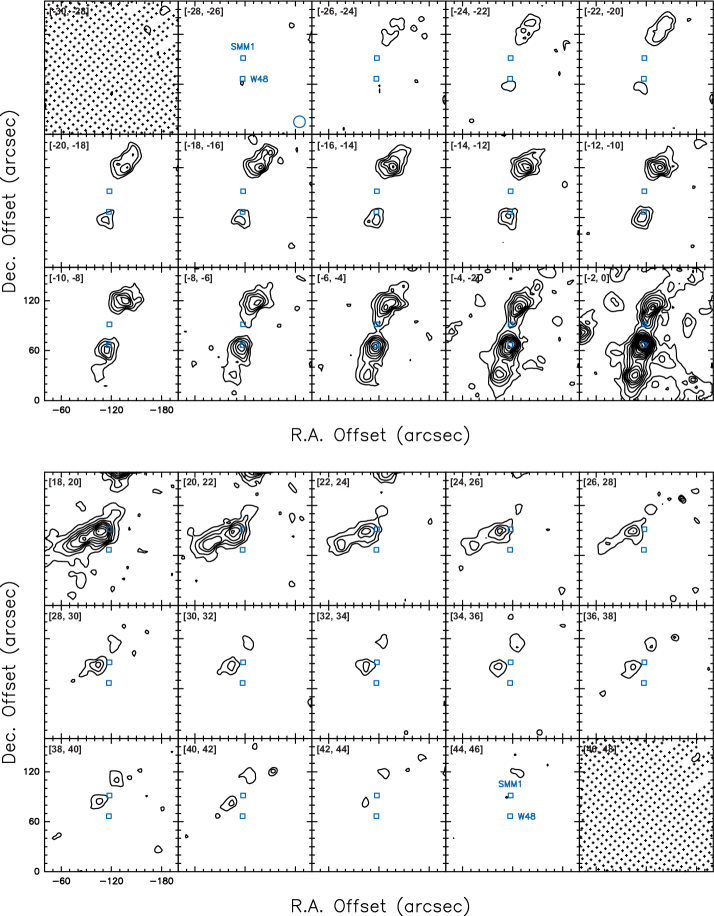
Area B is located to the south of Area A and displays the outflow activity below the S68N clump. Although Areas A and B together confine the Serpens NW region, due to its unique characteristics this segment is presented here stand-alone. As in the case of Area A, in Figure 5 we present high velocity J = 32 CO outflows superimposed on the IRAC band 2 and MIPS band 1 images (upper and lower panels respectively). Again, deeply embedded Class0/I sources are tagged along with the strongest outflow lobes.
This area comprises SMM1/FIRS1 and SMM10, the former being most prominent source in Serpens (Casali et al. 1993; Hurt & Barsony 1996; Davis et al. 1999), that displays a series of mass ejection phenomena. It has been associated with a radio jet and OH maser emission (Rodriguez et al. 1989; Curiel et al. 1993) while strong outflows have been traced in a number of molecular lines.
High velocity CO emission as evidenced in Figure 5 is rather puzzling; there are two blue-shifted (Bb1,2) and two red-shifted lobes (Br1,2) that all seem to converge towards SMM1. Both Bb1 and Br2 point out towards the NW and overlap; the line wing morphology at the peaks of these lobes, presented in the upper two spectra of Fig. 2 indicates the existence of high velocity ”bullets”, which in velocity channel maps of Figure 6 can be traced up to the [-24,-22] and [+38,+40] velocity bins, symmetrically to the nominal cloud velocity. The spatial coincidence along with the common wing morphology suggest that Bb1 and Br2 represent the same high velocity gas projected at different Doppler-shifts on the plane of the sky.
| Source | Outflow P.A. (o) |
|---|---|
| SMM1a | 130 5 |
| SMM3a | 155 8 |
| SMM4a | 170 7 |
| SMM5a | 135 10 |
| SMM6b | 35 8 |
| SMM8c | |
| SMM9a | 150 10 |
| S68Nbb | 160 10 |
| W10b | 130 8 |
| W45a | 70 15 |
| W48c | |
| a driving bipolar outflow | |
| b driving unipolar outflow | |
| c position angle uncetain |
Mid-IR IRAC emission in Figure 5, shows arc-shaped features, extending to the NW and SE outlining the rim of the CO lobes Bb1 and Br1. The same morphology is also traced in Near-IR 1-0 S(1) H2 imaging (Hodapp 1999) and possibly in CS Williams & Myers (2000); we note that unlike the outflow from SMM9, the CS features corresponding to Bb1 and Br1 have opposite Doppler-shift than the CO lobes and are much weaker. The base of the NW and SE cavities very close to SMM1 also appear in high density molecular tracers such as HCO+ and HCN (Hogerheijde et al. 1999) and the (1,1) transition of ammonia (Torrelles et al. 1992).
All the existing evidence leads to the association of Bb1 and Br2 pointing to the NW and Br1 to the SE with SMM1 at a single bipolar outflow configuration; however, more complex configurations involving a binary source (as suggested by White et al. 1995) cannot be excluded. The position angle of the outflow is 130o, coinciding with the position angle of 125o of the underlying radio jet (Rodriguez et al. 1989; Curiel et al. 1993), a fact evidencing the possible connection between the two phenomena. To the south, the alignment of the peak of lobe Bb2 with the flat spectrum source W48 (Winston et al. 2007) may be interpreted as if Bb2 is a face-on unipolar outflow with a non-detected receding, red-shifted lobe pointing away from the observer.
Very little evidence of outflows exist in the vicinity of SMM10, traced only in the [-2, 0] channel of Figure 6. The evolutionary stage of this protostellar source is uncertain; Eiroa et al. (2005) has classified it as a Class 0 source, but the significant emission recorded shortward 24 m (Winston et al. 2007) and the lack of strong outflows are indicative of a more advanced protostellar stage.
3.4 Area C
Area C comprises the SE clump of the Serpens Core, a highly populated region where protostellar sources in various evolutionary stages are packed together with bright near-IR nebulosities. Millimeter and sub-millimeter maps (Casali et al. 1993; Testi & Sargent 1998; Davis et al. 1999) reveal four significant condensations, named after Casali et al. (1993) as SMM2,3,4 and 6. In the near-IR, the bright Serpens Reflection Nebula (SRN) is associated with SVS20 and SVS2, the two brightest near-IR sources in the Serpens Core complex (Eiroa & Casali 1992).
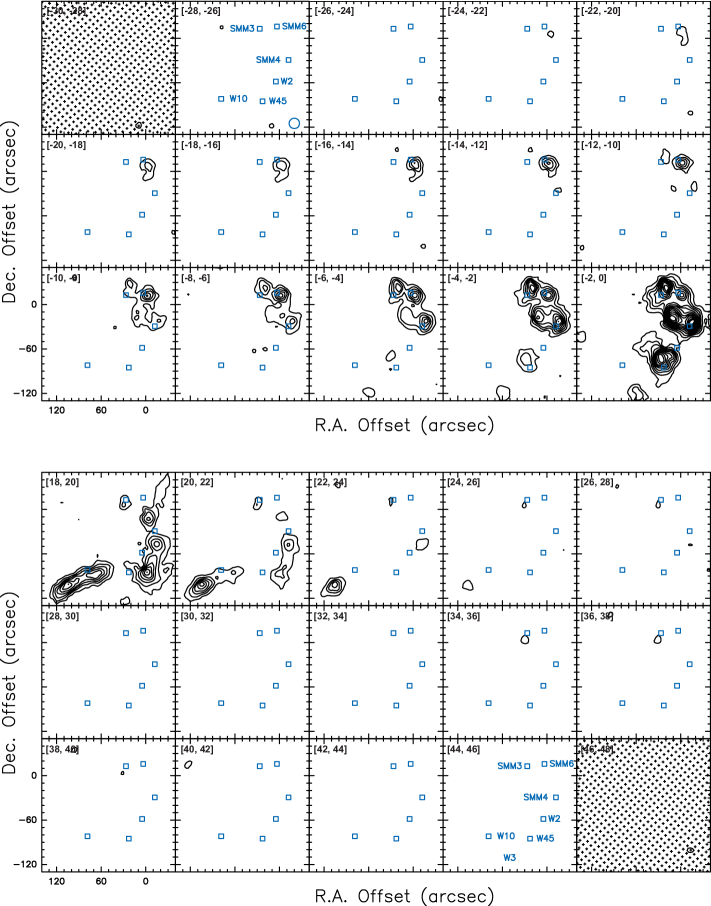
As in the previous areas, the high velocity CO J = 32 outflows are displayed over the IRAC band 2 (upper) and MIPS band 1 (lower) panels in Figure 7. The positions of the SMM sources along with other Class0/I and flat spectrum sources from Winston et al. (2007) are marked in both panels. A high concentration of possible Class II sources and field stars is observed towards the SW in the IRAC image, while significant emission from the reflection nebula is apparent towards the north and center of Area C, With the exception of SMM6, all other SMM sources do not appear bright on the 24 m MIPS band. Outflow contours around SMM3,4 and 6 are clustered, but display a number of peaks which are tagged in both panels of Figure 7. The velocity range for the majority of the outflows in this area is lower than observed for the NW clump (areas A and B); significant blueshifted and redshifted emission is recorded up to [-10, -8] and [26, 28] km s-1 velocity bins respectively, with an exception of the blueshifted lobe Cb2 which is observed up to the [-26, -24] km s-1 channel (Fig. 8).
With the exception of SMM2, all the SMM sources in the region have associated CS and H2CO emission counterparts (Mangum et al. 1996). However, it is not yet clear whether SMM2 harbors a protostellar source. Despite being observed as a condensation in the sub-millimeter (Davis et al. 1999), it is scarcely or not at all traced in millimeter continuum observations (Testi & Sargent 1998; Hogerheijde et al. 1999).In addition, the two nearby mid-IR Class0/I sources W17 and W18 present in the 24 m MIPS band (Winston et al. 2007) are offset from the 3-mm position of SMM2 (Testi & Sargent 1998), and therefore not related to it. The lobe Cb4, located 20 to SW is most likely not related to SMM2 but with some of the more evolved sources to the SE, possibly in a bipolar scheme with Cr4. Therefore, the absence of any apparent outflow emission in the vicinity is in favor of the view that SMM2 is a warm cloud condensation without an embedded source.
SMM3 is a mm/sub-mm continuum source located to the north of Area C; in the IRAC image, there is strong jet-like emission extending to the NW from the source, at a position angle of 155o traced also in the near-IR H2 1-0 S(1) line (Herbst et al. 1997; Eiroa et al. 1997). Most likely, the emissions observed to the same direction in HCO+, HCN and SiO (Hogerheijde et al. 1999) and CS (Testi et al. 2000) trace the same outflow activity. Lobe Cb1 follows the direction of the jet-like emission and peaks 10 to the NW of SMM3, while Cr1 is collinear, pointing to the opposite SE direction and peaks roughly at the same projected distance from the source. Even though a number of other nearby Class0/I sources (e.g. W19, W4) are present nearby, the positioning of SMM3 with respect to Cb1 and Cr1 along with the outflow detected in other molecular tracers are in favor of their association.
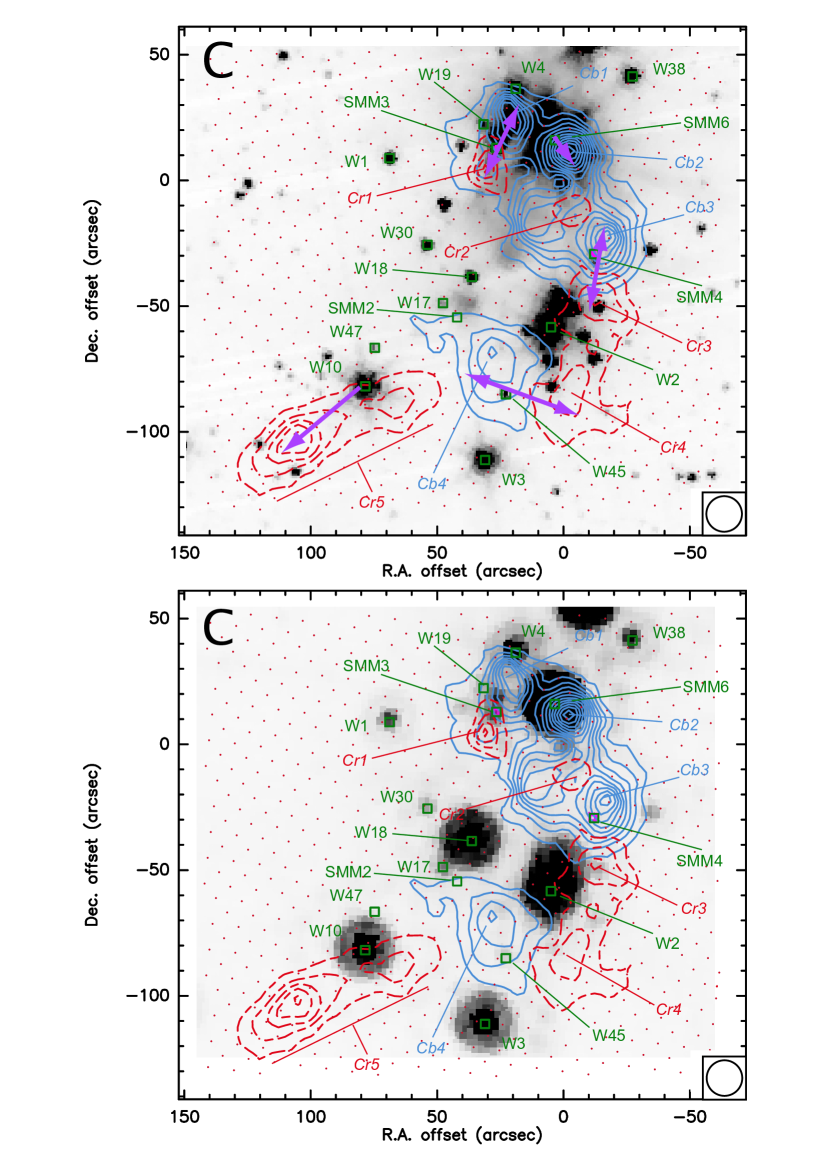
SMM4 is located to the west of Figure 7, between the two dominant diffuse emission regions in the IRAC image. In the same image, two small nebulosities appear very close to the source in a North-South direction. The same morphology is observed in the near-IR (Eiroa et al. 2005), while outflows with the same direction are traced in CS, CH3OH (Testi et al. 2000), HCO+ and HCN Hogerheijde et al. (1999), as well as in lower J CO maps (Davis et al. 1999; Narayanan et al. 2002) This structure becomes evident in the J = 32 map of Narayanan et al. (2002) where a bipolar outflow is clearly shaped. In Figure 7, lobes Cb3 and Cr3 display similar morphological characteristics, and most likely are associated with SMM4.
To the NW of Area C, the bright IRAC nebulosity is at the location of the near-IR binary SVS20/EC90, the brightest near-IR source in Serpens Eiroa & Casali (1992) coinciding with the position of mm/sub-mm source SMM6. This is a binary system is surrounded by a near-IR ring or nebulosity, with two spiral arms seen in opposite directions (Herbst et al. 1997; Eiroa et al. 1997), that have been interpreted as a circumbinary disk (Eiroa et al. 1997) or evacuated bipolar cavities (Huard et al. 1997). Binary components have a north-south distribution separated by only 1.5 and both present a flat spectrum SED (Haisch et al. 2002). It has been suggested that the southern component has strong Br and CO bands in emission indicating the presence of an accretion disk that most likely corresponds to SMM6 (Eiroa et al. 2005). The most prominent southern arm observed in the near-IR H2 emission (Huard et al. 1997; Herbst et al. 1997; Eiroa et al. 1997) is in the direction of the blue-shifted lobe Cb2 in Figure 7, and we tentatively attribute it to SMM6. Most likely, the red-shifted emission is obscured by the nebulosity, as AV values ranging between 9 mag (Cambrésy 1999) and more than 20 mag (Huard et al. 1997) have been measured for this region.
At the south of Area C, there is a wealth of IRAC sources, the majority of them classified as Class II protostars or field stars. Class 0/I and flat spectrum sources from the Winston et al. (2007) catalogue are labeled on Figure 7, around lobes Cb4, Cr4 and Cr5. These lobes are present in lower J CO observations but are mostly prominent in the high velocity map of Davis et al. (1999). The protostellar source W45 lying approximately between lobes Cb4 and Cr4 is a flat spectrum source (Winston et al. 2007) that could potentially drive the observed bipolar structure. Even though it is not the least evolved nor the best positioned source with respect to the outflows, it is the only one optimally satisfying both conditions. Similarly, the red-shifted lobe Cr5 is located just south of W10, classified as Class0/I in Winston et al. (2007) catalogue which is possibly correlated to the bright continuum source PS2 detected by Hurt & Barsony (1996) and also present in the 3-mm map Testi & Sargent (1998) . In the absence of any blue-shifted emission in the vicinity, we tentatively attribute Cr5 to W10 as a unipolar outflow.
Strong isolated red-shifted emission is evident in Figure 1 to the north but outside of Area C in the vicinity of mm/submm source SMM8. This emission corresponds to the NEr lobe of the high velocity CO map of Davis et al. (1999), and as in the case of W10, we tentatively correlate this emission to SMM8 as a unipolar outflow. Finally, no possible driving sources could be found for the remaining blue and red-shifted lobes to the upper and lower left (east) of Area C in Figure 1. We have examined thoroughly the literature for a possible source between lobe Cr5 (Area C) and the intense blue-shifted emission outside the lower left corner of Area C which corresponds to lobe SEb in the high velocity maps of Davis et al. (1999) that could justify a possible bipolar scheme, but no appropriate candidate sources could be found.
. Outflow Source Ntot Mtot Ptot EK tdyn FCO Lmech (1016cm-2) (10-3 ) (10-2 km s-1) (1042 erg) (103 years) (10-5 km s-1 yr-1) (10-2 L☉) Area A Ab1 SMM9 1.89 - 2.97 0.49 - 0.78 1.03 - 1.63 1.25 - 1.98 0.7 1.47 - 2.33 1.42 - 2.26 Ar1 SMM9 1.87 - 2.95 0.48 - 0.77 1.10 - 1.72 0.73 - 1.16 0.9 1.22 - 1.72 0.64 - 1.03 Ab2 SMM5 1.53 - 2.41 0.4 - 0.63 0.3 - 0.49 0.24 - 0.4 2.9 0.11 - 0.17 0.07 - 0.11 Ar2 SMM5 1.07 - 1.7 0.3 - 0.45 0.23 - 0.37 0.2 - 0.32 1.5 0.15 - 0.24 0.11 - 0.17 Ab3 S68Nb 2.49 - 3.94 0.6 - 1.03 0.5 - 0.8 0.41 - 0.65 1.8 0.27 - 0.44 0.18 - 0.29 Area B Bb1 SMM1 10.44 - 16.52 2.73 - 4.33 5.64 - 8.92 10.78 - 17.04 2.6 2.57 - 3.43 3.31 - 5.24 Br1 SMM1 8.62 - 13.63 2.26 - 3.57 4.22 - 6.67 6.23 - 9.85 2.9 1.45 - 2.30 1.71 - 2.71 Br2 SMM1 1.86 - 2.94 0.49 - 0.77 1.23 - 1.95 2.42 - 3.82 1.5 0.81 - 1.30 1.29 - 2.03 Bb2a W48 10.02 - 15.84 2.62 - 4.15 4.36 - 6.89 5.97 - 9.44 Bb2b W48 7.47 - 11.81 1.96 - 3.09 3.28 - 5.19 5.05 - 7.98 Area C Cb1 SMM3 3.27 - 5.17 0.86 - 1.35 1.29 - 2.04 1.64 - 2.59 1.1 1.17 - 1.85 1.17 - 1.88 Cr1 SMM3 0.68 - 1.08 0.18 - 0.28 0.42 - 0.66 0.60 - 0.94 0.9 0.47 - 0.73 0.53 - 0.83 Cb3 SMM4 7.45 - 11.79 1.95 - 3.09 2.96 - 4.68 3.78 - 5.97 0.7 4.24 - 6.7 4.32 - 6.82 Cr3 SMM4 2.04 - 3.22 0.53 - 0.84 1.07 - 1.69 0.82 - 1.29 1.5 0.70 - 0.79 0.43 - 0.62 Cb2 SMM6 4.52 - 7.15 1.18 - 1.87 2.21 - 3.49 4.02 - 6.36 0.6 3.69 - 5.82 5.36 - 8.48 Cr2 0.31 - 0.49 0.08 - 0.12 0.18 - 0.28 0.02 - 0.03 Cr5a W10 4.77 - 7.54 1.25 - 1.97 2.30 - 3.63 1.74 - 2.76 2.8 0.82 - 1.29 0.49 - 0.78 Cr5b W10 1.67 - 2.63 0.43 - 0.69 0.88 - 1.40 0.46 - 0.73 Cb4 W45 3.37 - 5.34 0.88 - 1.40 1.44 - 2.27 1.08 - 1.71 1.9 0.76 - 0.89 0.45 - 0.72 Cr4 W45 1.90 - 3.01 0.50 - 0.79 0.90 - 1.42 0.70 - 1.11 2.1 0.43 - 0.67 0.26 - 0.42 N1 SMM8 5.09 - 8.05 1.34 - 2.1 1.11 - 1.7 0.96 - 1.51 1.4 0.79 - 1.21 0.55 - 0.86
a extended lobe
b primary lobe
4 Outflow Properties
In the following sections we calculate the fundamental outflow-related properties (i.e. column densities, masses, momentum, energies. momentum fluxes and mechanical luminosities), employing the method described in Choi et al. (1993) for the CO J = 32 transition. Associated uncertainties are discussed in accordance with the present dataset and in respect with other methods (e.g. Cabrit & Bertout 1990; Bontemps et al. 1996; Fuller & Ladd 2002; Hatchell et al. 2007a).
4.1 CO Column Density and Outflow Mass
The column density in cm-2 per velocity channel i for the CO J = 32 line was calculated from the relation
| (1) |
where is the dipole moment of the CO molecule, T is the corrected mean beam temperature in K within the velocity interval (in km s-1), is the optical depth and D(n,TK) is given by the relation:
| (2) |
Here, f2 is the fraction of CO molecules in the J=2 state which is dependent on temperature or the excitation conditions in the case of non-LTE, J(T) is the Planck function in K, Tex is the excitation temperature and Tbk=2.7K.
The particular characteristic of this method in deriving the column density as opposed to other methods introduced in the literature (e.g. Cabrit & Bertout 1990; Bontemps et al. 1996) lies in the treatment of the quantity D(n,T). Cabrit & Bertout (1990) assumes LTE conditions so that the excitation temperature equals to the kinetic one; at this limit, D(n,T) is independent from the density, so that D(n,T)=D(TK). Adopted kinetic temperatures in the literature vary from ”cold” 10 K (10 - 20 K Cabrit & Bertout 1992; Bontemps et al. 1996) to ”warm” (50 K Hatchell et al. 2007a) CO gas, depending on the observed transition. Choi et al. (1993) approach this quantity in more general terms, assuming non-LTE conditions. They employ LVG simulations to test its variance and find that an average value for D(n,TK)=1.5 is correct to less than a factor of 2 for the CO J= 32 transition and for temperature ranging between 10 and 200K and density from 104 to 106 cm-3.
In the absence of isotopic CO observations for the HARP-B map that could provide means for independently estimating the optical depth, we have assumed two values: = 1, and the optical thin limit ( = 0). Despite the J = 32 CO line in the center is heavily self reversed (see Fig. 2), for the high velocity wings optically thin emission is a reasonable assumption as White et al. (1995) find for the wings of the J = 21 transition a CO/13CO 20. This should be particularly true for J = 32 line wings presented here that are more extended to higher velocities and integrated even further from the body of the line.
We have applied this method summing for all data points enclosed within each of the individual lobes discussed in §§3.2 - 3.4, Outflows were considered within velocity ranges -30 km s-1 VLSR 0 km s-1 for the blue and 18 km s-1 VLSR 48 km s-1 for the red shifted lobes and a velocity step of 1 km s-1 has been used. The summed up CO columns for each lobe are reported in column 2 of Table 2, for the two adopted values of .
The mass per channel Mi can be derived from the column density per channel (eq. 1) given the distance, D and the beam solid angle, :
| (3) |
where = 1.3 is the mean molecular mass and mH is the hydrogen atom mass. In Choi et al. (1993) the abundance ratio is separated into two terms with respect to carbon, and two different cases are taken for the [C]/[CO] ratio: one considering CO in swept-up gas and another one treating CO as an intrinsic jet ingredient. Following Choi et al. (1993), we consider a CO abundance ratio XCO = 5 10-5, under the assumption that the observed outflows are indeed swept-up ambient material. The estimated mass for individual lobes and the total mass for the blue and red high velocity gas considering the two adopted values of are reported in Tables 2 and 3.
4.2 Momentum and Energy
Once the mass per channel is calculated for individual outflows, momentum and kinetic energy of each outflow can be derived from the following relations:
| (4) |
| (5) |
where V0 is the nominal cloud velocity and sums act over velocity channels (i) reported above for the blue and red-shifted lobes. The derived momentum and kinetic energy for each individual outflows are reported in columns 3 and 4 of Table 2. The total mass, momentum and kinetic energy for the high velocity blue and red shifted gas in the Serpens Core are listed in Table 3; in all cases, lower and upper limits reflect the assumption of the two different values for .
The total mass estimates lie between 1.9 and 3.0 10-2 M⊙, for the momentum between 3.25 and 5.1 10-1 M⊙ km s-1 and energy from 4.4-6.9 1043 erg. Total values of these properties for the blue-shifted gas are higher than for the red-shifted emission. In comparison to the global outflow mass, momentum and energy for the CO J = 21 high velocity gas reported in White et al. (1995) and Davis et al. (1999), our estimations are 1-2 orders of magnitude lower. For comparison, integrating over the velocity intervals considered in Davis et al. (1999) ([-4, 4] km s-1 and [14, 22] km s-1 for the blue and red-shifted gas) yields values which are an order of magnitude lower than the ones derived by the CO J = 21. Part of this difference could be due to the fact that the area of 720 560 considered in Davis et al. (1999) is much larger than the area of the present maps (460 230). Indeed, considering the velocity limits used in Graves et al. (2010) ([-15, 6] km s-1 and [10, 30] km s-1 for the blue and red-shifted gas), our estimates are less than a factor of two lower. Also the outflow masses and momenta for individual outflows reported in Table 3 of Graves et al. (2010), are within a factor of two with respect to the ones reported in Table 2; such a difference can be easily due to the different adopted methods for measuring these quantities.
4.3 Momentum Flux and Mechanical Luminosity
The driving force of the underlying stellar wind or jet should correspond to the average force applied to the outflow gas. Its magnitude can be estimated if the momentum of the outflowing gas is divided by the characteristic flow timescale tch:
| (6) |
The characteristic timescale is defined as the maximum projected radius that the flow has covered R, over the mass weighted velocity of the flow vch = P/M, This timescale represents a lower limit as it is not corrected for any possible inclination of the outflow. In addition, most swept up mass in jet-driven shocks is located in the bow wings and moves much more slowly than material in the bow-head; therefore the mass weighted velocity may contribute in underestimating outflow ages (Downes & Cabrit 2007). Thus FCO becomes:
| (7) |
| Mtot | Ptot | EK,tot | |
|---|---|---|---|
| (10-2 ) | 10-1 km s-1) | (1043 erg) | |
| Blue | 1.12 - 1.76 | 1.97 - 3.04 | 2.92 - 4.55 |
| Red | 0.75 - 1.27 | 1.28 - 2.09 | 1.44 - 2.34 |
| Sum | 1.87 - 3.03 | 3.25 - 5.13 | 4.36 - 6.89 |
Inclination of the outflow with respect to the plane of the sky will lead in underestimating the true outflow length and the characteristic velocity. Adjusting for the inclination effects on the observed momentum flux yields:
| (8) |
where i is the angle between the flow axis and the line of sight. As the latter quantity cannot be inferred from the existing data on an individual outflow basis, we have assumed an arbitrary inclination angle i = 45o for all outflows corresponding to an inclination correction factor of 1.41. In a similar manner, the total energy from the jet deposited on the ambient gas can be derived dividing the outflow energy by the characteristic timescale.
| (9) |
The inclination taken into account corresponds to a factor of , which for an angle of 45o results in a correction factor of 2. The derived momentum fluxes and mechanical luminosities for each individual outflow are reported in Table 2.
Results from numerical simulations of outflows (Downes & Cabrit 2007) argue that the characteristic timescale tch as defined above will overestimate the true outflow length, as mass weighted velocities underestimate the true propagation speed of the bow-shock head, which defines its actual length in a jet driven outflow. Other factors such as the role of the transverse momentum and the dissociation of CO molecules at bowshocks may affect to a greater or lesser extent the estimations of momentum flux (for a complete discussion we refer the interested reader to Downes & Cabrit (2007)). However, the derivation of the momentum flux based on the maximum velocity as suggested by Downes & Cabrit (2007) may lead to more uncertain results, since vmax is more affected by the inclination of the outflow. Further more, this method may give misleading results in the presence of high velocity ”bullets”, as it is the case in a number of outflows in the present sample. In the current method for deriving the momentum flux, overestimating the true outflow age is compensated to an extent by the high vmin cutoffs adopted for the outflows; for example, assuming vmin values closer to vLSR by 4 km s-1, the mechanical energy increases by 15 . Characteristic timescales and momentum fluxes for each outflow are reported in Table 2. There are two cases where the characteristic timescale could not be determined; for lobe Bb2, the outflow seems to be almost aligned with the line of sight from the driving source W48, while no possible driving source could be assigned to lobe Cr2 (see §3.4).

There are no studies where CO momentum fluxes are estimated for individual sources in Serpens. However comparison with other studies shows that derived values presented in Table 2 are of the same order of magnitude as the ones in the case of Bontemps et al. (1996) examining a sample of 45 low-luminosity embedded young stellar objects, and 2 orders of magnitude higher in respect to the lower limits inferred by Hatchell et al. (2007a) for a sample of embedded sources in Perseus cloud. There is a factor of 10 implied by the opacity and inclination corrections implemented in the momentum fluxes of Bontemps et al. (1996) that are not taken into account by Hatchell et al. (2007a). Even corrected for this factor, there is a discrepancy of an order of magnitude even for the outflows attributed to the same sources in the two studies, which reflects the high uncertainties in the momentum flux calculations.
Based on the observed CS outflow associated with S68N/SMM9 core, Wolf-Chase et al. (1998) estimated a momentum flux F 2 10 -4 M☉ km s-1 yr-1; this is an order of magnitude higher than the sum of the lobes Ar1 and Ab1, which are attributed to SMM9 in our study. Even though the SMM9 outflow being at the edge of out map is not fully sampled, the value derived by Wolf-Chase et al. (1998) is still high as it corresponds to the total momentum flux for the whole Serpens core in the optically thin limit ( 2.8 - 5 10-4 M☉ km s-1 yr-1). A series of factors including the assumed dynamical timescale along with the low velocity cutoffs (which go much into the body of the CS lines in Wolf-Chase et al. (1998)) may most easily explain this discrepancy. It should also be noted that the relatively high CS abundance employed in Wolf-Chase et al. (1998) is expected to lower the momentum flux (see eq. 3). However, the CS abundance is highly uncertain and thus the comparison between CO and CS derived momentum fluxes is not straightforward. The total momentum flux estimated by Davis et al. (1999) for all the outflows in Serpens, (3 10-4 M☉ km s-1 yr-1) is in good agreement with our measurements. However, in this case, the 10 times higher estimated outflow momentum (see §4.2) in Davis et al. (1999) is compensated by an equally overestimated average characteristic timescale (3 104 yr), due to the low values of the assumed maximum gas velocity and the extended typical length estimated for the outflows.
4.4 Bolometric Luminosity
The spectral energy distribution (SED) of very young, embedded Class0/I sources spans in wavelength a range from the near or mid-IR to mm and cm wavelengths; typically, the observed flux density is low in the near and mid-IR, while it peaks in the far-IR as the reprocessed protostellar flux is emitted by the massive surrounding envelope, falling back to lower values at longer wavelengths (Enoch et al. 2008).
Estimations of the bolometric luminosity for the very young protostars in the Serpens core differ substantially in diverse studies (Casali et al. 1993; Hurt & Barsony 1996; Larsson et al. 2000). In particular, the large beams of the mid and far-IR facilities deployed (e.g. IRAS; Hurt & Barsony (1996) and ISO; Larsson et al. (2000)), do not posses enough spatial resolving power to resolve the emissions from the highly clustered YSOs in the Serpens core. This leads to overestimated SED peak values for very young protostars and consequently to higher bolometric luminosities. Indeed, recent calculations based on Spitzer far-IR data which have an improved spatial resolution (Enoch et al. 2008), find Lbol values up to an order of magnitude lower than previous studies.
| Source | L | MCO | F | L | Lsmm/Lbol |
|---|---|---|---|---|---|
| (L☉) | (10-3 M☉) | (10-5 km s-1 yr-1) | (10-2 L☉) | (10-2) | |
| SMM1 | 7.7 2.4 | 6.45 1.45 | 6.48 3.24 | 12.96 2.92 | 4.4 0.9 |
| SMM3 | 1.05 0.5 | 1.33 0.3 | 3.04 1.23 | 4.42 1.0 | 5.8 1.1 |
| SMM4 | 0.25 0.05 | 3.2 0.72 | 9.03 2.01 | 12.24 2,74 | 4.8 0.8 |
| SMM5 | 1.62 0.22 | 0.89 0.19 | 0.47 0.11 | 0.46 0.1 | 0.3 0.1 |
| SMM6 | 13.54 0.8 | 1.52 0.34 | 6.71 1.5 | 13.84 3.12 | 0.2 0.1 |
| SMM8 | 0.068 | 1.72 0.38 | 1.41 0.29 | 1.4 0.3 | |
| SMM9 | 1.73 0.3 | 1.26 0.29 | 4.43 1.28 | 5.34 1.22 | 5.8 0.7 |
| W45 | 0.027 | 1.78 0.40 | 1.95 0.26 | 1.84 0.42 | |
| W10 | 2.10 0.1 | 2.17 0.49 | 1.49 0.33 | 1.26 0.28 | |
| S68Nb | 0.47 | 0.95 0.35 | 0.55 0.12 | 0.46 0.1 | 0.2 0.1 |
Here, we estimate bolometric luminosities for the sources that are likely to be responsible for the observed outflow activity, compiling data extending from the mid and far-IR (Winston et al. 2007; Harvey et al. 2007), 450 and 850 m in the sub-millimeter (Davis et al. 1999), 1.1 and 3 millimeter Enoch et al. (2007) andWilliams & Myers (2000) to 3.5 cm Eiroa et al. (2005) observations of the Serpens core. The Spitzer mid and far-IR photometry reported in the two independent studies of Winston et al. (2007) and Harvey et al. (2007) are in good agreement except for the 70 m MIPS band, where values reported by Harvey et al. (2007) are always higher by a factor between 2 and 3. As the bulk of the derived bolometric luminosity rises from the area where flux density peaks (i.e. the far-IR for Class 0 sources), the 70 m flux has a dominant role. We therefore estimate upper and lower Lbol limits, taking into account the two independent Spitzer datasets. Spectral energy distribution diagrams for the Winston et al. (2007) catalogue sources exhibiting 70 m emission along with flux densities estimated in Harvey et al. (2007) are presented in Figure 9.
Flux density in the SEDs is sampled over a wide range of wavelengths with a small collection of data points; before integrating, we use a simple linear interpolation method similar to the ”mid-point” method employed by Enoch et al. (2008). However, while in the ”mid-point” method a single interpolant is used, in our calculations instead, interpolants are introduced over a constant wavelength step of 5 m. Upper and lower limit bolometric luminosities obtained with this method for the adopted distance of 310 pc are reported Table 4.
The derived bolometric luminosities are in good agreement with the ones reported in Enoch et al. (2008), despite the different assumptions and methods. Lbol upper and lower limits in Enoch et al. (2008) are estimated by means of two different integration methods (see Appendix A in Enoch et al. (2008)) considering only the c2d survey dataset of Harvey et al. (2007) and assuming a 260 pc distance to Serpens. It should be noted however that peak fluxes are interpolated over in the ”mid-point” method, and therefore the dominant influence of the 70 m band is lost. Thus in principle, bolometric luminosities estimated here and in the case of Enoch et al. (2008) should differ by a factor of (310)2/(260)2 1.4 due to the different adopted distances. Thorough tests on the same dataset of the two integration methods have shown that the predicted bolometric luminosities depend strongly on the number of interpolants between the observed points, and the estimated values are lower by a factor of 1.5 compared to the single interpolant adopted by Enoch et al. (2008), canceling the difference in the adopted distances.
In Table 4 we also report the ratio of the submillimeter ( 350 m) to the bolometric luminosity, for the sources having enough observed sub-millimeter and millimeter data points . This ratio being greater than 0.5 is indicative of the envelope mass exceeding the central stellar mass, therefore distinguishing between Class 0 and more evolved protostars (Andre et al. 1993). Associated errors are estimated considering the different values reported in the two mid/far IR studies with Spitzer (Winston et al. 2007; Harvey et al. 2007). Four protostellar sources, namely SMM1, SMM3 SMM4 and SMM9 fulfill this criterion and therefore are candidate Class 0 protostars in Serpens. We stress out however that this ratio is dependent on the physical and observed properties of a particular source such as the inclination of outflow cavity with respect to the line-of-sight, therefore it only may provide indications and not constraints on the evolutionary stage of a protostellar source.
5 Discussion
5.1 Outflow Momentum Flux and Mechanical Luminosity versus Bolometric Luminosity relations
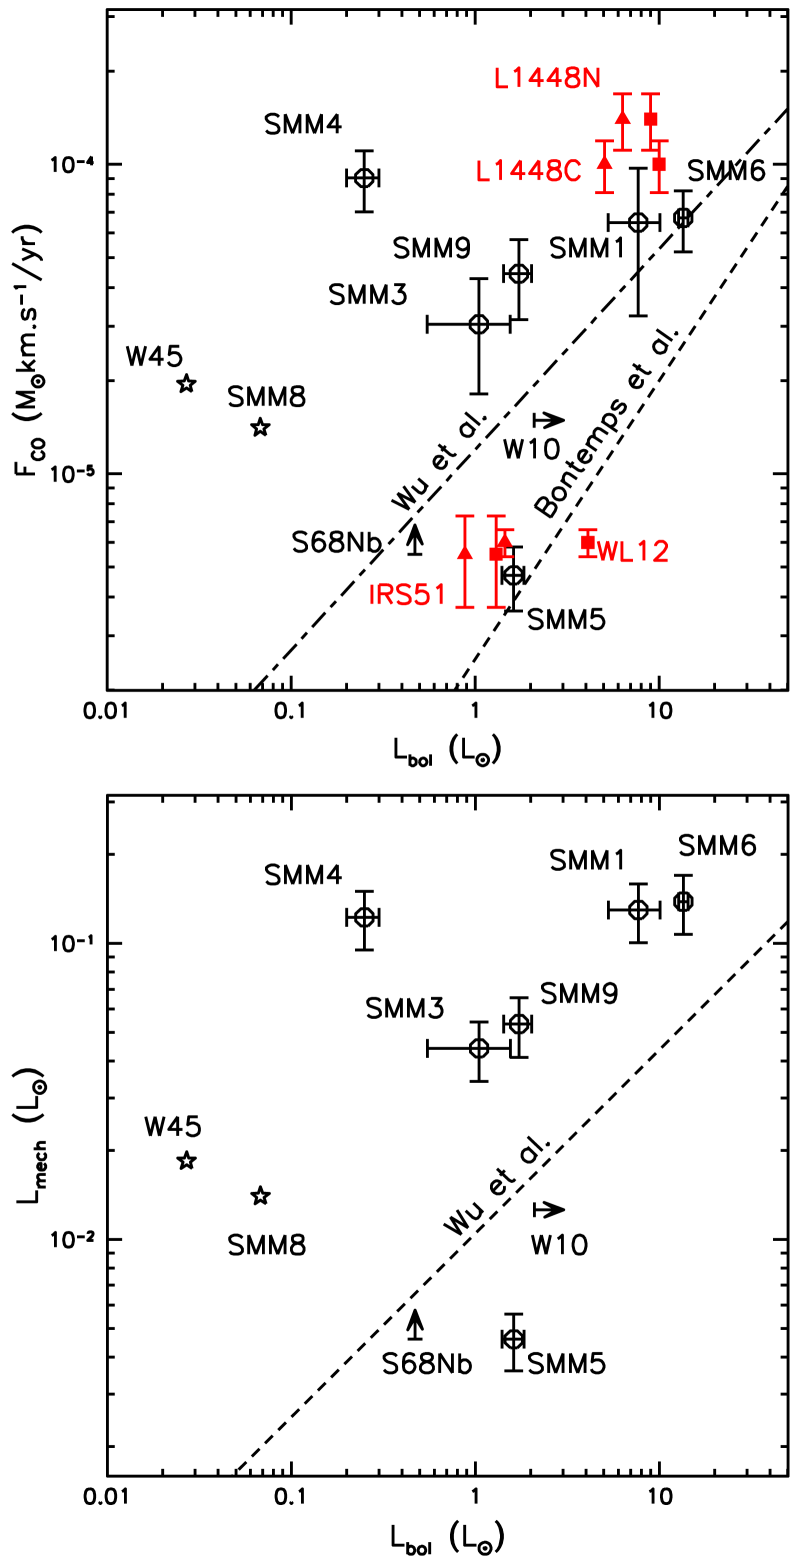
We examine the well known correlation between momentum flux and bolometric luminosity that has been proposed by (Cabrit & Bertout 1992) and Bontemps et al. (1996) for the homogenous sample of young protostellar objects in the Serpens Core. The outflow momentum flux FCO is plotted against the bolometric luminosity Lbol in the upper panel of Figure 10. Empty circles correspond to Serpens sources with associated outflows that both quantities could be determined, with error bars displaying the corresponding uncertainties discussed n the previous sections. Arrows and asterisks correspond to sources/outflows that either FCO, Lbol or both are uncertain. The dashed and dot-dashed lines display the location for the Class I correlation of Bontemps et al. (1996) and the relation for a sample of both low and high mass protostellar sources of (Wu et al. 2004).
All protostellar sources found to have a high submillimeter to bolometric luminosity ratios stand well above of both Bontemps et al. (1996) and (Wu et al. 2004) correlations. In addition, Class 0 and I sources are distributed above and below the Wu et al. (2004) correlation, which derived for a large sample of both low and high mass protostars. The placement of Class 0 sources confirms the soundness of our estimations, as the (Wu et al. 2004) relation is strongly affected by high mass protostars, which are expected to have short evolutionary times and therefore are expected to be older than the low mass Class 0 protostars.
While the sample of Class I sources is not large enough to drive statistically significant conclusions, it appears that Class I sources are shifted to lower luminosities with respect to what is predicted from the correlation of Bontemps et al. (1996). This shift should not come as a surprise, since bolometric luminosities reported in this work and in Enoch et al. (2008) are up to a factor of 10 lower than previous estimations (Casali et al. 1993; Hurt & Barsony 1996; Larsson et al. 2000), this difference being attributed to the better spatial resolution of Spitzer.
In order to explore the effect of the updated bolometric luminosities on the Class I correlation, we have selected four additional sources from the Bontemps et al. (1996) sample, since the latter contains no sources belonging to Serpens that could be used for direct comparison. From these, L1448C and N are bona-fide Class 0 protostars in Perseus and their SEDs were determined using Spitzer photometry (Jørgensen et al. 2006; Rebull et al. 2007) and (sub)-mm observations (Hatchell et al. 2007b; Enoch et al. 2006). The other two (IRS51 and WL12), are characterized as Class I sources (Bontemps et al. 1996) located in Ophiuchus, and for their SEDs we have compiled observations from Spitzer (c2d database, Evans et al. 2003; Padgett et al. 2008), and (sub)-mm (Johnstone et al. 2000; Stanke et al. 2006). In Figure 10, data points for these four sources as originally reported in Bontemps et al. (1996) (filled squares) are brighter by a factor between 2 and 3 than the bolometric luminosities based on Spitzer data (filled triangles). Despite this shift, Class I sources IRS51 and WL12 are roughly in the same part of the diagram with Class I candidates from the Serpens sample; the corresponding shift for the Class 0 sources places them even further from the Class I correlation, so that a decline in momentum flux from the Class 0 to the Class I phase is preserved. In another, uniform sample survey of Perseus, Hatchell et al. (2007a) found a less clear separation for the two classes; however, in for the Serpens sample, all confirmed Class 0 sources seem to be standing well off the Class I group. With the exception of SMM4, all SMM1, 3, and 9 together with Perseus Class 0 sources seem to be well aligned indicating higher CO thrust than the Class I case (an order of magnitude for Lbol = 1 L⊙). Hints of a possible alignment between these Class 0 sources exists, however a larger sample of protostellar sources would be necessary to confirm it. To this direction, the HARP-B CO J = 32 maps of Perseus (Hatchell & Dunham 2009) along with the existing Spitzer and (sub)-mm surveys of the region combined with the present data would be an ideal dataset for probing this possibility.
Extending the investigation of the relations between outflows and the driving sources in Serpens, in the lower panel of Fig. 10 we plot the mechanical luminosity (Lmech) of the outflows versus the bolometric luminosity (Lbol) of the corresponding protostellar sources. The dashed line shows the corresponding correlation of Wu et al. (2004) comprising both low and high mass protostars. The distribution of data points is similar to the FCO vs Lbol in the upper panel of the same Figure and is consistent with the data distribution of Wu et al. (2004). Similarly, Class 0 sources stand well above the Wu et al. (2004) correlation; this is not unexpected, as the Wu et al. (2004) correlation is derived for a large sample of sources spanning different masses and ages. Despite the sample is limited, it appears that sources with high bolometric luminosities tend to produce outflows with relatively lower mechanical luminosity in respect with the sources having lower bolometric luminosities; a similar behavior may be also observed in the sample of (Wu et al. 2004).
6 Summary and Conclusions
We have carried out CO J = 32 observations of the Serpens Cloud Core with the HARP-B detector on JCMT, covering an area of 460230. These higher J CO observations along with the higher sensitivity of the HARP-B have allowed to sharply delineate the outflow activity in Serpens, a fact that has enabled to a greater extent than before the association of individual outflows with protostellar sources. Such associations were aided by comparing with other jet/outflow tracers, performed in other studies in the literature, and have resulted in associating most observed outflows to 10 protostellar sources. The projected orientation on the plane of the sky for the majority of the outflows, displays a preferable NW-SE direction. This orientation is roughly parallel to the local galactic magnetic field as predicted by magnetically controlled could collapse models. For individual outflows, deduced column densities, masses as well as kinematical and dynamical properties are in good agreement with previous studies. However, estimated bolometric luminosities based on Spitzer mid and far-IR observations are lower up to a factor of 10 than previous estimations based on IRAS/ISO data. This difference is reflected as a possible shift in the FCO vs Lbol Class I correlation of (Bontemps et al. 1996) to lower luminosities. Still, the distribution of Class I sources remains well separated from the one of Class 0 protostars. Indications for an independent FCO - Lbol correlation for the latter sources exist in the present sample, however its limited extent is not sufficient to drive secure conclusions.
Acknowledgements.
This work is based on observations made with the James Clerk Maxwell Telescope, operated by the Joint Astronomy Centre on behalf of the Science and Technology Facilities Council of the U.K., and was supported in part by the European Community’s Marie Curie Actions - Human Resource and Mobility within the JETSET (Jet Simulations, Experiments and Theory) network under contract MRTN-CT-2004 05592. The Centre for Star and Planet Formation is funded by the Danish National Research Foundation and the University of Copenhagen’s programme of excellence.References
- Andre et al. (1993) Andre, P., Ward-Thompson, D., & Barsony, M. 1993, ApJ, 406, 122
- Bachiller et al. (1991) Bachiller, R., Martin-Pintado, J., & Fuente, A. 1991, A&A, 243, L21
- Bontemps et al. (1996) Bontemps, S., Andre, P., Terebey, S., & Cabrit, S. 1996, A&A, 311, 858
- Cabrit & Bertout (1990) Cabrit, S. & Bertout, C. 1990, ApJ, 348, 530
- Cabrit & Bertout (1992) Cabrit, S. & Bertout, C. 1992, A&A, 261, 274
- Cambrésy (1999) Cambrésy, L. 1999, A&A, 345, 965
- Casali et al. (1993) Casali, M. M., Eiroa, C., & Duncan, W. D. 1993, A&A, 275, 195
- Choi et al. (1993) Choi, M., Evans, II, N. J., & Jaffe, D. T. 1993, ApJ, 417, 624
- Curiel et al. (1993) Curiel, S., Rodriguez, L. F., Moran, J. M., & Canto, J. 1993, ApJ, 415, 191
- Davis et al. (1999) Davis, C. J., Matthews, H. E., Ray, T. P., Dent, W. R. F., & Richer, J. S. 1999, MNRAS, 309, 141
- de Lara et al. (1991) de Lara, E., Chavarria-K., C., & Lopez-Molina, G. 1991, A&A, 243, 139
- Dent et al. (2000) Dent, W., Duncan, W., Ellis, M., et al. 2000, in Astronomical Society of the Pacific Conference Series, Vol. 217, Imaging at Radio through Submillimeter Wavelengths, ed. J. G. Mangum & S. J. E. Radford, 33–+
- Downes & Cabrit (2007) Downes, T. P. & Cabrit, S. 2007, A&A, 471, 873
- Eiroa & Casali (1992) Eiroa, C. & Casali, M. M. 1992, A&A, 262, 468
- Eiroa et al. (1997) Eiroa, C., Palacios, J., Eisloffel, J., Casali, M. M., & Curiel, S. 1997, in IAU Symposium, Vol. 182, Herbig-Haro Flows and the Birth of Stars, ed. B. Reipurth & C. Bertout, 103P–+
- Eiroa et al. (2005) Eiroa, C., Torrelles, J. M., Curiel, S., & Djupvik, A. A. 2005, AJ, 130, 643
- Enoch et al. (2008) Enoch, M. L., Evans, II, N. J., Sargent, A. I., & Glenn, J. 2008, ArXiv e-prints
- Enoch et al. (2007) Enoch, M. L., Glenn, J., Evans, II, N. J., et al. 2007, ApJ, 666, 982
- Enoch et al. (2006) Enoch, M. L., Young, K. E., Glenn, J., et al. 2006, ApJ, 638, 293
- Evans et al. (2003) Evans, II, N. J., Allen, L. E., Blake, G. A., et al. 2003, PASP, 115, 965
- Fuller & Ladd (2002) Fuller, G. A. & Ladd, E. F. 2002, ApJ, 573, 699
- Garay et al. (2002) Garay, G., Mardones, D., Rodríguez, L. F., Caselli, P., & Bourke, T. L. 2002, ApJ, 567, 980
- Giovannetti et al. (1998) Giovannetti, P., Caux, E., Nadeau, D., & Monin, J.-L. 1998, A&A, 330, 990
- Gomez de Castro et al. (1988) Gomez de Castro, A. I., Eiroa, C., & Lenzen, R. 1988, A&A, 201, 299
- Graves et al. (2010) Graves, S. F., Richer, J. S., Buckle, J. V., et al. 2010, ArXiv e-prints
- Gregersen et al. (1997) Gregersen, E. M., Evans, II, N. J., Zhou, S., & Choi, M. 1997, ApJ, 484, 256
- Haisch et al. (2002) Haisch, Jr., K. E., Barsony, M., Greene, T. P., & Ressler, M. E. 2002, AJ, 124, 2841
- Harvey et al. (2007) Harvey, P., Merín, B., Huard, T. L., et al. 2007, ApJ, 663, 1149
- Hatchell & Dunham (2009) Hatchell, J. & Dunham, M. M. 2009, ArXiv e-prints
- Hatchell et al. (2007a) Hatchell, J., Fuller, G. A., & Richer, J. S. 2007a, A&A, 472, 187
- Hatchell et al. (2007b) Hatchell, J., Fuller, G. A., Richer, J. S., Harries, T. J., & Ladd, E. F. 2007b, A&A, 468, 1009
- Herbst et al. (1997) Herbst, T. M., Beckwith, S. V. W., & Robberto, M. 1997, ApJ, 486, L59+
- Hodapp (1999) Hodapp, K. W. 1999, AJ, 118, 1338
- Hogerheijde et al. (1999) Hogerheijde, M. R., van Dishoeck, E. F., Salverda, J. M., & Blake, G. A. 1999, ApJ, 513, 350
- Huard et al. (1997) Huard, T. L., Weintraub, D. A., & Kastner, J. H. 1997, MNRAS, 290, 598
- Hurt & Barsony (1996) Hurt, R. L. & Barsony, M. 1996, ApJ, 460, L45+
- Johnstone et al. (2000) Johnstone, D., Wilson, C. D., Moriarty-Schieven, G., et al. 2000, ApJ, 545, 327
- Jørgensen et al. (2006) Jørgensen, J. K., Harvey, P. M., Evans, II, N. J., et al. 2006, ApJ, 645, 1246
- Kaas (1999) Kaas, A. A. 1999, AJ, 118, 558
- Kaas et al. (2004) Kaas, A. A., Olofsson, G., Bontemps, S., et al. 2004, A&A, 421, 623
- Larsson et al. (2000) Larsson, B., Liseau, R., Men’shchikov, A. B., et al. 2000, A&A, 363, 253
- Lightfoot et al. (2000) Lightfoot, J. F., Dent, W. R. F., Willis, A. G., & Hovey, G. J. 2000, in Astronomical Society of the Pacific Conference Series, Vol. 216, Astronomical Data Analysis Software and Systems IX, ed. N. Manset, C. Veillet, & D. Crabtree, 502–+
- Mangum et al. (1996) Mangum, J. G., Latter, W. B., & McMullin, J. P. 1996, in IAU Symposium, Vol. 170, CO: Twenty-Five Years of Millimeter-Wave Spectroscopy, ed. W. B. Latter, J. E. Radford Simon, P. R. Jewell, J. G. Mangum, & J. Bally, 76P–+
- Narayanan et al. (2002) Narayanan, G., Moriarty-Schieven, G., Walker, C. K., & Butner, H. M. 2002, ApJ, 565, 319
- Padgett et al. (2008) Padgett, D. L., Rebull, L. M., Stapelfeldt, K. R., et al. 2008, ApJ, 672, 1013
- Rebull et al. (2007) Rebull, L. M., Stapelfeldt, K. R., Evans, II, N. J., et al. 2007, ApJS, 171, 447
- Reipurth & Eiroa (1992) Reipurth, B. & Eiroa, C. 1992, A&A, 256, L1
- Richer et al. (2000) Richer, J. S., Shepherd, D. S., Cabrit, S., Bachiller, R., & Churchwell, E. 2000, Protostars and Planets IV, 867
- Rodriguez et al. (1989) Rodriguez, L. F., Curiel, S., Moran, J. M., et al. 1989, ApJ, 346, L85
- Smith et al. (2008) Smith, H., Buckle, J., Hills, R., et al. 2008, in Presented at the Society of Photo-Optical Instrumentation Engineers (SPIE) Conference, Vol. 7020, Society of Photo-Optical Instrumentation Engineers (SPIE) Conference Series
- Stanke et al. (2006) Stanke, T., Smith, M. D., Gredel, R., & Khanzadyan, T. 2006, A&A, 447, 609
- Strom et al. (1976) Strom, S. E., Vrba, F. J., & Strom, K. M. 1976, AJ, 81, 638
- Sugitani et al. (2010) Sugitani, K., Nakamura, F., Tamura, M., et al. 2010, ApJ, 716, 299
- Testi & Sargent (1998) Testi, L. & Sargent, A. I. 1998, ApJ, 508, L91
- Testi et al. (2000) Testi, L., Sargent, A. I., Olmi, L., & Onello, J. S. 2000, ApJ, 540, L53
- Torrelles et al. (1992) Torrelles, J. M., Gómez, J. F., Curiel, S., et al. 1992, ApJ, 384, L59
- White et al. (1995) White, G. J., Casali, M. M., & Eiroa, C. 1995, A&A, 298, 594
- Williams & Myers (2000) Williams, J. P. & Myers, P. C. 2000, ApJ, 537, 891
- Winston et al. (2007) Winston, E., Megeath, S. T., Wolk, S. J., et al. 2007, ApJ, 669, 493
- Wolf-Chase et al. (1998) Wolf-Chase, G. A., Barsony, M., Wootten, H. A., et al. 1998, ApJ, 501, L193+
- Wu et al. (2004) Wu, Y., Wei, Y., Zhao, M., et al. 2004, A&A, 426, 503
- Ziener & Eislöffel (1999) Ziener, R. & Eislöffel, J. 1999, A&A, 347, 565