Re-capturing cosmic information
Abstract
Gravitational lensing of distant galaxies can be exploited to infer the convergence field as a function of angular position on the sky. The statistics of this field, much like that of the cosmic microwave background (CMB), can be studied to extract information about fundamental parameters in cosmology, most notably the dark energy in the Universe. Unlike the CMB, the distribution of matter in the Universe which determines the convergence field is highly non-Gaussian, reflecting the nonlinear processes which accompanied structure formation. Much of the cosmic information contained in the initial field is therefore unavailable to the standard power spectrum measurements. Here we propose a method for re-capturing cosmic information by using the power spectrum of a simple function of the observed (nonlinear) convergence field. We adapt the approach of Neyrinck et al. (2009) to lensing by using a modified logarithmic transform of the convergence field. The Fourier transform of the log-transformed field has modes that are nearly uncorrelated, which allows for additional cosmological information to be extracted from small-scale modes.
I Introduction
Gravitational lensing has emerged as a powerful tool to probe the distribution of matter in the Universe Bartelmann and Schneider (2001). Observations of the ellipticities of background galaxies can be transformed into estimates of the convergence field . Along a given line of sight , the convergence measures a weighted integral of the total mass density field. Thus by carefully studying as a function of position on the sky, we can learn about the underlying density field directly, without relying on the traditional assumption that every galaxy corresponds to an overdense region.
By measuring the convergence to sources at multiple background redshifts, cosmologists can infer not only the density field as a function of 2D position Kaiser (1992); Blandford et al. (1991); Jain and Seljak (1997); Jain et al. (2000), but also the evolution of this density field with time Hu (1999). This information will be particularly valuable as a tool to study both dark matter and dark energy, which affect the growth of structure in the Universe Huterer (2002); Hu (2002). A number of wide-area surveys have been planned with the goal of mapping out the cosmic convergence field, and ultimately measuring properties of the dark energy Aldering (2005); Miyazaki et al. (2006); Tyson (2006); Abbott et al. (2005); Refregier and the DUNE collaboration (2009).
This goal appears attainable as it is reminiscent of another cosmological success story: measurement of anisotropies in the CMB Hu and Dodelson (2002). In both cases, the values of the measured quantities – temperature in the case of the CMB and convergence from lensing – at any particular spot on the sky are not important. Rather, it is the statistics of the field that carries all the important information. The two-point function of the temperature of the CMB, the power spectrum of the anisotropies, is sensitive to a number of cosmological parameters, and some of these have now been measured to percent level accuracy Komatsu et al. (2010). Similarly, the power spectrum of the convergence depends on cosmological parameters, and one can hope to extract information about these parameters from lensing surveys Hu and Tegmark (1999); Abazajian and Dodelson (2003); Refregier et al. (2004); Hoekstra and Jain (2008).
However the convergence field differs in an important way from the anisotropy maps. CMB anisotropies provide a snapshot of the Universe when it was very young, and hence all deviations from homogeneity are very small (temperature differences in the maps are of order several parts in a hundred thousand). The physics describing these perturbations is linear. Further, the perturbations were drawn from a Gaussian distribution, so the two-point function captures all of the information in the field. On the other hand, the cosmic density field today is non-linear and non-Gaussian, increasingly so on smaller scales, so some of the information initially stored in the two-point function when the fields were linear is no longer present.
Before quantifying this notion that information has left the two-point function, it is worthwhile to review some approaches to this problem. Takada & Jain Takada and Jain (2004) pointed out that including information from both the two- and three-point functions significantly reduces the errors on cosmological parameters. This makes intuitive sense: the nonlinear process of gravitational instability transforms the initially Gaussian field into one with appreciable non-Gaussianity, one hallmark of which is a non-zero skewness. The goal of measuring both sets of functions may work, but it suffers from the drawback of requiring non-trivial covariance matrices (which involve the challenge of computing five- and six-point functions) Takada and Jain (2009).
A series of papers devoted to the 3D density field Rimes and Hamilton (2005, 2006); Neyrinck and Szapudi (2007); Neyrinck et al. (2006, 2009) have noted that information in the power spectrum of saturates at high wavenumbers (or small length scales). That is, the power spectrum at high- is highly correlated, apparently due to the coupling of modes induced by nonlinear gravitational clustering. The most recent of these papers offered a useful proposal Neyrinck et al. (2009) for re-capturing information about the 3D density field by pointing out that has properties similar to the initial, linear density field. Its probability distribution is close to a Gaussian, the broadband shape is close to that of the linear power spectrum, and finally, the information content is close to the Gaussian case. Practically this transform may be of limited utility because the 3D density field is typically estimated by using galaxies as tracers, and it is unlikely that the log transform of the galaxy density will be a useful tracer of the linear matter density field. However, we now show that the log transform can be applied to the 2D lensing convergence field to de-correlate modes and obtain information from higher-order correlations back in the two-point function.
II Log-mapping for lensing
Using simulations, we study the statistics of a new field:
| (1) |
where is a constant with a value slightly larger than the absolute value of the minimum value of in the survey – this keeps the argument of the logarithm positive. In the limit of small , reduces to the standard convergence, but the log alters it in very high or low density regimes. The parameter tunes the degree of the alteration: the smaller , the more we alter the field111For our fiducial maps with 0.15 arcmin pixel scale, we use based on the minimum value of measured . . The log-mapping described above is motivated by our goal to de-correlate the Fourier modes of the convergence field. Although the mapping is local on the sky, it is nonlinear, so in Fourier space it has the potential to undo some of the correlations introduced by nonlinear clustering.
To study the properties of , we use a suite of numerical simulations: 100 convergence fields, each (a total of 2500 square degrees) with pixels (i.e., 0.15 arcmin per pixel) were generated using N-body simulations as described in Sato et al. (2009). All source galaxies are taken to be at redshift for all the results shown below, though we have also checked other source redshifts.
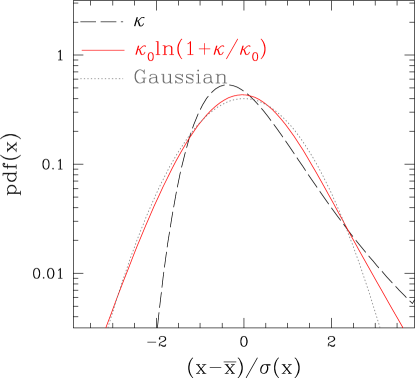
A first glimpse into the advantages of the log transform can be seen from Fig. 1 which shows the probability distribution function (PDF) of both and , compared to the (linear) Gaussian PDF. The new field is much closer to Gaussian, a promising sign since the loss of information in is attributed to gravity transforming the initially Gaussian random field into one that is highly non-Gaussian.
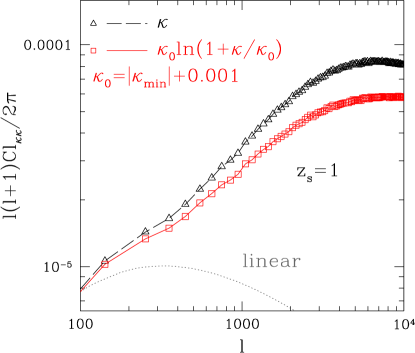
To evaluate the log transform quantitatively, we take the Fourier transform of the three different convergence fields (linear, , and ) in each of the simulations. The angular power spectrum is estimated from the Fourier transforms (denoted ) by summing over all modes with wavenumber in a given bin .
Fig. 2 shows these spectra. As expected, the power spectrum of the nonlinear field is much larger than the linear field on small scales (large ). This excess power on small scales is suppressed when is used. Again the result is not surprising, as the high density regions are smoothed out: for large .
III Recovery of cosmological information
Although the power spectrum of is smaller than that of , it contains more cosmological information. To see this, consider a model with one free parameter, the amplitude of the observed, nonlinear power spectrum before and after the log transform. The projected fractional error on this parameter is the inverse of the signal to noise defined as
| (2) |
where is the power spectrum of multipole before and after the transform, is the covariance matrix describing correlations between the power spectra of multipoles and (), and the summation runs over all the multipoles and subject to Sato et al. (2009); Takahashi et al. (2009). We follow Neyrinck et al. (2009) and call the square of the ratio the information content. Heuristically, then, “information” quantifies how accurately parameters will be determined. To compute the expected error on the chosen cosmological parameter (here the amplitude of the power spectrum Lee and Pen (2008)), one needs to know the covariance matrix of the spectra. If the field was Gaussian random, the covariance matrix would be diagonal. In the absence of shape noise222The ellipticity of a single galaxy is, in the absence of any distortion by the intervening density field, randomly distributed on the sky with an RMS of about 0.3. This corresponds to noise in the measurement of the cosmic convergence field, a noise which decreases as the square root of the number of galaxies in a pixel. The resulting noise is called shape noise., it would be arise from sample variance and be equal to the spectrum squared divided by the number of independent modes in the bin. In that case, since the number of modes in a bin grows as for log binning, the would grow as .
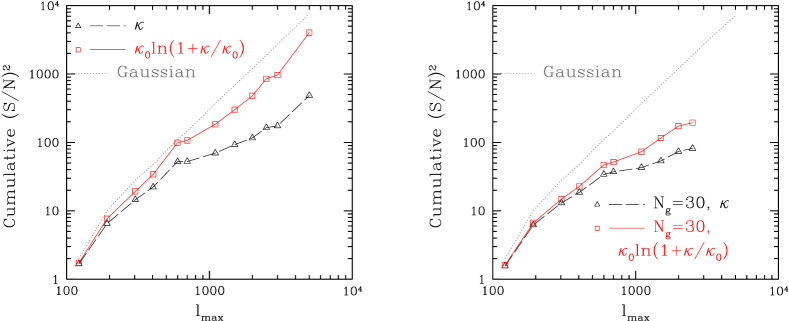
Fig. 3 shows the as a function of . The linear field is shown by the dotted gray line. The information obtained from the nonlinear field falls well below this ideal limit, as seen in the figure. This arises because the nonlinearities significantly affect the covariance matrix. Non-zero off-diagonal elements in the covariance matrix mean that many of the modes carry redundant information, so the total gain is significantly below the Gaussian limit. The log transform undoes a large portion of this damage. The left panel of Fig. 3 shows that the information in is well above that in and close to the Gaussian case. In other words, we measure the amplitude of the power spectrum with higher precision if we use the log-transformed field. We find a factor of improvement in at , a factor of at , a factor of 4 at , and a factor of 8 at .
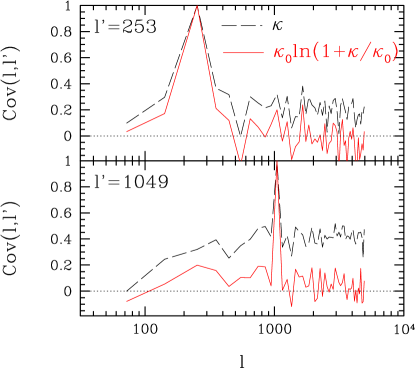
The restored information in the field can be understood by examining the covariance matrix of the power spectra. Fig. 4 shows two rows of the covariance matrix for the fields, with one of the wavenumbers fixed at and in the two cases (upper and lower panel). The covariance matrix has large off-diagonal elements in adjacent bins – these carry redundant information and therefore do not add much to the . The transformed , on the other hand, is much more nearly diagonal. A nearly diagonal covariance matrix implies another important advantage of the log transform: the approximation of a Gaussian covariance matrix for cosmological parameter estimation is more accurate for .
Another way of understanding the gain in information in the log field is to consider the Taylor expansion of the log transform . For , one sees that contains the standard convergence field, but also a piece that scales as (and higher orders). Considered perturbatively, then, the spectrum of will depend not only on the 2-point function of , , but also on the 3-point function, the bispectrum, as well as higher-point functions. Effectively, then this rather simple transform captures information in the power spectrum, bi-spectrum, tri-spectrum, etc. in a compact way. Of course, it does not contain all the information in these higher point functions, but the improvement seen in Fig. 3 suggests that using as a transform in future surveys may be a simple, powerful way to bundle much of this information into one simple spectrum. We have tested this by measuring the information contained in and found that, once we apply an appropriate cutoff333We remove the high values by replacing larger than 0.1 with 0.1. on high values to make the polynomial expansion more sensible, the single extra term replicates most of the improvement observed in the log transform. Meanwhile the cross-correlation of the and which involves only up to bispectrum, with an appropriate cutoff, replicates most of the improvement up to . This implies that the bispectrum is the dominant contributor to this improvement up to the scales.
There are several caveats to this analysis. So far, we have neglected noise, in particular shape noise due to the random orientations of galaxies on the sky. We have studied this issue for several survey parameters. Surveys with higher number density have lower shape noise and therefore the advantages of approach those depicted in the left panel of Fig. 3. For a galaxy number density of 30 per square arcminutes at , as expected for the planned Subaru Hyper SuprimeCam survey Miyazaki et al. (2006), we find an improvement of 1.7 (2.4) in the information content for (2000) (right panel in Fig. 3). The gain is larger for more ambitious surveys like LSST or DUNE Tyson (2006); Refregier and the DUNE collaboration (2009) and smaller for shallower surveys like the Dark Energy Survey Abbott et al. (2005).
Second, although has some of the advantages of the linear field, it does not actually recover the initial field phase by phase since the cross-correlation between the initial and final fields, when tested for the density fields, does not improve by this transformation. Third, our analysis (and our definition of information) revolved around only one parameter, the amplitude of the power spectrum. Its shape and evolution certainly contain additional cosmological information, as discussed by Takada and Jain (2009). Finally, we have assumed that the convergence field, reconstructed from the shear, will be available over the entire survey area – in practice such a reconstruction adds additional noise. We are in the process of studying these issues, but they are not expected to affects our main point: that the log transform recovers cosmological information.
IV Conclusion
We have found that the log transform of Eq. (1) alters the nonlinear convergence field to one that mimics the properties of a Gaussian field. It returns a PDF that is close to a Gaussian – analogous to the findings of Neyrinck et al. (2009) for the 3D density field. The signal-to-noise (i.e., precision) of the measurement of the amplitude of the power spectrum is greatly improved over a wide range of angular scales, . Even in the presence of shape noise, this improvement holds, to a greater or lesser extent depending on the galaxy number density. The improvement arises from the effect on the covariance matrix: the off-diagonal elements of the covariance matrix are substantially reduced for the log transform. We find that the bispectrum that is embedded in the log transform is the dominant contributor to this improvement. Therefore the log transform appears to bundle much of the information from higher order statistics into the power spectrum.
Upcoming imaging surveys will collect data on the shapes of galaxies at an unprecedented rate, with an eye towards understanding the physics which drives the acceleration of the Universe. It is imperative that we use algorithms to analyze this data which extract as much of the cosmological information as possible: the log transform is a step in this direction.
Acknowledgement: We would like to thank David Johnston, Nick Gnedin, Mark Neyrinck and Alex Szalay for useful comments.
This work is supported in part by World Premier International Research Center Initiative (WPI Initiative), by Grant-in-Aid for Scientific Research on Priority Areas No. 467 “Probing the Dark Energy through an Extremely Wide and Deep Survey with Subaru Telescope”, MEXT, Japan, by the JSPS Research Fellows, by the DOE at Fermilab through grant DE-FG02-95ER40896, and by NSF Grants AST-0908072 and AST-0607667.
References
- Bartelmann and Schneider (2001) M. Bartelmann and P. Schneider, Phys. Rept. 340, 291 (2001), eprint astro-ph/9912508.
- Kaiser (1992) N. Kaiser, Astrophys. J. 388, 272 (1992).
- Blandford et al. (1991) R. D. Blandford, A. B. Saust, T. G. Brainerd, and J. V. Villumsen, Mon. Not. Roy. Astron. Soc. 251, 600 (1991).
- Jain and Seljak (1997) B. Jain and U. Seljak, Astrophys. J. 484, 560 (1997), eprint astro-ph/9611077.
- Jain et al. (2000) B. Jain, U. Seljak, and S. D. M. White, Astrophys. J. 530, 547 (2000), eprint astro-ph/9901191.
- Hu (1999) W. Hu, Astrophys. J. 522, L21 (1999), eprint astro-ph/9904153.
- Huterer (2002) D. Huterer, Phys. Rev. D 65, 063001 (2002), eprint astro-ph/0106399.
- Hu (2002) W. Hu, Phys. Rev. D 65, 023003 (2002), eprint astro-ph/0108090.
- Aldering (2005) G. Aldering, New Astron. Rev. 49, 346 (2005), eprint astro-ph/0507426.
- Miyazaki et al. (2006) S. Miyazaki, Y. Komiyama, H. Nakaya, Y. Doi, H. Furusawa, P. Gillingham, Y. Kamata, K. Takeshi, and K. Nariai, in Society of Photo-Optical Instrumentation Engineers (SPIE) Conference Series (2006), vol. 6269 of Society of Photo-Optical Instrumentation Engineers (SPIE) Conference Series.
- Tyson (2006) J. A. Tyson (LSST), AIP Conf. Proc. 870, 44 (2006), eprint astro-ph/0609516.
- Abbott et al. (2005) T. Abbott et al. (Dark Energy Survey) (2005), eprint astro-ph/0510346.
- Refregier and the DUNE collaboration (2009) A. Refregier and the DUNE collaboration, Exper. Astron. 23, 17 (2009), eprint 0802.2522.
- Hu and Dodelson (2002) W. Hu and S. Dodelson, Ann. Rev. Astron. Astrophys. 40, 171 (2002), eprint astro-ph/0110414.
- Komatsu et al. (2010) E. Komatsu et al. (2010), eprint 1001.4538.
- Hu and Tegmark (1999) W. Hu and M. Tegmark, Astrophys. J. 514, L65 (1999), eprint astro-ph/9811168.
- Abazajian and Dodelson (2003) K. N. Abazajian and S. Dodelson, Phys. Rev. Lett. 91, 041301 (2003), eprint astro-ph/0212216.
- Refregier et al. (2004) A. Refregier et al., Astron. J. 127, 3102 (2004), eprint astro-ph/0304419.
- Hoekstra and Jain (2008) H. Hoekstra and B. Jain, Ann. Rev. Nucl. Part. Sci. 58, 99 (2008), eprint 0805.0139.
- Takada and Jain (2004) M. Takada and B. Jain, Mon. Not. Roy. Astron. Soc. 348, 897 (2004), eprint astro-ph/0310125.
- Takada and Jain (2009) M. Takada and B. Jain, Mon. Not. Roy. Astron. Soc. 395, 2065 (2009), eprint 0810.4170.
- Rimes and Hamilton (2005) C. D. Rimes and A. J. S. Hamilton (2005), eprint astro-ph/0502081.
- Rimes and Hamilton (2006) C. D. Rimes and A. J. S. Hamilton, Mon. Not. Roy. Astron. Soc. 371, 1205 (2006), eprint astro-ph/0511418.
- Neyrinck and Szapudi (2007) M. C. Neyrinck and I. Szapudi, Mon. Not. Roy. Astron. Soc. 375, L51 (2007), eprint astro-ph/0610211.
- Neyrinck et al. (2006) M. C. Neyrinck, I. Szapudi, and C. D. Rimes, Mon. Not. Roy. Astron. Soc. Lett. 370, L66 (2006), eprint astro-ph/0604282.
- Neyrinck et al. (2009) M. C. Neyrinck, I. Szapudi, and A. S. Szalay, Astrophys. J. 698, L90 (2009), eprint 0903.4693.
- Sato et al. (2009) M. Sato et al., Astrophys. J. 701, 945 (2009), eprint 0906.2237.
- Takahashi et al. (2009) R. Takahashi, N. Yoshida, M. Takada, T. Matsubara, N. Sugiyama, I. Kayo, A. J. Nishizawa, T. Nishimichi, S. Saito, and A. Taruya, Astrophys. J. 700, 479 (2009), eprint 0902.0371.
- Lee and Pen (2008) J. Lee and U. Pen, Astrophys. J. 686, L1 (2008), eprint 0807.1538.