Present Limits on the Precision of SM Predictions for Jet Energies
Abstract
We investigate the impact of theoretical uncertainties on the accuracy of measurements involving hadronic jets. The analysis is performed using events with a boson and a single jet observed in collisions at = 1.96 TeV in 4.6 of data from the Collider Detector at Fermilab (CDF). The transverse momenta () of the jet and the boson should balance each other due to momentum conservation in the plane transverse to the direction of the and beams. We evaluate the dependence of the measured -balance on theoretical uncertainties associated with initial and final state radiation, choice of renormalization and factorization scales, parton distribution functions, jet-parton matching, calculations of matrix elements, and parton showering. We find that the uncertainty caused by parton showering at large angles is the largest amongst the listed uncertainties. The proposed method can be re-applied at the LHC experiments to investigate and evaluate the uncertainties on the predicted jet energies. The distributions produced at the CDF environment are intended for comparison to those from modern event generators and new tunes of parton showering.
I Introduction and physics motivation
The discovery potential of LHC experiments will strongly depend on the accuracy of standard model (SM) predictions for processes containing hadronic jets Meirose (2010), as the first step in establishing “new physics” has to be identifying an incontrovertible deviation from SM phenomena. The uncertainties on predictions for SM processes directly impact measurements of jet spectra, searches for new heavy particles using jet energies for kinematic reconstruction, and the calculation of missing transverse momentum, to name several prevalent analysis strategies as examples. The discovery potential for supersymmetry and other models of physics beyond the SM thus relies on having calibrated methods for measuring jet energies.
It has been common practice to normalize the clustered jet energy, measured with calorimeters, to the energy of the particle jet or the parent parton Bhatti et al. (2006); Abbott et al. (1999). The correction factor is often called the jet energy scale (JES). At CDF jets are observed in non-compensating sampling calorimeters, which have a non-linear response to single particles. The simulated calorimeter response for single hadrons is tuned to match that in data Bhatti et al. (2006). The measured jet energy is corrected for instrumental effects such as the non-linear response of the calorimeters as well as for parton radiation and hadronization effects. The correction for radiation and hadronization effects is independent of the experimental setup. In addition, the jet energies are corrected for multiple interactions in the same bunch crossing.
The systematic uncertainties on the JES and the related measurements arise from the accuracy of the detector simulation and limitations of the methods used by SM event generators. The event generators, such as pythia and alpgen Sjostrand et al. (2001); Mangano et al. (2003), use a simplified modeling of complex SM processes that can be altered by tuning internal parameters. The model-dependent aspects we investigate are the following:
-
•
parton distribution functions (PDFs) of the colliding and
-
•
leading order (LO) matrix elements of tree-level processes such as and
-
•
the parton-jet matching scheme Mangano et al. (2007)
-
•
final state radiation (FSR)
-
•
initial state radiation (ISR)
-
•
the renormalization and factorization scales
-
•
residual effects due to multiple interactions
-
•
the ability of the leading-log parton showering model to describe radiation at large angles.
To perform the analysis we select events with a boson and a jet observed in 4.6 of data from CDF. A boson is clearly identified as a pair of opposite-sign electrons or muons with an invariant mass close to the -boson mass. The transverse momentum of the boson is measured with high precision so that the +jet sample is ideal for the analysis. We use the -balance in the event, with the mean-value of the ratio / as the observable of interest, to test the simulated SM predictions.
The determination of the jet energy scale used in previously-published CDF analyses was performed with about 300 pb-1 of data Bhatti et al. (2006). The overall uncertainty on the JES was compared to the difference in -balance between data and MC predictions for a photon-jet and a -jet samples; the difference in -balance was calculated in a similar fashion to the method used in the current analysis. Having significantly more data (4.6 ) we investigate the systematic uncertainties affecting measurements of jet energies independently from the previously evaluated uncertainties on the JES. Using the additional statistical power, we can disentangle the different effects contributing to the uncertainties by correlating the limitations in theoretical predictions with their effect on the -balance.
The outline of the paper is as follows. The CDF II detector is described in Section II. Details for MC event generators are presented in Section III. Event selection follows in Sections IV and V. We show -balance in data and pythia as a function of in Section VI. In the same section we further validate LO predictions from pythia and alpgen by checking that the relative contributions from and diagrams are accurately modeled. Computation-related uncertainties such those due to the choice of factorization and renormalization scales are evaluated in Sections VII, VIII, IX, X, and XII. We use data to evaluate uncertainties due to mis-modeling of parton radiation at large angles and multiple interactions in Sections XI and XIII, respectively. The uncertainty due to detector simulations is calculated in Section XIV. In Section XV we summarize the observed uncertainties and compare those to the difference in -balance between data and the MC predictions. We present conclusions in Section XVI.
II The CDF II detector
The CDF II detector is a cylindrically symmetric spectrometer designed to study collisions at the Fermilab Tevatron. The detector has been extensively described in the literature CDF . Here we briefly describe the detector subsystems relevant for the analysis.
Tracking systems are used to measure the momenta of charged particles, and to trigger on and identify leptons with large transverse momentum, EtP . A multi-layer system of silicon strip detectors (SVX) SVX , which identifies tracks in both the and views CDF , and the central outer tracker (COT) COT are contained in a superconducting solenoid that generates a magnetic field of 1.4 T. The COT is a 3.1 m long open-cell drift chamber that makes up to 96 measurements along the track of each charged particle in the region . Sense wires are arranged in 8 alternating axial and stereo () super-layers with 12 wires each. For high momentum tracks, the COT resolution is Aaltonen et al. (2008).
Segmented calorimeters with towers arranged in a projective geometry, each tower consisting of an electromagnetic and a hadronic compartment cem ; cal , cover the central region, (CEM/CHA), and the forward region Apollinari et al. (1998), (PEM/PHA). In both the central and forward regions, systems with finer spatial resolution are used to make profile measurements of electromagnetic showers at shower maximum CDF for electron identification (the CES and PES systems, respectively). Electrons are reconstructed in the CEM with an EtP resolution of cem and in the PEM with an resolution of pem . Jets are identified using a cone clustering algorithm in space, with cone radius , as a group of electromagnetic and hadronic calorimeter towers. The CDF hadronic calorimeters have a steel-scintillator sampling design and the electromagnetic calorimeters are built from lead and scintillator. The sampling calorimeters have a non-linear response to stable hadrons Bhatti et al. (2006), which carry most of the jet momentum.
Muons are identified using the central CMU, CMP, and CMX cmu ; cmp muon systems, which cover the kinematic region . The CMU system uses four layers of planar drift chambers to detect muons with in the central region of . The CMP system consists of an additional four layers of planar drift chambers located behind 0.6 m of steel outside the magnetic return yoke, and detects muons with . The CMX detects muons in the region with four to eight layers of drift chambers, depending on the polar angle.
The beam luminosity is measured using two sets of gas Cherenkov counters, located in the region . The total uncertainty on the luminosity is estimated to be 5.9%, where 4.4% comes from the acceptance and operation of the luminosity monitor and 4.0% from the calculation of the inelastic cross-section lum .
A 3-level trigger system CDF selects events for further analysis offline. The first two levels of triggers consist of dedicated fast digital electronics analyzing a subset of the full detector data. The third level, applied to the full data from the detector for those events passing the first two levels, consists of a farm of computers that reconstruct the data and apply selection criteria for (typically) several hundred distinct trigger paths.
III Standard model predictions for events with a boson and jets
The standard model expectations for inclusive production of bosons are calculated from Monte Carlo simulations using pythia and alpgen. Events from the two MC generators are processed through the full detector simulation to be reconstructed and analyzed like data.
The datasets for the + light jets signatures are produced using v6.216 of pythia in which the spectrum of the bosons, , has been tuned to CDF Run I data for Acosta et al. (2005), and which incorporates a tuned underlying-event, Tune AW Field (2006). The event generator was set to inclusive production of -bosons with a 30 cut. Historically, a di-jet sample simulated with pythia was used to determine the JES at CDF; in this study we take the + jets events from pythia as our default benchmark sample.
Additional + jets samples are produced with v2.10-prime of alpgen that has built-in matching of the number of jets from parton showering and matrix-element production Mangano et al. (2007). The exclusive + N partons (N=0,..,4) samples were combined into one inclusive sample using the corresponding cross-sections provided by alpgen. Showering and hadronization of jets is done with pythia v6.326, Tune AW Field (2006). The jet-parton matching is performed at a of 15 (referred to as the matching scale) using the jetclu clustering algorithm with a radius of R=0.4.
Production of +jet events is performed differently by stand-alone pythia and alpgen+pythia. The alpgen+pythia calculation begins with the exact matrix elements from alpgen for +N partons (N=0,..,4), which are then interfaced with pythia parton showering. The interface contains a veto algorithm that removes double-counting between matrix element and parton shower partons Mangano et al. (2007). The stand-alone pythia calculation begins with the simplest matrix element (+0 partons) and adds additional partons from the shower with no need for a veto. However, the first parton emission is corrected to reproduce the +1 parton matrix element. Thus, any substantial differences between the predictions of the two calculations (if they exist) should arise for the second jet. Both event generators use the same PDF set, CTEQ5L, and Lund string hadronization model as implemented in Pythia.
The parton showering (PS) inside the jet cone (see Section V.1) has been extensively studied Aaltonen et al. (2009); Acosta et al. (2003, 2005) and is in good agreement with predictions. In addition, the momentum spectra of charged-particle tracks in jets are found to be in good agreement with SM predictions Bhatti et al. (2006).
The large-angle (outside of cone R=0.4) parton radiation is not described well by stand-alone parton showering model in pythia; the rate of softer jets collinear to a jet is not described (e.g. see Fig. 3 in Aaltonen et al. (2009), the distribution of observed in multi-jet events). Radiation of the 3rd jet in multi-jet events is qualitatively equivalent to radiation of the 2nd jet in +jets events. The same issue affects the invariant mass calculated for a pair of jets, energy of a jet, and missing transverse momentum. The problem related to the parton radiation at large angles can be addressed by using an exact matrix element (ME) for multi-jet events as is done in alpgen+pythia simulation. The ME correction is introduced for radiated jets with above the matching scale (15 ); softer radiation is produced via the same leading-log parton shower mechanism.
IV Description of data samples
The analysis uses events that contain either an electron with or a muon with selected within the central region of the detector, , by the trigger system. The electron dataset contains 229M events; the muon dataset contains about 65M events. The integrated luminosity of each dataset is 4.6 .
V Event selection
Both the observed and the simulated events (see Section III) use the same selection criteria to identify electrons, muons, bosons, and jets. Details of the selection criteria for electrons and muons are provided in A.
V.1 Jet identification
Jets are reconstructed using jetclu, the standard CDF cone-based clustering algorithm, with cone radii of R = 0.4, 0.7, and 1.0 Abe et al. (1992). The clustering is performed using calorimeter towers with raw (uncorrected) energy above 1 to form a cluster of at least 3 . To resolve ambiguities with overlapping cones, cones sharing an energy fraction of more than 0.75 are merged into a single jet; otherwise the shared towers are assigned to the closest jet.
The jet energies are corrected for the non-uniformity in of the calorimeter response and for multiple interactions. In this analysis, the leading jet energy is always corrected to the parton level; the jet energy scale is adjusted to relate the measured energy of a simulated jet and the energy of the corresponding parton in di-jet events Bhatti et al. (2006) from pythia. The jet clustering algorithm is run over calorimeter towers for reconstructed jets, and over stable particles for hadron-level jets. The correction factor from the hadron to the parton level is a function of only jet , and is the same for data and predictions. The JES corrections at CDF do not take into account if a jet is initiated by a tree-level quark or a gluon.
Calorimeter clusters that coincide with an identified electron, or photon are removed from the jet collection to avoid ambiguities. High- photons are not rare in hard-scattering events. Identifying photons as jets and then correcting them as jets can lead to mis-measured -balance. To avoid photon misidentifications the event selection requires the leading jet to have EM-fraction less than 0.95. The EM-fraction is the fraction of energy of a jet deposited in the electromagnetic compartment of the calorimeter in comparison to the total energy of the jet.
V.2 Reconstruction of + jet events
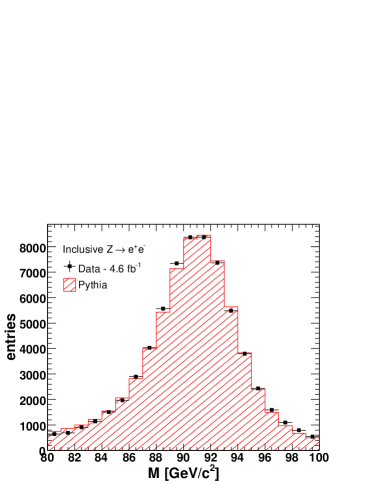
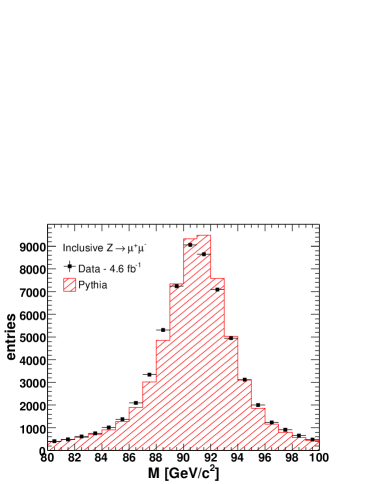
Pairs of oppositely-charged electrons and muons are identified as -boson candidates if the reconstructed invariant mass falls in the mass window from 80 to 100 . The selection of events requires two tight leptons or a tight and a loose lepton (see A). The two leptons are required to be assigned to the same primary vertex, which is required to have a z-coordinate within 60 cm from the center of the CDF detector. Also we remove dimuon events where the leading jet overlaps () with one of the muons forming a boson. Figure 1 shows the distributions in invariant mass for electron and muon pairs; the data are in a remarkable agreement with SM predictions from pythia and alpgen.
Events are further required to have at least one jet. First, we correct all jet energies for -dependent response of the calorimeters and for multiple interactions; the leading jet is required to be greater than 8 . An event is vetoed if the second jet cluster, the sub-leading jet, has a of more than 8 . The leading jet is required to be in the pseudo-rapidity range of to avoid cracks in the central calorimeter. We do not apply the requirement to sub-leading jets; their pseudo-rapidity can be from -2.8 to 2.8. Then the momentum of the leading jet is corrected to the parton level as described above (see Sec. V.1). The of the leading jet, , and the of the boson, , are required to be back-to-back: rad.
Rarely the leading jet can originate from another interaction produced in the same bunch crossing as the +jet; the overlapping jets bias the -balance. The number of interactions in each event is estimated via the number of primary vertices along the beam line; the number is used for the corresponding JES correction. The multiple interactions are mostly minimum bias events that produce relatively soft jets ( 8 ).
We veto events with two or more primary vertices in which the leading jet is measured to come from a different interaction vertex than that of the hard interaction producing the -boson. The jet vertex of origin is determined using tracks pointing to the towers in the jet cluster. For each track we take the -coordinate of the point on the track closest to the beam-line. A mean value of the -coordinates is calculated to determine the vertex of jet origin. Specifically, events are removed if the leading jet has two or more tracks, and the jet vertex is more than 2 cm away from the vertex of the lepton pair along the -axis. The veto has a negligible effect on the -balance as the leading jet is required to be above 8 .
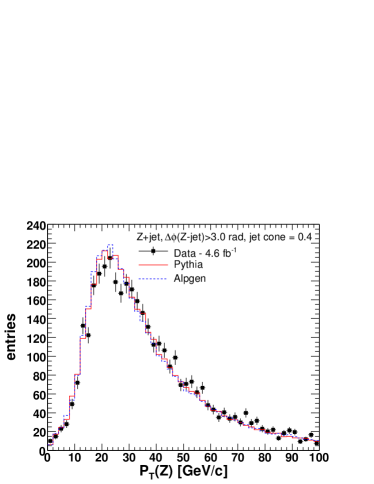
We use simulations to evaluate the bias between the measured and its true value separately for and events. The mean value of the observed is found to be within 0.5% of its mean generated value in both samples. The distribution of the observed transverse momentum of -bosons, , is shown in Fig. 2.
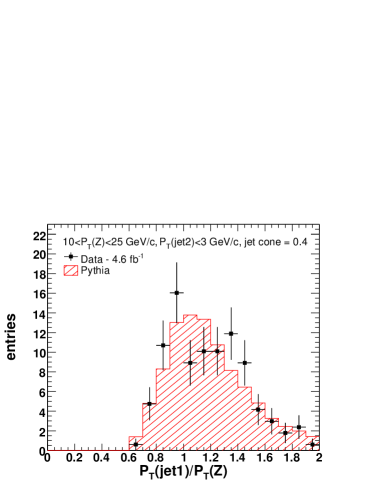
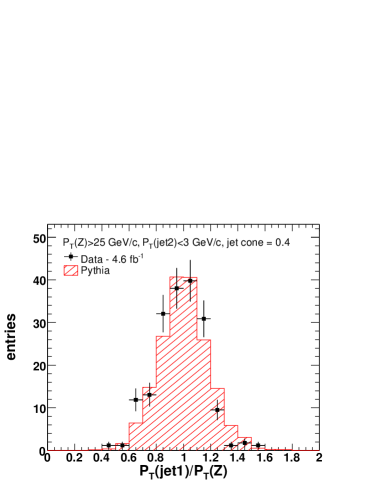
The -jet system is not a perfect two-body process and the -balance, /, is sensitive to the surroundings of the jet. Also, the jet energy resolution is rather poor (in comparison to the jet energy) for jets with of about 10 . The resolution improves with higher jet energies from approximately 20% for (jet) = 40 to 12% for (jet) = 140 . As an illustration that we can approach the ideal two-body system we apply a more stringent event selection; the of sub-leading jets is required to be less than 3 . The -balance for the exclusive event selection is shown in Fig. 3. The distribution for events with 25 is asymmetric and shifted from 1.0 due to the finite jet energy resolution and the cut-off on the minimum of the leading jet (see Fig. 3 (a)). The distribution in -balance for events with 25 is nearly symmetric and peaks close to 1.0 (see Fig. 3 (b)). Consequently we use events with 25 to compare data and predictions. In the following analysis, however, we do not use the 3 cut-off on the sub-leading jet as it was used to effectively prove the jet energy correction works properly, but relax the cut-off to 8 to better study the systematic uncertainties caused by the MC predictions.
VI Validation of SM simulations: Properties of quark and gluon jets
Properties of a QCD jet depend on the tree-level parton initiating it. A jet initiated by a gluon has a higher multiplicity of daughter hadrons than a jet of the same energy initiated by a light quark. The difference in the observed particle multiplicities is due to the different color charges of quarks and gluons Derrick et al. (1985).
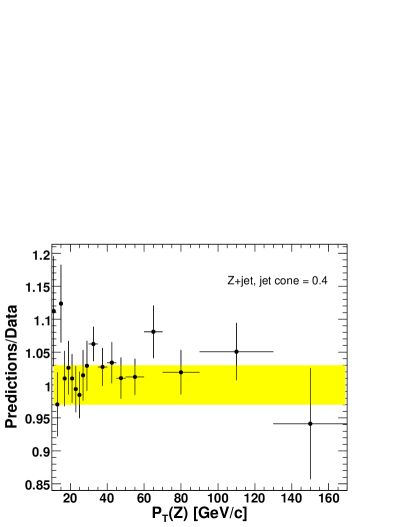
A quark jet deposits more energy in the calorimeter system on average than a gluon jet with the same true momentum. The difference is caused by the non-linear response of the calorimeter to single particles and the different multiplicities of hadrons. The predicted -balances are presented as a function of for quark and gluon jets and for data in Figs. 4, 5, and 6 for jet cone radii of 0.4, 0.7, and 1.0. The -balance for quark jets is significantly different than that for gluon jets; it is consequently essential to check that the mixture of quark and gluon jets is predicted accurately by pythia.
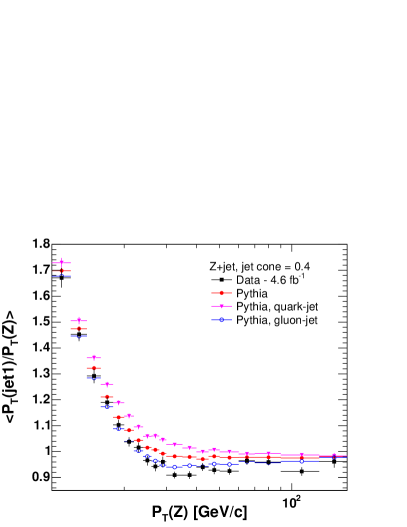
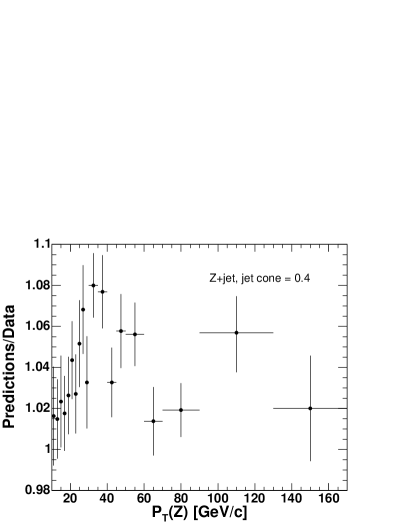

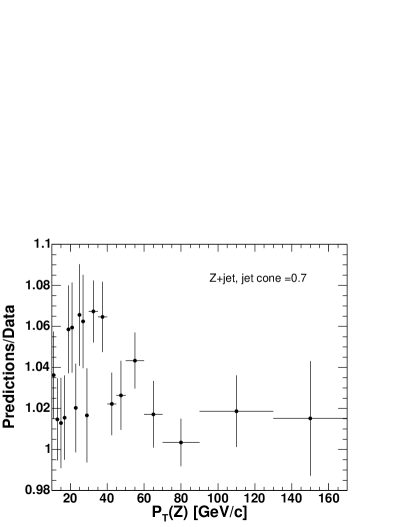

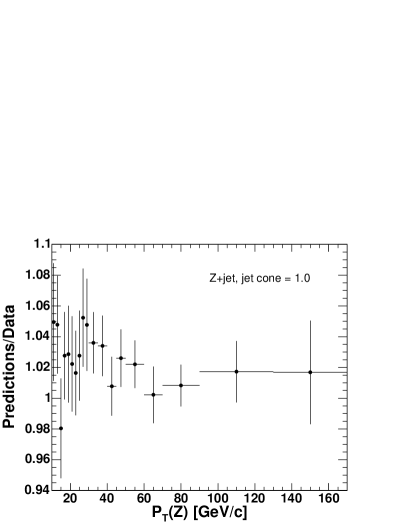
The fraction of quark and gluon jets in the -jet sample is largely driven by the parton distribution functions of the colliding particles (e.g. at the Tevatron and at the LHC) and the matrix elements of and tree-level diagrams. The -balance observed in data is different than that from pythia simulations as shown in Figs. 4, 5, and 6.
We test that the discrepancy between data and predictions in the -balance is not caused by an incorrectly modeled fraction of quark and gluon jets using two methods. We compare rapidity distributions for +jet events in Section VI.1 to validate the relative contributions from and LO diagrams in pythia and alpgen. Having the rapidity distributions for data, alpgen, and pythia in good agreement, we further test the prediction from pythia alone by looking at the number of tracks inside the jet cone (see Section VI.2).
The quark-gluon mixture is sensitive to PDFs, choice of renormalization and factorization scales, and LO matrix element for the + 1-parton final state. The impact from these will be reported later in Sections VII, VIII, IX, and X.
VI.1 Kinematic properties of +jet events
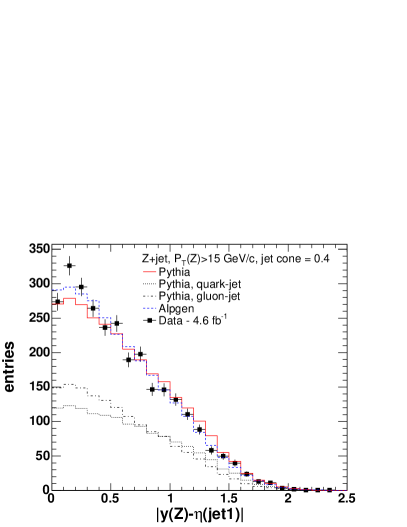
The kinematic properties of +jet events provide an indirect test of the quark-gluon composition of the leading jet. SM predictions are studied using the distributions of sum and difference of rapidities of a boson and the leading jet, and , respectively (see Fig. 7). We require 15 to avoid very soft jets. We observe good agreement between data and the predictions (both alpgen and pythia). The distributions are slightly different for alpgen and pythia due to the different methods of computing MEs for the tree-level processes.

VI.2 Charged particle multiplicity in jets
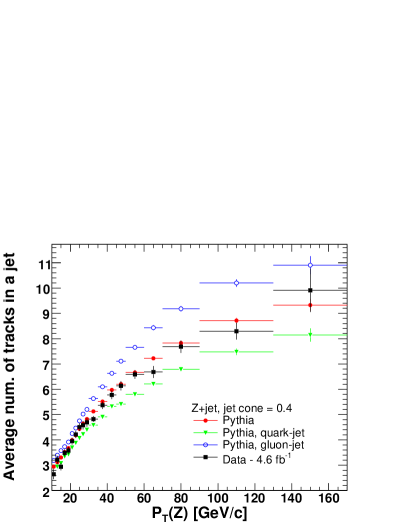
We perform a direct test of the quark-gluon composition of the observed jets by using the number of tracks observed within the cone of the leading jet. The tracks are required to originate from the same vertex as the lepton pair forming a boson, 4 cm and 0.02 cm with SVX hits (0.2 cm without SVX). Also we require a good track quality for the tracks, namely for the track fit divided by the number of degrees of freedom should be less than 6. The transverse momentum of the tracks is required to be greater than 0.3 . The number of tracks is different for quark and gluon jets (see Fig. 8). Overall, the observed events are in good agreement with the SM predictions (pythia).
Both tests of the quark-gluon composition of jets have demonstrated that pythia simulations describes the jet composition accurately. From now we proceed with investigating the other sources of uncertainties, which contribute to the discrepancy in -balance between data and pythia (Figs. 4, 5, and 6).
VII Uncertainty due to calculation of the matrix elements and the jet-parton matching scheme
Calculation of matrix elements (MEs) for +0 partons and +1 parton is different in alpgen+pythia and stand-alone pythia. In addition, alpgen+pythia simulation uses a veto algorithm to avoid double counting of jets produced by matrix elements and radiation from the parton shower Mangano et al. (2007). The difference in methods affects the -balance obtained using the two event generators. To estimate the difference we calculate the -balance as a function of in both the alpgen and pythia samples similarly to that shown in Figs. 4, 5, and 6. Then we calculate the ratio between the distributions as a function of . The mean value of the ratio for events with 25 is taken as the uncertainty due to calculation of MEs and jet-parton matching. The resulting uncertainty is found to be about 1% as shown in Table 1.
VIII PDF uncertainties
We test the sensitivity of the -balance to the choice of the PDF set used to generate events Pumplin et al. (2002). The default PDF set, CTEQ5L, is a single set of functions and it does not contain error functions Pumplin et al. (2001). We estimate the PDF-related systematic uncertainty using the Hessian method; we take the CTEQ6M set, which includes 40 eigenvector error functions in addition to the central value. We re-weight the existing events with the parton densities provided by the CTEQ6M set. For each error set we calculate the difference in -balance relative to the central value given by CTEQ6M. The sum in quadratures of the 40 variations in -balance results in a negligibly small value (less that 0.1%) of the uncertainty on the predicted balance.
IX ISR uncertainties
In the Monte Carlo sample of inclusive events generated using pythia, most of the jets arise from the ISR parton shower model (the underlying event model also contributes to production of soft jets), which depends upon several parameters that are not tightly constrained by data. As a result, the parameters of ISR affect the observed -balance in +jet events.
To produce the systematics samples we altered the ISR settings used in pythia, parameters PARP(61) and PARP(64), similarly to the procedure described in Abulencia et al. (2006). The parameter PARP(61) defines used in running of in space-like parton showers. By default, the value of is chosen according to the PDF parameterizations. Parameter PARP(64) is also used in the calculation of and parton distributions as a multiplier for the squared transverse momentum evolution scale, .
The variations in -balance calculated for the systematics samples relative to the default are used to estimate the ISR uncertainty. The resulting value is on the order of 1%.
X Uncertainty due to renormalization and factorization scales
Predictions for +jet production are sensitive to the choice of renormalization and factorization scales. The accuracy of LO calculations is often estimated by varying renormalization and factorization scales (NLO calculations demonstrate weaker dependence on the scales) Barger et al. (1989). The scales impact calculation of the LO matrix elements for events with a boson and N partons. We exploit alpgen to generate events with altered renormalization and factorization scales. The scales are always kept the same by alpgen, with a default value . We produce two “systematic” samples with being multiplied by 0.5 or 2.0. The choice of the scales impacts the predicted -balance by up to 1-2% as recorded in Table 1.
The effect due to variation of renormalization and factorization scales in alpgen is similar to that caused by variation of the ISR parameters in pythia (see Sec. IX). The stand-alone pythia method of calculations for the inclusive production of bosons uses an ISR parton shower to estimate the LO matrix element for plus one parton. Both methods deal with the same computational uncertainty caused by limited accuracy of the LO calculations used in the two MC event generators so that the variation of scales results in similar uncertainties for the both generators. We use the variation in -balance estimated with alpgen and not that obtained with pythia to avoid double-counting the effect. The resulting effect on the predicted -balance is about 1-2% as recorded in Table 1.
XI Characteristics of out-of-cone radiation
An understanding of the energy flow outside of the cone of the leading jet is essential for interpreting the measurement of -balance in -jet events. Raw calorimeter energy summed in annuli outside of the jet cone is not linearly proportional to the true out-of-cone energy.
We exploit correlations between -balance and properties of the sub-leading jet such as (jet2) and . Multiple interactions produce additional soft jets that are unrelated to the jets recoiling against the -boson. The presence of additional interactions might bias the correlation between the -balance and the properties of the sub-leading jet. In the method described in this section we require all events to have exactly one primary vertex, i.e. one interaction. The requirement to have exactly one primary vertex was not applied before since we did not have to measure jet clusters with softer than 8 .
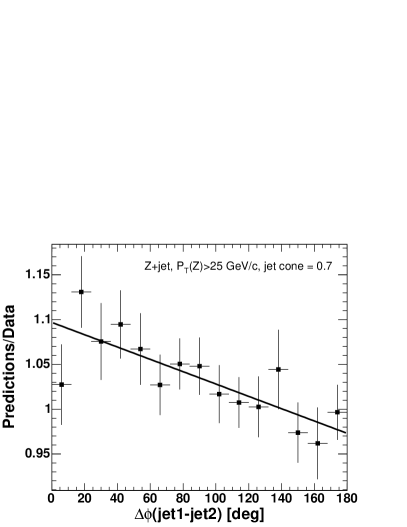
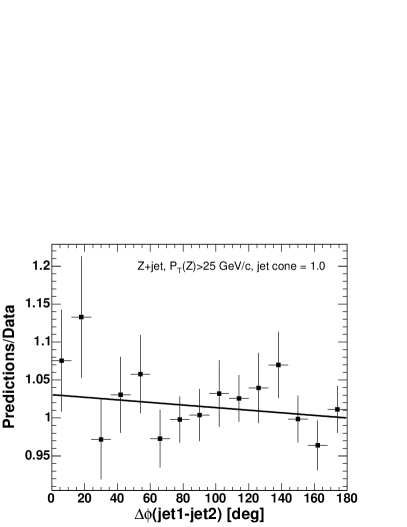
We measure the dependence of the -balance on the azimuthal angle between the leading jet () and the sub-leading one (), , for events with 25 (see Figs. 9, 10, and 11). The observed dependence of the -balance on the angular separation between the 1st and the 2nd jets is sensitive to the jet cone size. As expected the largest discrepancy between data and predictions is observed with the smallest jet cone size of R=0.4 (see Fig. 9), for which the particle-jet-energy to parton-jet-energy correction is at maximum. Larger jet cone sizes give result in better agreement between data and pythia simulations. Two cone-0.4 jets can be reconstructed as one cone-1.0 jet. As a result the large-angle radiation most likely falls within the jet cone of R=1.0.

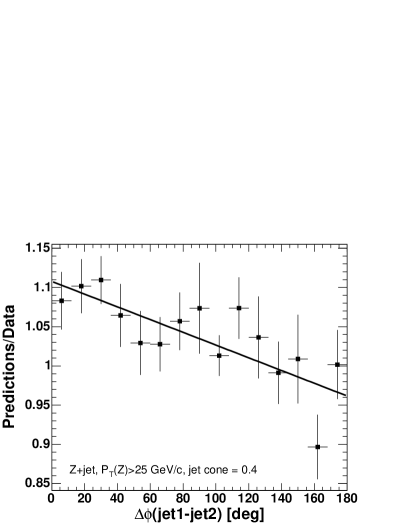

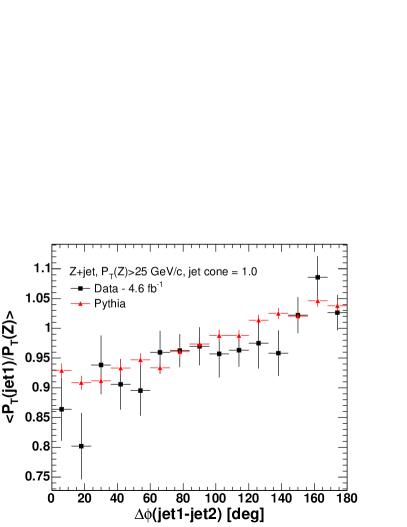
The positive correlation between the -balance and shows that the 2nd jet is often caused by the parton radiation from the leading jet as the magnitude of the correlation is proportional to the rate of the large-angle parton radiation. A negative slope of the ratio between data and predictions (e.g. see Fig. 9(b)) indicates that the data exhibit more large-angle parton radiation than the MC simulations. The deficiency of large-angle parton radiation is also consistent with the results from Abazov et al. (2010).
We measure the dependence of the -balance on the of the second jet, (jet2). The balance as a function of the 2nd jet is shown in Figs. 12, 13, and 14 for different sizes of jet cones. The balance is most sensitive to the 2nd jet when the jet cone is 0.4 (see Fig. 12). The observed rate of large-angle out-of-cone radiation is also observed to be higher in data than in the predictions.
XI.1 Uncertainty due to out-of-cone radiation
We use the -cutoff of the sub-leading jet to estimate the variation of the balance due to the out-of-cone radiation. The agreement between data and predictions improves as we decrease the cut-off value on as shown in Figs. 12, 13, and 14 (all the other selection requirements are kept the same). The extrapolation to the point where is zero describes the case where both data and predictions do not have any large-angle FSR.
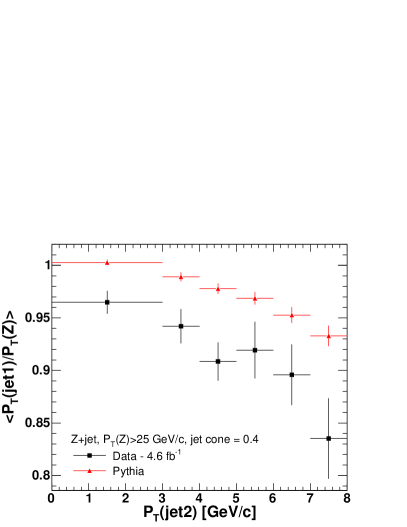

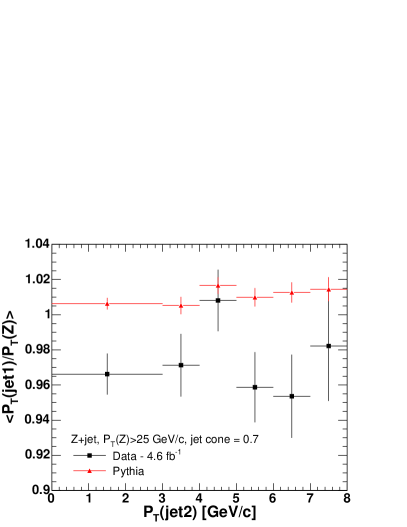
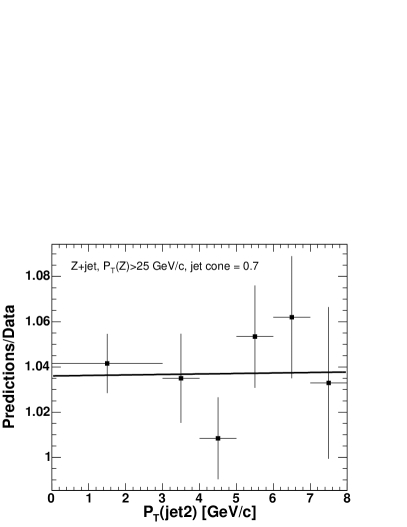
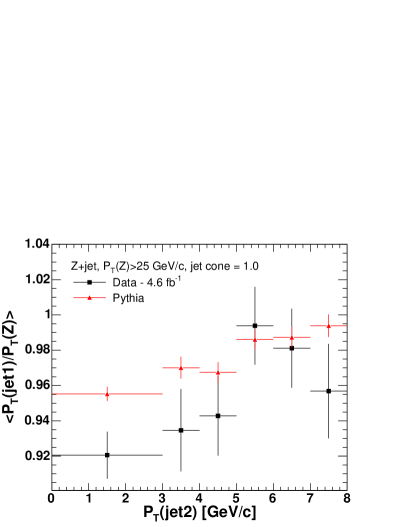
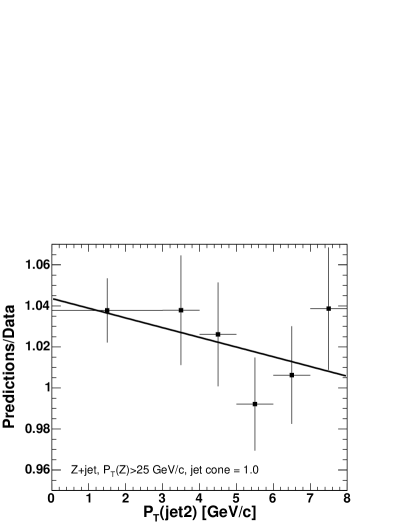
We use the ratio of -balance between data and prediction to estimate the uncertainty due to large-angle FSR. The ratio is obtained as a function of of the sub-leading jet, . To obtain the systematic uncertainty we multiplied the mean value of by the slope of the linear fit of the ratio. The uncertainties are summarized in Table 1. As an alternative approach, one can take the difference between the mean value of the ratio and that obtained using the linear extrapolation to 0 as a systematic uncertainty. The latter approach gives different values for the uncertainty than the first one ( -2.0%, +0.4%, and 2.4% for the jet cone sizes of 0.4, 0.7, and 1.0, respectively).
XII Final state radiation uncertainties
Final state radiation (FSR) from unfragmented partons is modeled by time-like parton showers in pythia. The predicted -balance is sensitive to the rate of FSR. In this study, the variation of FSR parameters is performed similarly to that for ISR (see Section IX and Abulencia et al. (2006)). To produce the systematics samples we altered the parameters PARP(72) and PARP(71) in pythia. The value of PARP(72) defines the parameter used in simulation of time-like showers of partons produced in ISR. By default, the same parameter from the PDF set (CTEQ5L in this case) is used for ISR and FSR partons. The value of PARP(71) is used as a multiplicative scaling factor to the scale of the hard scattering to define the maximum parton virtuality for time-like showers. The variation of -balance in the FSR systematics samples is about 0.1-0.4%, as shown in Table 1.
XIII Multiple proton-proton interactions
The -balance is sensitive to multiple interactions overlapping in-time with the hard process. The number of interactions per event is estimated by observing additional primary vertices along the beam-line. The additional interactions are likely to be minimum-bias collisions.
The uncertainty in the -balance arises from the present limited ability of pythia to describe the calorimeter energy in a minimum bias event accurately. The momentum distribution of charged particles in the predictions, measured in the magnetic spectrometer (COT), was tuned to data only for particles with 0.5 Affolder et al. (2002) as soft charged particles curl up in the magnetic field and do not reach the calorimeters. Consequently the response for soft ( 0.5) neutral hadrons is not measured. The -balance varies to the number of primary verticies differently in data and predictions. The difference in variation of the -balance, on the order of a percent, is taken as a systematic uncertainty (see Table 1).
XIV Detector simulations for the jet energy response
The jet energy scale relies on measurements of the response of the calorimeters to single charged particles whose momenta are measured precisely using the magnetic spectrometer of CDF as well as test-beam measurements at the highest momenta Bhatti et al. (2006). Uncertainties in transferring the measured single-particle response to a parametric model of the calorimeter jet response contribute significantly to the uncertainty on the CDF jet energy scale. The net effect of varying the single particle response on the simulated -balance is typically 2.5% as shown in Table 1.
XV Summary of systematic uncertainties
We observe a significant discrepancy in the -balance of -bosons and single jets between measurements and prediction, with the data being lower in the of the jet compared to predictions. We find that pythia predicts the fractions of quark and gluon jets accurately. In Table 1 we summarize the estimated variations (taken as systematic uncertainties) of the predicted balance. The totality of the variations is comparable to the observed discrepancy, with the largest contributions being those from large-angle FSR and the modeling of the single-particle response of the calorimeters.
| Source of uncertainty | R = 0.4 | R = 0.7 | R = 1.0 |
| renormalization and factorization scales | +0.9 -0.0 | +0.9 -0.4 | 0.4 |
| FSR parameters in pythia | 0.4 | 0.1 | 0.1 |
| MEs and jet-parton matching | +0.8 -0.0 | +1.1 -0.0 | +0.8 -0.0 |
| detector simulations (single particle response) | 2.5 | 2.5 | 2.5 |
| multiple proton interactions | +1.0 -0.0 | +1.2 -0.0 | +1.2 -0.0 |
| large-angle FSR (limitation of PS) | +0.0 -2.9 | +0.0 -0.2 | +1.7 -0.0 |
| Estimate of the total variation | +3.0 -3.8 | +3.1 -2.5 | +3.4 -2.5 |
| The observed discrepancy | +4.7 | +3.2 | +2.0 |
Data indicates that the large-angle parton radiation is not modeled accurately by the leading-log parton showering from pythia Tune AW: the MC simulation underestimates the large-angle radiation. The discrepancy is not addressed by the predictions from alpgen + pythia either; the ME calculations affect only jets with above the matching scale (15 in the analysis); softer radiation ((jet2) 8 in the analysis) is simulated via the parton showering mechanism.
XVI Conclusions
We have estimated the sensitivity of the -balance method to a number of theoretical factors: the virtuality-ordered parton showering from pythia, tree-level matrix elements, parton distribution functions, parton-jet matching procedure, renormalization and factorization scales, multiple interactions, and calorimeter response of single stable particles. The contribution from each source of uncertainty is presented in Table 1. The uncertainty caused by inadequate modeling of the parton shower at large angles is found to be the largest. The sum of the uncertainties is consistent with the discrepancy between data and predictions in the -balance. The remaining uncertainties are significantly smaller Bhatti et al. (2006).
Numerous modern higher-order MC simulations utilize leading-log parton showering from pythia Hamilton and Nason (2010); Torrielli and Frixione (2010). The higher-order calculations of the matrix elements are less sensitive to the choice of renormalization and factorization scales so that the related uncertainty should be smaller than that we evaluated. However, the uncertainty due to large-angle parton radiation is expected to be of the same magnitude as in the study. We encourage the LHC experiments to use the distributions in Figs. 9, 10, 11 and 12, 13, 14 as a systematic method for tuning the parton showering parameters in event generators for more accurate jet energy measurements.
Acknowledgements.
We thank the Fermilab staff and the technical staffs of the participating institutions for their vital contributions. This work was supported by the U.S. Department of Energy and National Science Foundation; the Italian Istituto Nazionale di Fisica Nucleare; the Ministry of Education, Culture, Sports, Science and Technology of Japan; the Natural Sciences and Engineering Research Council of Canada; the National Science Council of the Republic of China; the Swiss National Science Foundation; the A.P. Sloan Foundation; the Bundesministerium für Bildung und Forschung, Germany; the World Class University Program, the National Research Foundation of Korea; the Science and Technology Facilities Council and the Royal Society, UK; the Institut National de Physique Nucleaire et Physique des Particules/CNRS; the Russian Foundation for Basic Research; the Ministerio de Ciencia e Innovación, and Programa Consolider-Ingenio 2010, Spain; the Slovak R&D Agency; and the Academy of Finland. This work has also been supported by the Maria Goeppert Meyer Fellowship of Argonne National Laboratory, the National Science Foundation, and the US Department of Energy. We are thankful to David Mietlicki, Ray Culbertson, Peter Skands, Torbjorn Sjostrand, Alexander Pronko, Larry Nodulman, Willis Sakumoto, Michelangelo Mangano, Christina Mesropian, Eric J. Feng, and Jan-Christopher Winter for suggestions.References
- Meirose (2010) B. Meirose, AIP Conf. Proc., 1200, 717 (2010), arXiv:0909.4427 [hep-ex] .
- Bhatti et al. (2006) A. Bhatti et al., Nucl. Instrum. Meth. A, 566, 375 (2006), arXiv:hep-ex/0510047 .
- Abbott et al. (1999) B. Abbott et al. (D0), Nucl. Instrum. Meth., A424, 352 (1999), arXiv:hep-ex/9805009 .
- Sjostrand et al. (2001) T. Sjostrand, L. Lonnblad, and S. Mrenna, (2001), hep-ph/0108264 .
- Mangano et al. (2003) M. L. Mangano, M. Moretti, F. Piccinini, R. Pittau, and A. D. Polosa, JHEP, 0307, 001 (2003), hep-ph/0206293 .
- Mangano et al. (2007) M. L. Mangano, M. Moretti, F. Piccinini, and M. Treccani, JHEP, 01, 013 (2007), hep-ph/0611129 .
- (7) the CDF-II detector is described in more detail in many recent publications; see, for example, A. Abulencia et al., (CDF Collaboration), Phys. Rev. D 73, 112006 (2006), and references therein.
- (8) Transverse momentum and energy are defined as and , respectively.
- (9) A. Sill et al., Nucl. Instrum. Meth. A 447, 1 (2000); A. Affolder et al., Nucl. Instrum. Meth. A 453, 84 (2000); C.S. Hill, Nucl. Instrum. Meth. A 530, 1 (2000).
- (10) The CDF coordinate system is cylindrical and right-handed, with the axis horizontal and out of the Tevatron ring, the axis up, the axis along the proton beam, and ; is the azimuthal angle. The pseudorapidity , where is the polar angle; the regions for detector components are defined with respect to the center of the detector. The central region is defined as .
- (11) A. Affolder et al., Nucl. Instrum. Meth. A 526, 249 (2004).
- Aaltonen et al. (2008) T. Aaltonen et al. (CDF Collaboration), Phys. Rev. D, 77, 112001 (2008a).
- (13) L. Balka et al., Nucl. Instrum. Meth. A 267, 272 (1988).
- (14) S. Kuhlmann et al., Nucl. Instrum. Meth. A 518, 39 (2004).
- Apollinari et al. (1998) G. Apollinari, K. Goulianos, P. Melese, and M. Lindgren, Nuclear Instruments and Methods in Physics Research Section A: Accelerators, Spectrometers, Detectors and Associated Equipment, 412, 515 (1998), ISSN 0168-9002.
- (16) D. Acosta et al. (CDF Collaboration), Phys. Rev. D 71, 032001 (2005).
- (17) M. G. Albrow et al. (CDF Collaboration), Nucl. Instrum. Meth. A 480, 524 (2002).
- (18) G. Ascoli et al. (CDF Collaboration), Nucl. Instrum. Meth. A 268, 33 (1988).
- (19) T. Dorigo et al. (CDF Collaboration), Nucl. Instrum. Meth. A 461, 560 (2001).
- (20) D. Acosta et al. (CDF Collaboration), Nucl. Instrum. Meth. A 494, 57 (2002).
- Acosta et al. (2005) D. Acosta et al. (CDF Collaboration), Phys. Rev. Lett., 94, 091803 (2005a), hep-ex/0406078 .
- Field (2006) R. Field (for the CDF Collaboration), AIP Conf. Proc., 828, 163 (2006).
- Aaltonen et al. (2009) T. Aaltonen et al. (CDF), Phys. Rev. Lett., 102, 232002 (2009a), arXiv:0811.2820 [hep-ex] .
- Acosta et al. (2003) D. Acosta, T. Affolder, H. Akimoto, et al., Phys. Rev. D, 68, 012003 (2003).
- Acosta et al. (2005) D. Acosta, J. Adelman, T. Affolder, T. Akimoto, M. G. Albrow, D. Ambrose, S. Amerio, D. Amidei, A. Anastassov, K. Anikeev, A. Annovi, J. Antos, M. Aoki, G. Apollinari, T. Arisawa, J.-F. Arguin, A. Artikov, W. Ashmanskas, A. Attal, F. Azfar, P. Azzi-Bacchetta, N. Bacchetta, H. Bachacou, W. Badgett, A. Barbaro-Galtieri, G. J. Barker, and V. E. Barnes, Phys. Rev. D, 71, 112002 (2005b).
- Aaltonen et al. (2009) T. Aaltonen, J. Adelman, T. Akimoto, M. G. Albrow, et al., Phys. Rev. D, 79, 011101 (2009b).
- Abe et al. (1992) F. Abe et al. (CDF Collaboration), Phys. Rev. D, 45, 1448 (1992).
- Derrick et al. (1985) M. Derrick, K. K. Gan, P. Kooijman, J. S. Loos, B. Musgrave, L. E. Price, J. Schlereth, K. Sugano, J. M. Weiss, D. E. Wood, D. Blockus, B. Brabson, S. W. Gray, C. Jung, H. Neal, H. Ogren, D. R. Rust, M. Valdata-Nappi, C. Akerlof, G. Bonvicini, J. Chapman, D. Errede, N. Harnew, P. Kesten, D. I. Meyer, D. Nitz, A. A. Seidl, R. Thun, T. Trinko, M. Willutzky, S. Abachi, P. Baringer, I. Beltrami, B. G. Bylsma, R. Debonte, D. Koltick, F. J. Loeffler, E. H. Low, R. L. McIlwain, D. H. Miller, C. R. Ng, L. K. Rangan, E. I. Shibata, and B. Cork, Physics Letters B, 165, 449 (1985), ISSN 0370-2693.
- Aaltonen et al. (2009) T. Aaltonen et al. (CDF), Phys. Rev., D79, 052008 (2009c), arXiv:0812.4458 [hep-ex] .
- Pumplin et al. (2002) J. Pumplin et al., JHEP, 07, 012 (2002), arXiv:hep-ph/0201195 .
- Pumplin et al. (2001) J. Pumplin et al., Phys. Rev., D65, 014013 (2001), arXiv:hep-ph/0101032 .
- Abulencia et al. (2006) A. Abulencia et al. (CDF Collaboration), Phys. Rev. D, 73, 032003 (2006), arXiv:hep-ex/0510048 .
- Barger et al. (1989) V. Barger, T. Han, J. Ohnemus, and D. Zeppenfeld, Phys. Rev. D, 40, 2888 (1989).
- Abazov et al. (2010) V. M. Abazov et al. (D0), Phys. Lett., B682, 370 (2010), arXiv:0907.4286 [hep-ex] .
- Affolder et al. (2002) T. Affolder, H. Akimoto, A. Akopian, et al., Phys. Rev. D, 65, 092002 (2002).
- Hamilton and Nason (2010) K. Hamilton and P. Nason, JHEP, 06, 039 (2010), arXiv:1004.1764 [hep-ph] .
- Torrielli and Frixione (2010) P. Torrielli and S. Frixione, JHEP, 04, 110 (2010), arXiv:1002.4293 [hep-ph] .
- Abulencia et al. (2007) A. Abulencia et al. (CDF Collaboration), J. Phys., G34, 2457 (2007), arXiv:hep-ex/0508029 .
- (39) For central electrons at least 5 hits in each of 3 axial and 2 stereo layers of the COT are required.
- (40) The fraction of electromagnetic energy allowed to leak into the hadron compartment must be less than for central electrons, less than 0.05 for electrons in the end-plug calorimeters, less than max[0.125, ] for photons.
- (41) D. Acosta et al. (CDF Collaboration), Phys. Rev. D 71, 051104 (2005); hep-ex/0501023.
- (42) For tight muons at least 5 hits in each of 3 axial and 3 stereo layers of the COT are required; for loose muons with a matching muon stub this is relaxed to 3 axial and 2 stereo. Loose muons without a matching stub have an additional cut on the for the fit to the track.
- (43) The energy deposited in the calorimeter tower traversed by the muon must be less than in the electromagnetic compartment and less than in the hadronic compartment.
- Varganov (2004) A. V. Varganov, The Production Cross Sections of the Weak Vector Bosons in Proton Antiproton Collisions at = 1.96 and a Measurement of the W Boson Decay Width. , Ph.D. thesis, University of Michigan (2004), FERMILAB-THESIS-2004-39.
- (45) The muon “stub” in the muon systems must be within 7, 5, and 6 cm of the extrapolated COT track position, in the CMU, CMP, and CMX muon systems, respectively.
- Kotwal et al. (2003) A. V. Kotwal, H. K. Gerberich, and C.Hays, Nucl. Instrum. Meth. A, 506, 110 (2003), ISSN 0168-9002.
- (47) The maximum correction to the identification efficiency for central electrons is 1.7%, for “plug” electrons 6.3%, and for central muons is 7.4%.
- Aaltonen et al. (2008) T. Aaltonen, A. Abulencia, J. Adelman, et al., Phys. Rev. D, 77, 112001 (2008b).
*
Appendix A Lepton identification
We use standard CDF definitions for identification (ID) of electrons and muons as described below Abulencia et al. (2007). The same lepton ID requirements are applied to events from data and Monte Carlo simulations.
The identification and triggering efficiencies for leptons are different for events in data and Monte Carlo, although they demonstrate a very similar energy dependence. To eliminate this inconsistency we follow the standard CDF practice of using correction factors (“scale factors”) to re-weight the MC events (see Section A.3).
In order to maintain a high efficiency for bosons, for which we require two identified leptons, we define “tight” and “loose” selection criteria for both electrons and muons, as described below.
To reduce backgrounds from the decays of hadrons produced in jets, leptons are required to be “isolated”. The deposited in the calorimeter towers in a cone in space CDF of radius around the lepton position is summed, and the due to the lepton is subtracted. The remaining is required to be less than 10% of the lepton for electrons or for muons.
A.1 Electron selection
An electron candidate passing the “tight” selection must be central with , and have: a) a high quality track ele with or ; b) a good transverse shower profile at shower maximum that matches the extrapolated track position; c) a lateral sharing of energy in the two calorimeter towers containing the electron shower consistent with that expected; and d) minimal leakage into the hadron calorimeter had .
Additional central electrons, classified as “loose” electrons, are required to satisfy the “tight” central electron criteria but with a track requirement of (rather than ), and no requirement on a shower maximum measurement or lateral energy sharing between calorimeter towers. Electrons in the forward calorimeters (), also classified as “loose” electrons, are required to have , minimal leakage into the hadron calorimeter, a track containing at least 3 hits in the silicon tracking system, and a shower transverse shape consistent with that expected, with a centroid close to the extrapolated position of the track wen .
A.2 Muon selection
A muon candidate passing the tight cuts must have: a) a well measured track in the COT muo with ; b) energy deposited in the calorimeter consistent with expectations muo ; c) a muon “stub” Varganov (2004) in both the CMU and CMP, or in the CMX, consistent with the extrapolated COT track muo ; and d) a COT track fit consistent with an outgoing particle from a collision and not from an incoming cosmic ray Kotwal et al. (2003).
Additional muons, classified as “loose”, are required to have and to satisfy the same criteria as for tight muons but with relaxed COT track quality requirements. Alternatively, for muons outside the muon system fiducial volume, a loose muon must satisfy the tight muon criteria and an additional more stringent requirement on track quality, but the requirement that there be a matching “stub” in the muon systems is dropped.
A.3 Corrections due to Modeling of Electrons and Muons
Following the standard treatment of lepton efficiencies in CDF, we re-weight Monte Carlo events to take into account the difference between the identification efficiencies measured in leptonic decays and those used in simulation lep . We then make additional corrections for the difference in trigger efficiencies in simulated events and measured in data. Corrections to trigger efficiencies are typically 4% for trigger electrons, 8% for trigger muons that traverse both the CMU and CMP systems, and 5% for muons in the CMX system. The average weight for events is 0.939; for events it is 0.891.
We correct the energy of electrons and muons the same way as it was done for the measurement of the boson mass Aaltonen et al. (2008). The relative positions of the tracker wires were aligned using cosmic muons. Additional track-level corrections were derived using data to reduce bias between positive and negative particles. The electron energy was corrected in data for effects due to tower position and time (aging).