11email: pascal.borde@ias.u-psud.fr 22institutetext: Institut d’astrophysique de Paris, Université Paris 6 & CNRS (UMR 7095), 98 bd Arago, 75014 Paris, France 33institutetext: Observatoire de Haute-Provence, CNRS & OAMP, 04870 St-Michel l’Observatoire, France 44institutetext: Laboratoire d’astrophysique de Marseille, Université de Provence & CNRS (UMR 6110), 38 rue F. Joliot-Curie, 13388 Marseille, France 55institutetext: Institute of Planetary Research, German Aerospace Center, Rutherfordstrasse 2, 12489 Berlin, Germany 66institutetext: Laboratoire de l’univers et de ses théories, Observatoire de Paris & CNRS (UMR 8102), 5 place Jules Janssen, 92195 Meudon, France 77institutetext: Observatoire de Genève, Université de Genève, 51 Ch. des Maillettes, 1290 Sauverny, Switzerland 88institutetext: Department of Physics, Denys Wilkinson Building Keble Road, Oxford, OX1 3RH 99institutetext: Instituto de Astrofísica de Canarias, E-38205 La Laguna, Tenerife, Spain 1010institutetext: Departamento de Astrofísica, Universidad de La Laguna, E-38200 La Laguna, Tenerife, Spain 1111institutetext: Laboratoire d’études spatiales et d’instrumentation en astrophysique, Observatoire de Paris & CNRS (UMR 8109), 5 place Jules Janssen, 92195 Meudon, France 1212institutetext: Physikalisches Institut Universität Bern, Sidlerstrasse 5, 3012 Bern, Switzerland 1313institutetext: Rheinisches Institut für Umweltforschung an der Universität zu Köln, Aachener Str. 209, 50931 Köln, Germany 1414institutetext: Research and Scientific Support Department, European Space Agency, Keplerlaan, NL-2200AG, Noordwijk, The Netherlands 1515institutetext: Institute for Astronomy, University of Vienna, Türkenschanzstrasse 17, 1180, Vienna, Austria 1616institutetext: Institute of Astronomy, Geophysics and Atmospheric Sciences, University of São Paulo, Brasil 1717institutetext: Thüringer Landessternwarte, 07778 Tautenburg, Germany 1818institutetext: IAG, Université de Liège, Allée du 6 août 17, Liège 1, Belgium 1919institutetext: Université de Nice-Sophia Antipolis, CNRS UMR 6202, Observatoire de la Côte d’Azur, BP 4229, 06304 Nice Cedex 4, France 2020institutetext: Space Research Institute, Austrian Academy of Sciences, Schmiedlstr. 6, Graz, Austria 2121institutetext: Wise Observatory, Tel Aviv University, Tel Aviv 69978, Israel 2222institutetext: Center for Astronomy and Astrophysics, TU Berlin, Hardenbergstrasse 36, 10623 Berlin, Germany
Transiting exoplanets from the CoRoT space mission
Abstract
Aims. We report the discovery of CoRoT-8b, a dense small Saturn-class exoplanet that orbits a K1 dwarf in 6.2 days, and we derive its orbital parameters, mass, and radius.
Methods. We analyzed two complementary data sets: the photometric transit curve of CoRoT-8b as measured by CoRoT and the radial velocity curve of CoRoT-8 as measured by the HARPS spectrometer††thanks: Both data sets are available in electronic form at the CDS via anonymous ftp to cdsarc.u-strasbg.fr (130.79.128.5) or via http://cdsweb.u-strasbg.fr/cgi-bin/qcat?J/A+A/vol/page..
Results. We find that CoRoT-8b is on a circular orbit with a semi-major axis of AU. It has a radius of , a mass of , and therefore a mean density of g cm-3.
Conclusions. With 67 % of the size of Saturn and 72 % of its mass, CoRoT-8b has a density comparable to that of Neptune (1.76 g cm-3). We estimate its content in heavy elements to be 47–63 , and the mass of its hydrogen-helium envelope to be 7–23 . At 0.063 AU, the thermal loss of hydrogen of CoRoT-8b should be no more than % over an assumed integrated lifetime of 3 Ga.
Key Words.:
planetary systems – stars: fundamental parameters – techniques: photometric – techniques: spectroscopic – techniques: radial velocities1 Introduction
CoRoT (Convection, Rotation and planetary Transits), a joint project of France, Austria, Belgium, Brazil, ESA, Germany, and Spain, is a low-Earth orbit visible photometer designed to measure stellar light curves (LCs) for two main astrophysical programs: asteroseismology and exoplanet detection (Baglin et al. 2006). Instrument characteristics and inflight performance can be found in Auvergne et al. (2009). CoRoT was launched on December 27, 2006 and will be operated by the French Centre National d’Études Spatiales (CNES) until March 31, 2013.
The search for exoplanets in CoRoT LCs consists in looking for periodic dips caused by exoplanets whose edge-on orbits make them transit in front of their host stars. Study of transit signals combined with ground-based radial velocity follow-up observations leads to complete orbital solutions, as well as exoplanet masses and radii. It is with these systems that we learn the most about exoplanetary internal structures, atmospheres, and dynamics (for a review, see Charbonneau et al. 2007). Compared to ground-based transit surveys, CoRoT offers uninterrupted photometric time series for up to about 150 days with relative errors as low as about 100 ppm per hour. This makes it possible to hunt for exoplanets that are only twice as big as the Earth in tight orbits, as demonstrated by the recent discovery of CoRoT-7b (Léger et al. 2009; Queloz et al. 2009).
This paper reports the discovery and characterization of CoRoT-8b, a hot and dense small Saturn-class exoplanet in a 6.2-day orbit around a K1 dwarf star. We start by describing CoRoT LC analysis and transit parameter measurements. We then report ground-based follow-up observations and derive the full orbital and physical solution. After a look at transit timing variations and differential limbdarkening, we close this paper with a discussion about CoRoT-8b’s possible composition.
2 CoRoT-8 photometric observations
CoRoT performs photometric measurements by onboard summation of all the photo-electrons collected during unit exposures of 32 s inside a predefined zone of the CCD matrix called a photometric mask. At the beginning of a run, every target star receives a mask whose shape is optimized given the star magnitude and environment. Mask sizes, ranging from about to pixels or to arcsec on the sky, are fairly large in order to accomodate CoRoT defocused point-spread functions (PSFs). On the one hand, defocusing improves the photometric precision and reduces the sensitivity to telescope jitter, but on the other, it increases the probability of PSF overlaps that may bias the photometry (if left uncorrected) or cause transit false alarms (if a neighbor is an eclipsing binary). In the exoplanet channel, PSFs are not only defocused but also slightly dispersed by a biprism. Thus, for a subset of stars, CoRoT delivers three LCs instead of one by division of their masks into three submasks along the dispersion direction. These “color LCs” are referred to as the red, green, and blue LCs, regardless of their true spectral content (and with no link whatsoever to any usual photometric system).
CoRoT-8 is one of the 11 408 target stars observed by CoRoT during the first long run in constellation Aquila (LRc01 for short) from May 16, 2007 to October 5, 2007. Cabrera et al. (2009) review all planetary transit candidates for this field, including CoRoT-8, which is referred to as LRc01 E2 1145-CHR-0101086161. This star belongs to the subset of 3719 stars for which color LCs are available (CHR stands for chromatic). The standard CoRoT pipeline (version 2.1 at this date) produces 4 LCs in this case: one for every color and a “white” LC derived from the sum of colors. However, only the white LC receives proper telescope jitter noise correction, which is the reason color LCs have not been extensively studied in the previous papers of this series. For this study, we processed the white LC further by removing systematics effects as prescribed by Mazeh et al. (2009), and we applied a generalization of this treatment to the colors (Mazeh et al., in preparation).
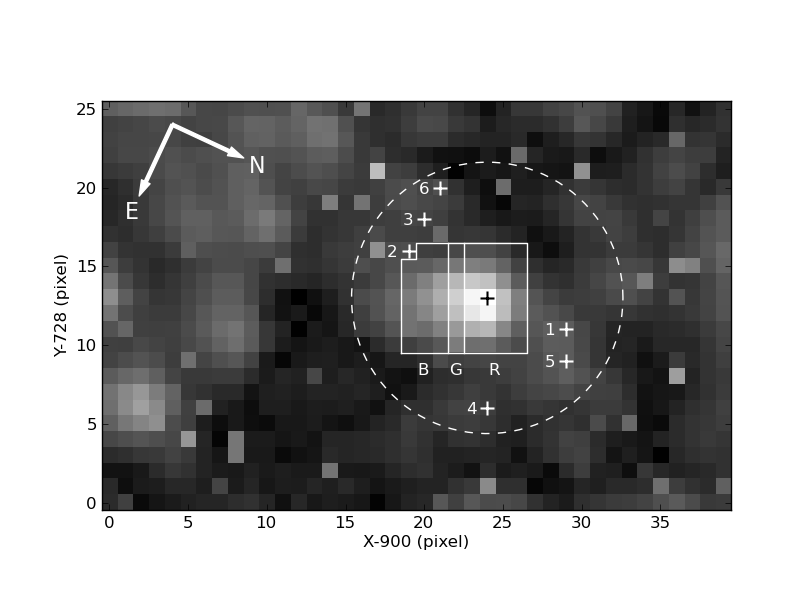
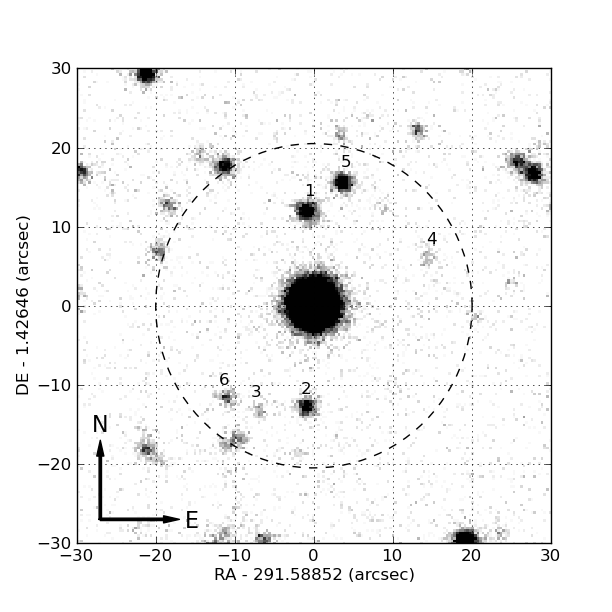
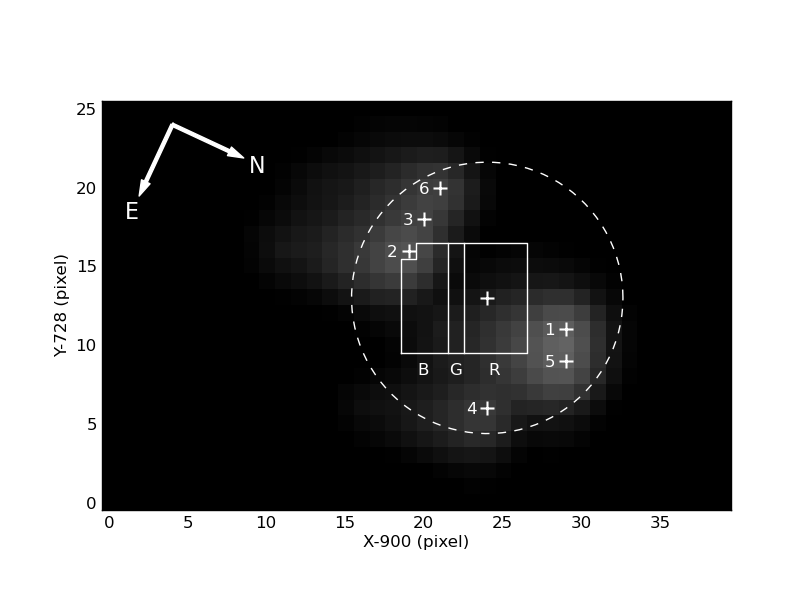
At this stage, none of these LCs is corrected for the fluxes of neighboring stars that leak into the target star mask. Exodat, the CoRoT entry database (Deleuil et al. 2009), provides the necessary information to remove the contributions from these contaminants. An estimate of the contamination for the white LC is readily available (1.6 % in the case of CoRoT-8) but is computed with a generic mask prior to begining-of-run mask affectation. To get a more precise estimate of the contamination for the white, as well as nonexisting estimates for the colors, we superimposed inflight measured PSFs at the locations of the six main contaminants scaled with respect to their Sloan-Gunn magnitudes (Table 1), then integrated their fluxes inside CoRoT-8’s mask and submasks. Figure 1 displays the long exposure taken at the begining of LRc01, CoRoT-8’s mask, and the locations of the contaminants. For orientation, Fig. 2 is an image of the neighborhood of CoRoT-8 taken in 2004 with the Wide Field Camera (WFC) at the 2.5-m Isaac Newton Telescope (INT) at La Palma. Figure 3 is a computed version of Fig. 1 that ignores everything but CoRoT-8’s and contaminants. This calculation yields new contamination estimates of 0.9 % for the white, 2.4 % for the blue, 0.2 % for the green, and 0.7 % for the red. In the following, LCs are corrected using these values.
| Star | RA (deg) | DE (deg) | ||||
|---|---|---|---|---|---|---|
| CoRoT-8 | 291.58852 | 1.42646 | 924 | 741 | 14.8 | 14.3 |
| Cont. #1 | 291.58839 | 1.42976 | 929 | 739 | 18.8 | 18.3 |
| Cont. #2 | 291.58826 | 1.42280 | 919 | 744 | 19.1 | 18.8 |
| Cont. #3 | 291.58652 | 1.42269 | 920 | 746 | 20.7 | 20.1 |
| Cont. #4 | 291.59267 | 1.42809 | 924 | 734 | 20.7 | 20.1 |
| Cont. #5 | 291.58967 | 1.43077 | 929 | 737 | 19.0 | 18.6 |
| Cont. #6 | 291.58537 | 1.42313 | 921 | 748 | 20.3 | 19.7 |
CoRoT-8’s 142.1-day long LCs consist of a first section of 11 496 measurements with 512-s sampling period (sixteen 32-s unit exposures coadded onboard) and lasting 68.3 days. On the basis of this first section, the transit search pipeline called Alarm Mode (Surace et al. 2008) that continuously scrutinizes CoRoT LCs during a run, detected a transit-like signal and stopped unit-exposure onboard coaddition so that the remainder of this promising LC (198 752 measurements, 73.7 days) could benefit from a finer sampling period of 32 s. This action also triggered the beginning of ground-based follow-up operations: on-off transit photometry with the 1.2-m telescope at Observatoire de Haute-Provence (OHP) in France showed that the transit signal could not originate in any of the contaminants, so radial velocity (RV) spectrometry described in Sect. 5 was also started.
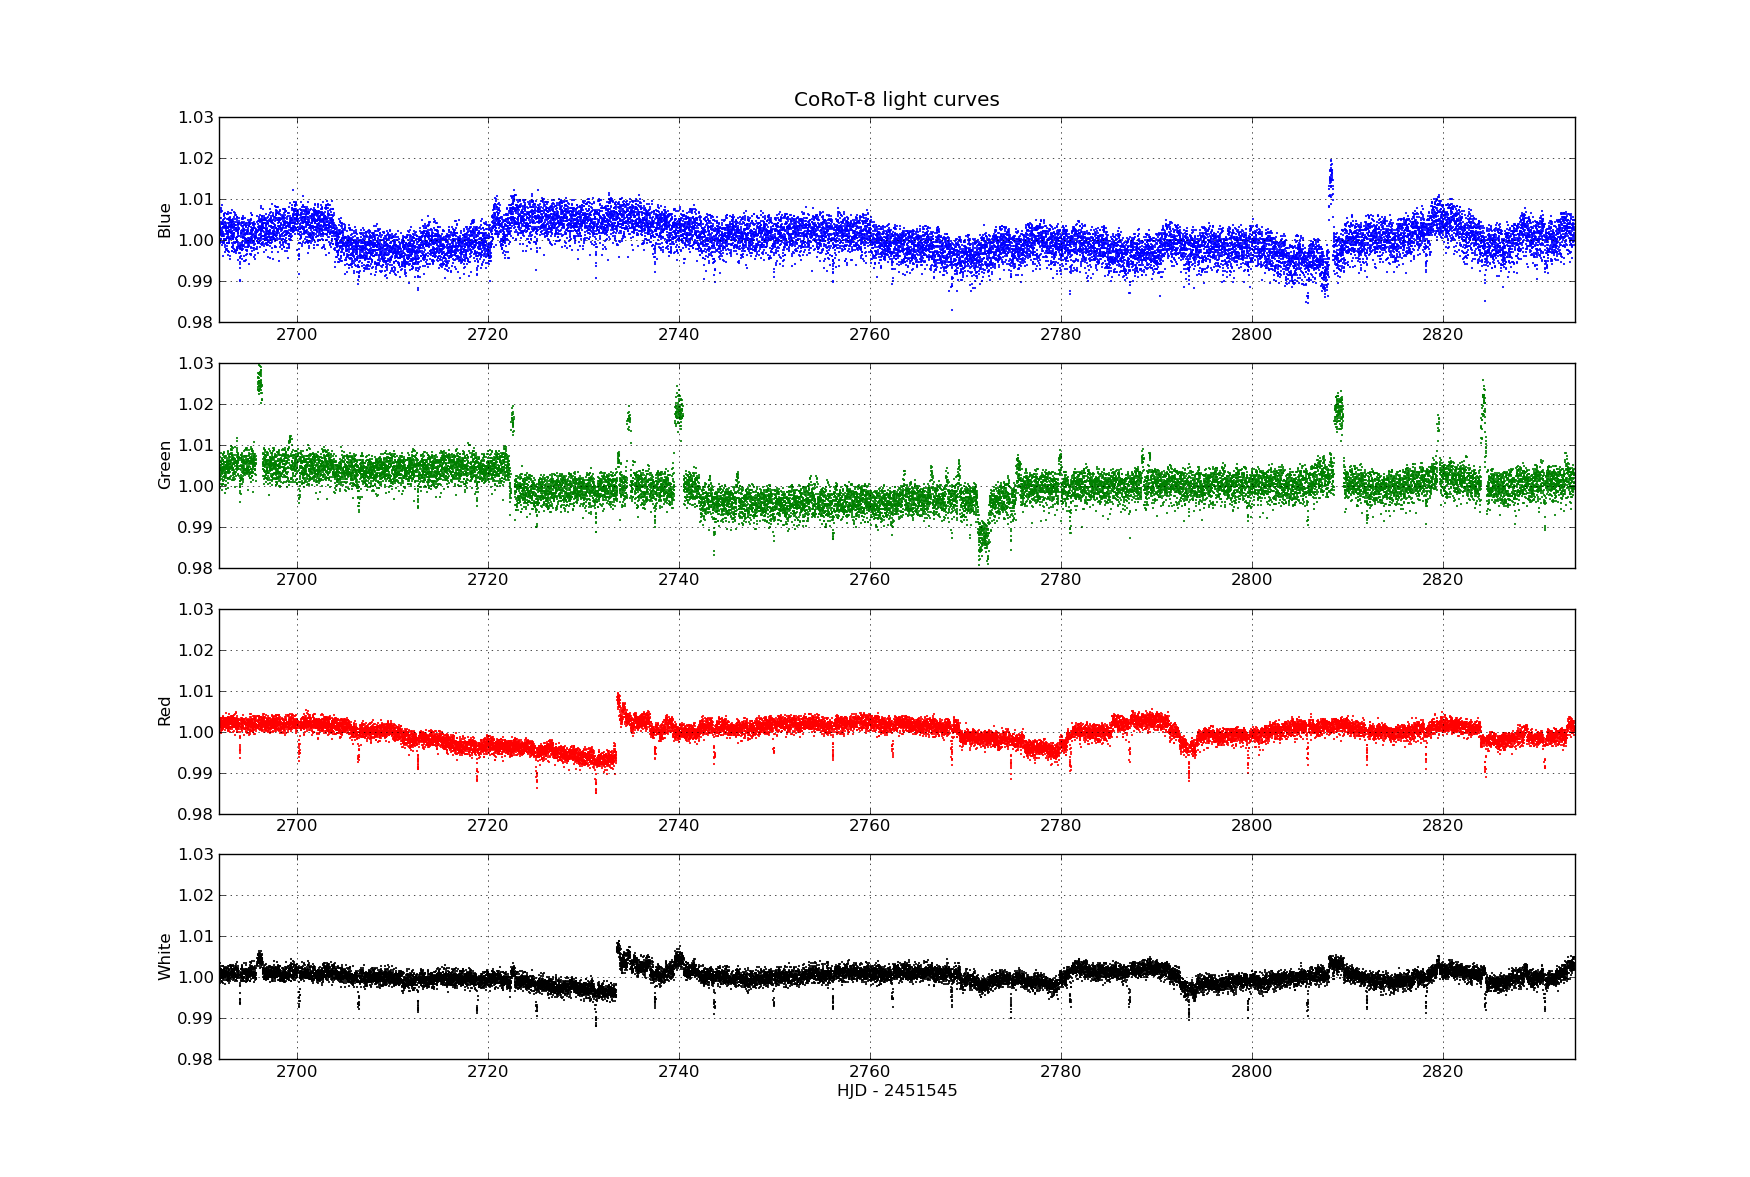
Figure 4 shows the fully processed LCs (including systematics removal and contamination correction) rebinned to a uniform 512-s sampling period. The blue, green, and red fluxes amount to about 13 %, 14 %, and 73 %, respectively, of the total flux collected inside the photometric mask. Twenty-three transits with relative depths of about 1 % can easily be seen by eye in the white and the red, are more difficult to see in the green, and are barely visible in the blue. Discontinuities are caused by energetic particles (mostly protons) from the Van Allen radiation belts that hit CoRoT when it crosses the South-Atlantic Anomaly (SAA, Pinheiro da Silva et al. 2008). They differ from one color to the next depending on the locations of the pixels impacted by SAA protons. The green LC seems to be more polluted than the other two. Overall, these LCs do not show obvious signs of stellar activity, in contrast to CoRoT-7, for instance, where quasi-periodic modulations could be used by Léger et al. (2009) to estimate the stellar rotation period.
3 White transit signal modeling
We begin by measuring the transit signal properties by least-square fitting to the white LC of a periodic trapezoidal model with 5 parameters: the period , the ingress start time , the ingress duration (taken as equal to the egress duration ), the bottom-part duration , and the relative depth .
We obtain first estimates of , , the full transit duration , and by maximizing the cross-correlation with a periodic square-shape transit as explained by Bordé et al. (2007). The white LC is then chopped in 23 transit-centered segments lasting . We normalize each segment and correct for local baseline flux variations by dividing by a parabola fitted to the out-of-transit flux variations. Then, we proceed to the least-square fitting of the 5-parameter trapezoid model described above, assuming measurement errors to be identical and equal to , the standard deviation of out-of-transit measurements. We find that days, HJD, , min, and min with .
We keep the determined period and ingress start time for what follows, and we go on by fitting the white LC with a classical model that describes the transit of an opaque black disk (the planet) in front of a limb-darkened (LD) luminous disk (the star). The normalized measured flux is , where is the flux occulted by the planet and the flux emitted by the star. If is the normalized centro-symmetric LD profile of the star and the normalized distance to the star center, then the total flux emitted by the star is . Denoting as the ratio of the planet radius to the star radius, the flux occulted by the planet at linear distance from the star center can be computed via
| (1) |
if , and with
| (2) |
if . Besides,
| (3) |
where is the semi-major axis, the orbit inclination, the orbital period, and the central time of the first transit. To consider the effect of signal integration over 512-s exposures, our model is computed every 8 s, then numerically integrated over 64 points. In the course of our work on CoRoT planets, this set of equations and its numerical implementation have been checked against other published approaches (Mandel & Agol 2002; Giménez 2006).
From Eqs. 1–3, we see that this model’s parameters are the radius ratio , the scaled semi-major axis , the orbital inclination , the transit central time , and the orbital period , plus usually 1–4 LD parameters depending on the form given to . In the following, we do not fit and , but instead take the values obtained with the trapezoid model, and use the quadratic LD law (where the fitted LD parameters are actually and ). Therefore, we have a total of 5 parameters to determine.
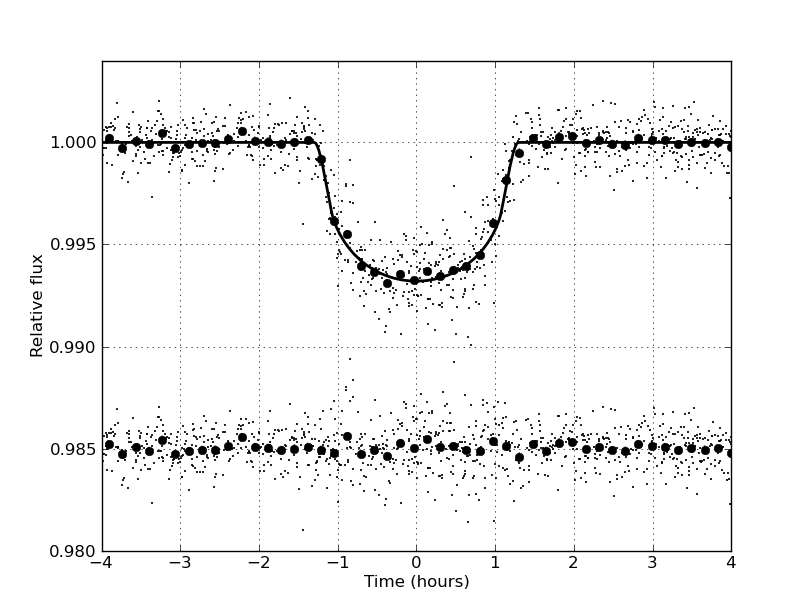
Parameter optimization, done by way of a genetic algorithm called Harmony Search (Geem et al. 2001), leads to , , ∘, , and with (Fig. 5). Individual parameter errors were found by increasing from to as prescribed by Press et al. (1997). From the scaled semi-major axis and the period, we obtain (via Kepler’s third law) in solar units, hence a stellar density g cm-3 (see Table 5 for a summary). To compute the planet radius, we now need to discuss the star properties.
4 CoRoT-8 stellar parameters
CoRoT-8 was observed with the UVES spectrograph on the VLT (program 081.C-0413) on September 2 and 3, 2008. We used the Dic1 mode (346+580) and a slit width of that provides a resolving power of . The total exposure time was 4760 s, divided into two exposures. The data were reduced using our own reduction software to optimize the spectrum extraction. The spectra were divided by the blaze function and put at rest by subtracting the systemic radial velocity. We obtained a signal-to-noise ratio () of about 170 per resolution element at 550 nm.
The fundamental parameters of the star were first estimated with this spectrum. Later, we took advantage of the series of HARPS spectra to refine the estimates of and the micro and macro-turbulent velocities, which all benefit from the much higher spectral resolution of HARPS. To that purpose, among the HARPS spectra collected for the radial velocity analysis (Sect. 5), we selected those that were not contaminated by Moon light. Nine spectra were finally co-added, yielding an average spectrum with per resolution element at 550 nm.
The star is a slow rotator since the rotational broadening is lower than the spectral resolution of HARPS. Using the synthesis of a set of isolated lines, we determined a projected rotational velocity of km s-1, and a macroturbulent velocity of km s-1. For the spectroscopic analysis, we followed the same methodology as for the previous CoRoT planets since CoRoT-3b. The analysis was performed using two spectral synthesis packages, VWA (Bruntt et al. 2002) and SME (Valenti & Piskunov 1996; Valenti & Fischer 2005) as described in details by Bruntt (2009).
For such a late type star that is metal rich, the continuum placement could be a serious issue at wavelengths shorter than 550 nm owing to molecular bands and the high level of blending of weak metal lines. We therefore concentrated our spectroscopic analysis on well-defined spectral lines at longer wavelengths. We used the Ca i lines at 612.2, 616.2, and 643.9 nm as surface gravity diagnostics instead of the usual Mg ib or Na i lines. This overcomes the issue of continuum placement for such broad lines with extended wings when observed with an echelle spectrum. To provide an additional check of our effective temperature determination, we compared the line profile outside of the core to theoretical profiles, following the method recommended in Sect. 3.3 of Bruntt et al. (2004). The result agrees with our estimates obtained independently with VWA and SME. Our final atmospheric parameters, , , and global metallicity estimates are given in Table 5. The results from the detailed elemental abundances analysis are summarized in Table 2. These correspond to a slowly rotating K1 main-sequence star with noticeable metal enrichment.
To estimate the mass and the radius of the host star, we combined the constraints from the spectroscopic parameters ( and [M/H]) and , the proxy for stellar density derived from the transit physical model (see Sect. 3 and Table 5). The spectroscopic analysis of our spectra gave no evidence of youth: the Li i line at 670.78 nm is absent and the star’s spectra display no hint of chromospheric activity. This is consistent with the low rotational velocity we measured. Using STAREVOL stellar evolutionary tracks (Siess 2006, Palacios, private communication), we thus excluded evolutionary tracks corresponding to pre-main sequence stages and assumed that the star is on the main sequence. In this way, we obtained a stellar mass of and furthermore inferred a stellar radius of . The corresponding surface gravity is in good agreement with the spectroscopic value of .
Concerning limb-darkening, we also note fair agreement between measured values reported in Sect. 3, and , and theoretical estimates computed for the CoRoT bandpasses by Sing (2010): and (for K, , and =0.3). Achieving consistency in both surface gravity and limb-darkening is a good indication that the determined orbital and physical parameters are reliable. Therefore, we can safely derive a planetary radius of , which is 1.7 times the radius of Neptune and 0.7 times that of Saturn.
| Element | [X/H] | number |
|---|---|---|
| of lines | ||
| Mg i | 0.16 (0.16) | 3 |
| Ca i | 0.31 (0.05) | 4 |
| Ti i | 0.26 (0.05) | 14 |
| V i | 0.49 (0.07) | 16 |
| Fe i | 0.31 (0.05) | 96 |
| Fe ii | 0.32 (0.06) | 8 |
| Co i | 0.30 (0.07) | 6 |
| Ni i | 0.34 (0.05) | 30 |
| Si i | 0.37 (0.05) | 18 |
5 Radial velocity spectrometry
We performed RV observations of CoRoT-8 with the SOPHIE spectrograph (Perruchot et al. 2008; Bouchy et al. 2009a) at the 1.93-m telescope located at OHP, and the HARPS spectrograph (Mayor et al. 2003) at the 3.6-m ESO telescope at La Silla Observatory (Chile). These two instruments are cross-dispersed, fiber-fed, echelle spectrographs dedicated to high-precision Fizeau-Doppler measurements. SOPHIE was used in its high-efficiency mode (spectral resolution of 40 000). HARPS and SOPHIE were both used in the obj_AB observing mode, where the second fiber was made available for monitoring the background Moon light at the cost of no simultaneous Th-Ar lamp calibration. This is made possible thanks to the remarkable intrinsic stability of these spectrographs. Indeed, the contribution of instrumental drift to the global RV errors was always negligible with respect to the photon noise error. HARPS and SOPHIE data were reduced with the standard pipeline based on the work by Baranne et al. (1996), Pepe et al. (2002), and Bouchy et al. (2009a). In the case of CoRoT-8, radial velocities were derived by cross-correlating the acquired spectra with a numerical K5 mask.
The first two measurements on CoRoT-8 were made with SOPHIE on August 2007 and showed no significant RV variations at the level of 50 m s-1. As such, they were compatible with a planetary companion lighter than 1 , so it called for more observations. Nine more measurements were obtained with HARPS between the end of July 2008 and the end of September 2008 (ESO program 081.C-0388). Although they yielded RV variations in phase with the ephemerides computed from the CoRoT-8 light curve, they did not allow by themselves properly constraining of the orbit, and above all completely ruling out the presence of a blended binary (a background eclipsing binary not angularly separated from CoRoT-8 by the 3.6-m ESO telescope). Therefore, ten additional HARPS measurements were acquired to secure the planetary origin of the CoRoT transits from June to August 2009 (ESO program 083.C-0186).
All RV measurements (Table 3) are displayed in Fig. 6. The SOPHIE data were shifted by 105 m s-1for this plot. Several spectra of the third campaign were slightly contaminated by Moon light. We attempted to correct for the Moon signal, but it only introduced more noise and did not significantly affect the target RV values. (The Moon RV was different enough from that of the target.) We concluded from this study that Moon contamination could be safely ignored in our case.
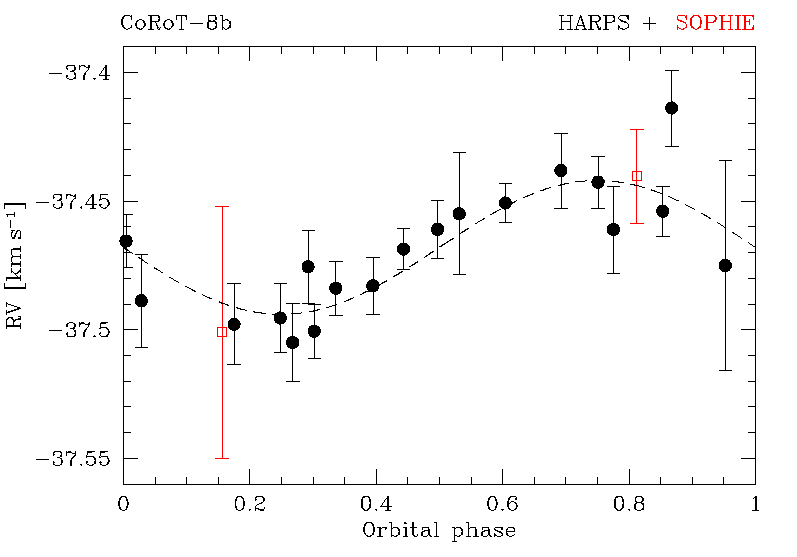
The period-folded radial velocities in Fig. 6 present clear variations in phase with ephemerides derived from CoRoT transits, in agreement with what would be expected for the reflex motion due to a planetary companion. We fitted RV data with a Keplerian model assuming a circular orbit and found a systemic RV of km s-1and an RV semi-amplitude of m s-1with (showing that the standard deviation of the residuals equal to m s-1has the same order of magnitude as the individual RV errors).
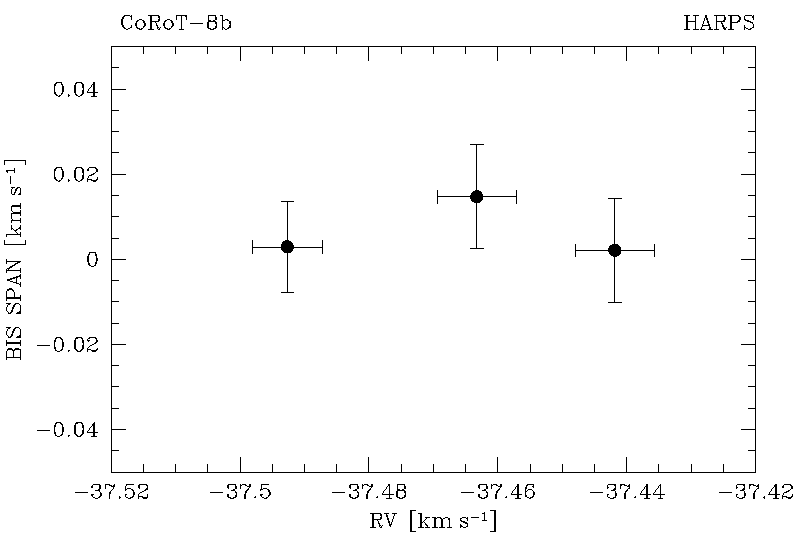
To examine the possibility that the radial velocity variation is caused by a blended binary, we followed the procedure described in Bouchy et al. (2009b). It consists in checking the spectral line assymmetries, as well as the dependence of RV variations on the cross-correlation mask used to compute the cross-correlation function (CCF). Spectral line assymetries are revealed by the calculation of the bisector span of the CCF. To increase the signal-to-noise ratio, we first averaged CCFs around orbital phases of 0.25, 0.5, and 0.75: six, five, and five CCFs were thus averaged in orbital phase intervals 0.15–0.35, 0.40–0.61, and 0.65–0.86, respectively. Bisector spans computed on these three averaged CCFs show no significant correlation with the RV as can be seen in Fig. 7, since the value of the bisector span variation is less by a factor of five than the radial-velocity semi-amplitude . Furthermore, RV computed with different cross-correlation templates (for F0, G2, and K5 stars) do not correlate with the amplitude of RV.
These two checks are common tools for discarding the blended binary scenario and confirming the planetary nature of transiting planets. However, to support this conclusion further, we also contemplated the two scenarios: 1) a triple system, and 2) a background eclipsing binary blended with CoRoT-8. In the first case, it was found that only a brown-dwarf companion orbiting an M dwarf could produce the same RV and bisector signals. However, such a system would have a relative transit depth twice as large as the one measured by CoRoT. In the second case, the velocity of CoRoT-8 and the systemic velocity of the background binary would have to be the same at the level of 1 km/s in order to give a symmetrical spectroscopic signal. This would be very unlikely when considering the dispersion of the velocity distribution in the Galaxy. Therefore, the most probable cause of the RV signal is a planetary companion to CoRoT-8.
CoRoT-8b’s mass (in ) can then be computed as , where is in m s-1, in , and in days. We find , 4.1 times the mass of Neptune and 0.7 times that of Saturn. Other stellar and planetary parameters can be found in Table 5.
Finally, no significant offset was found between the two sets of HARPS measurements separated by one year, thus excluding the presence of an additional massive giant planet at a few AUs in the system.
| BJDa𝑎aa𝑎aBarycentric Julian Date | RV | 1- error | exp. time | S/N p. pix. |
| (km s-1) | (km s-1) | (s) | (at 550 nm) | |
| SOPHIE | ||||
| 54314.40776 | 0.0490 | 3600 | 12.15 | |
| 54318.41015 | 0.0184 | 3600 | 17.00 | |
| HARPS | ||||
| 54675.69652 | 0.0151 | 2700 | 9.20 | |
| 54678.66557 | 0.0101 | 2700 | 12.20 | |
| 54679.73180 | 0.0407 | 2700 | 4.60 | |
| 54682.68436 | 0.0112 | 2700 | 11.20 | |
| 54700.57459 | 0.0140 | 2700 | 8.90 | |
| 54703.59565 | 0.0169 | 2700 | 8.40 | |
| 54732.56202 | 0.0080 | 3600 | 14.50 | |
| 54733.58576 | 0.0077 | 3600 | 14.80 | |
| 54737.58497 | 0.0134 | 3600 | 10.30 | |
| 54987.78368 | 0.0237 | 3600 | 7.82 | |
| 54988.84456 | 0.0146 | 3600 | 10.92 | |
| 54989.83528 | 0.0098 | 3600 | 14.77 | |
| 54991.85115 | 0.0157 | 3600 | 10.74 | |
| 54992.80807 | 0.0106 | 3600 | 13.68 | |
| 54993.87346 | 0.0113 | 3600 | 13.30 | |
| 54998.85102 | 0.0106 | 3600 | 12.20 | |
| 55021.82951 | 0.0102 | 3600 | 14.22 | |
| 55045.74089 | 0.0148 | 3600 | 10.95 | |
| 55046.73467 | 0.0179 | 3600 | 9.47 | |
6 Search for another body by transit timing
In this section, we look for transit timing variations (TTVs) in the white LC that may be caused by a gravitational perturber (e.g., Sartoretti & Schneider 1999; Schneider 2003). To do this, we fit a trapezoid to each transit separately in which the ingress time, , is the only free parameter and other parameters are held constant at the values reported at the beginning of Sect 3.
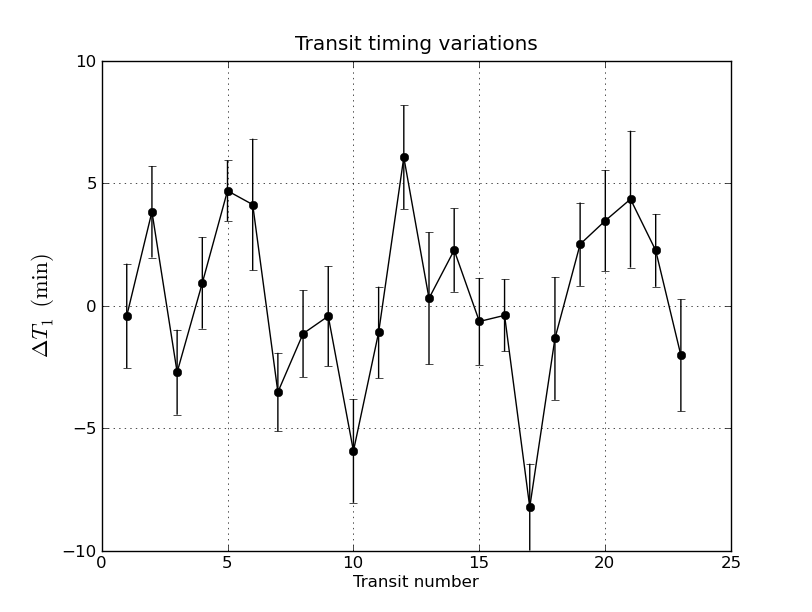
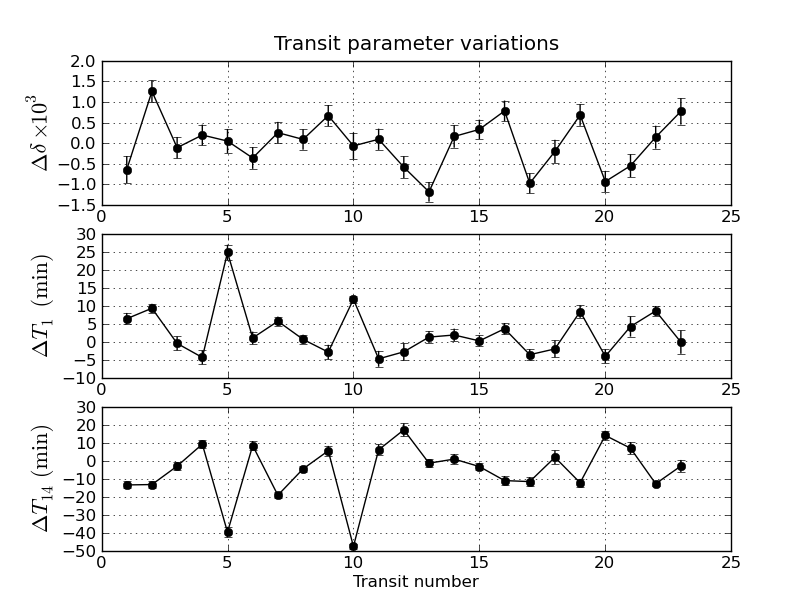
We find variations that seem to be statistically significant (Fig. 8) and whose autocorrelation curve peaks at days. However, we cannot be assured that these variations are gravitational in origin. To see whether they might be caused by stellar activity in the LC, we performed a dedicated analysis of the LC long-term variations to measure the stellar rotation period. For this purpose, we selected the red LC as the best compromise between the photometric precision and the number of discontinuities (Fig. 4). We corrected this LC for two main discontinuities around dates 2733 and 2824 and removed data points inside the transits. The autocorrelation of the resulting LC has a weak local maximum around 20 days ( days). If we cut this 142-day LC into three thirds lasting about 47 days each, we again find weak local maxima around 20 days for the first and the third thirds, but not for the second one. Although uncertain, this tentative signal around 20 days might still reflect the rotation period of the star. Indeed, if we combine the measurements for , , and , we derive a loosely constrained stellar rotation period of days. Now, activity-induced TTVs may be periodic if the planet transits repeatedly above the same stellar surface features, which implies that the ratio of the stellar rotation period to the planet orbital period be a rational number. If days is closer to the true stellar rotation period than days, this may explain why there seem to be a TTV signal at about twice the stellar rotation period.
We also explored transit-to-transit variations of , , and at the same time by fitting trapezoids to individual transits where , , , and are now all free parameters. Figure 9 displays the resulting variations, denoted , , and , as a function of the transit number. The last two variations are obviously highly anti-correlated (with a correlation coefficient of ) showing that variations in date actually reflect variations in duration. As this should not be the case for a gravitational pertuber, we are inclined to believe that the TTVs we measure are more likely to be the effect of stellar noise.
7 Differential limb-darkening
With its photometry in three colors, CoRoT makes it possible in principle to study differential stellar limb-darkening. However, if the photometric accuracy in the red is comparable to the white, it is not the case for the green and the blue where the collected flux is about five times lower than in the red (Sect. 2). Indeed, the standard deviation of out-of-transit measurements is for the red, and jumps to for the blue and for the green. Moreover, satellite jitter noise and contamination by neighboring stars (Sect. 2) increase the difficulty of this endeavor. Nevertheless, we make a first attempt here to study CoRoT-8b’s transit in the CoRoT colors.
As a start, we first used the same trapezoidal model as for the white but we fixed , , and at the values obtained with the white LC (as we do not expect variations here), and fit only for and . We find that the transit ingress duration is longer in the blue (51 min) than in the green (46 min) and longer in the green than in the red (39 min), which is the expected effect of the more pronounced star limb-darkening at shorter wavelengths, and this seems encouraging. The blue transit () is also slightly deeper than the green (), as expected, but is unfortunately not deeper than the red (), which suggests that color corrections might still not be accurate enough for CoRoT-8.
Nevertheless, if we attempt to model the color transits with the white model from Sect. 3 by holding constant , , and , and letting and vary, we do measure limb-darkening parameters for the colors (Table 4), but with a moderate fit quality in the green and the blue.
| LC | ||
|---|---|---|
| white | ||
| blue | ||
| green | ||
| red |
It also worth reporting that, when , , and are included as free parameters in the modeling of the three colors taken separately, the obtained best-fit values for these parameters are all consistent with the white solution. This consistency check brings further evidence that the transiting object is a genuine exoplanet.
8 Discussion
| CoRoT-ID | 0101086161 |
|---|---|
| CoRoT-WinID | LRc01-E2-1145 |
| GSC 2.3 | N29S083644 |
| Coordinates (J2000) | 19:26:21.245 +01:25:35.55 |
| Magnitudes B, V, r’, i’ | 16.10, 14.80, 14.27, 13.41 |
| Results from light-curve analysis | |
| Planet period, | days |
| Transit epoch, | HJD |
| Transit duration, | h |
| Transit relative depth, | |
| Radius ratio, | |
| Scaled semi-major axis, | |
| Orbital inclination, | ∘ |
| Impact parameter, | |
| Limb-darkening coefficients, , | , |
| Stellar density, | g cm-3 |
| (solar units) | |
| Results from radial velocity observations | |
| Radial velocity semi-amplitude, | m s-1 |
| Orbital eccentricity, | 0 (fixed) |
| Systemic radial velocity | km s-1 |
| Results from spectral typing | |
| Spectral type | K1V |
| Effective temperature, | K |
| Surface gravity, | (cgs) |
| Metallicity, | |
| Micro-turbulent velocity, | km/s |
| Macro-turbulent velocity, | km/s |
| Rotational velocity, | km s-1 |
| Star mass, | |
| Star radius, | |
| Star age | Ga |
| Star distance | pc |
| Absolute physical parameters from combined analysis | |
| Planet mass, | |
| Planet radius, | |
| Planet density, | g cm-3 |
| Planet orbital semi-major axis, | AU |
With a transit depth of about 7 mmag, a transiting planet like CoRoT-8b is almost impossible to detect for ground-based photometric surveys that are not sensitive to giant planets smaller than Saturn: only HAT-P-11 b (Bakos et al. 2010) with a smaller transit depth (4.3 mmag) was detected by a ground-based photometric survey. CoRoT-7b (0.3 mmag, Léger et al. 2009) and Kepler-4b (0.9 mmag, Borucki et al. 2010) were both detected by space-based photometric surveys, whereas GJ 436 b (0.6 mmag, Gillon et al. 2007) and HD 149026 b (2.6 mmag, Sato et al. 2005) were both detected by RV surveys prior to their photometric observations.
With the exception of CoRoT-10 (V = 15.2, Bonomo et al., in preparation), CoRoT-8 (V = 14.8) is the faintest star harboring a planet found by the CoRoT survey. It is also relatively faint by RV standards, so that about 20 HARPS measurements (totalizing about 20 hours of telescope time) split over two campaigns were needed to definitively establish the planetary nature and constrain the mass of CoRoT-8b within 14 %.
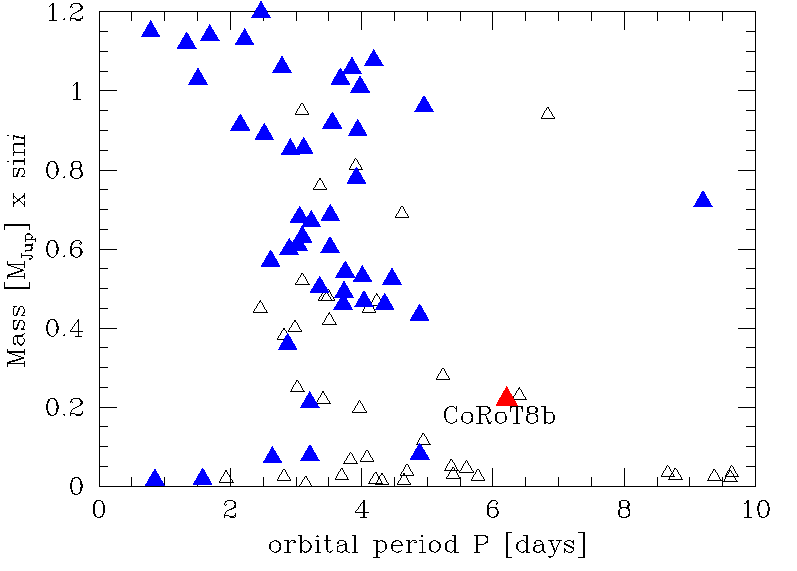
Radial velocity surveys do not find a lot of planetary companions at close distances ( days) with masses comparable to CoRoT-8b. In the mass-period diagram (Fig. 10), CoRoT-8b appears in between hot-Jupiter and super-Earth populations. This could challenge the existence of a bi-modal distribution (Mordasini et al. 2009), or CoRoT-8b might belong to the distribution tail of giant gaseous planets.
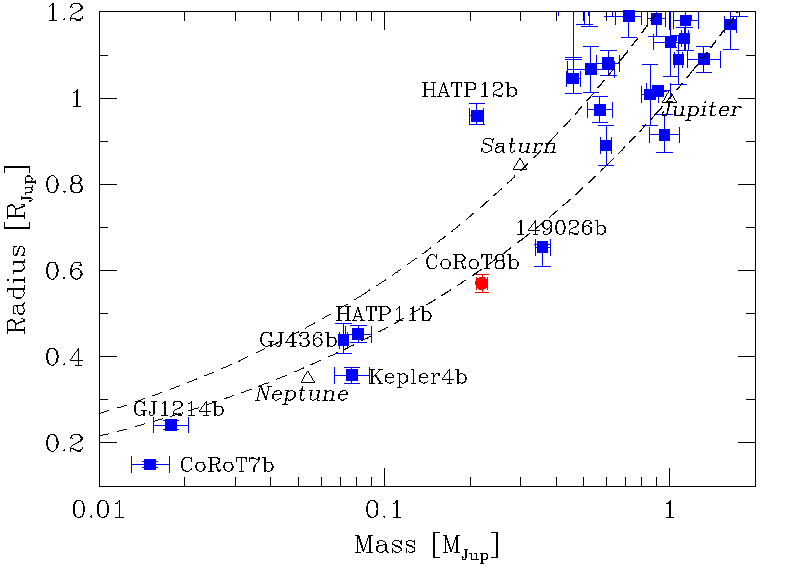
CoRoT-8b has a density of 1.6 g cm-3 (Fig. 11), which is higher than for Saturn (0.69 g cm-3), but comparable to Neptune (1.76 g cm-3) or HD 149026 b (1.7 g cm-3). The last orbits at 0.043 AU from its host star and has similar mass and radius to CoRoT-8b (0.36 , 0.65 ). By contrast, the density of HAT-P-12b (0.21 , 0.96 ) that orbits at 0.038 AU from its host star is only 0.32 g cm-3.
We estimate the thermal loss of hydrogen from CoRoT-8b by applying the method described by Lammer et al. (2009). According to the expected evolution of the soft X-rays and EUV flux of K stars and CoRoT-8b’s orbit location at 0.063 AU, the planet lost not more than about 0.045–0.12 % over an assumed integrated lifetime of 3 Ga. The lower mass-loss value corresponds to a heating efficiency of 10 % and the higher value to a heating efficiency of 25 %. From this estimation we can conclude that CoRoT-8b has only slightly evolved since its formation.
To constrain the planetary composition, we combine stellar and planetary evolution models. The stellar evolution models are based on CESAM (Morel & Lebreton 2008), include the diffusion of chemical elements in the star’s radiative zone, and are calibrated to match our Sun for a mass of , a metallicity , and an age of 4.5 Ga. A grid of models is computed as a function of mass, metallicity, and age. The two major constraints used are CoRoT-8’s stellar density and effective temperature. For a given model, we define
| (4) |
which may be considered as the number of standard deviations from the combined constraints with corresponding standard deviations . We look for models where is small and at least less than 3. (The constraint on the spectroscopically-determined value was found to be too weak to be useful.) Among these models, we select only the ones which have the right metallicity at the age considered, i.e., . Since we account for chemical diffusion, the value of gets progressively lower with time. For a metal-rich star like CoRoT-8b, this favors slightly younger ages, but the star’s low mass makes the effect very small.
The corresponding constraints on the planetary parameters are then derived using the photometric and radial velocity constraints. Planetary evolution models are calculated with standard hypotheses (e.g., Guillot 2008): we assume that the planet is made of a central rock/ice core of variable mass and of an overlaying envelope of solar composition. Given that the planet is farther from its star than most other transiting planets, we do not consider the possibility of additional energy input from stellar tides.
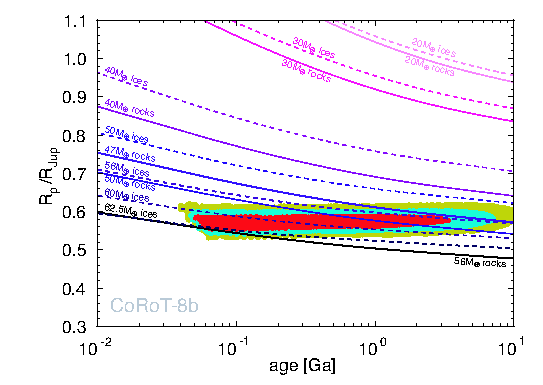
The results in terms of planetary size as a function of system age are shown in Fig. 12. The colored areas indicate the constraints derived from the stellar evolution models, for values of , 2, and 3, respectively. The age constraints are relatively weak but favor values below 3 Ga. The planetary radius is tightly constrained, on the other hand. The amount of heavy elements that are found to bound the surface are 47 to 56 of rocks or 56 to 62.5 of ices.
With a density comparable to that of Neptune, CoRoT-8b has a mass of heavy elements similar to that of HD 149026 b (Sato et al. 2005; Ikoma et al. 2006), but a much smaller hydrogen-helium envelope. As for HD 149026, the parent star is metal-rich, confirming the trend that metal-rich stars tend to form giant planets with high contents in heavy elements (Guillot et al. 2006; Burrows et al. 2007; Guillot 2008). The question of the formation of these planets with high masses in heavy elements but small hydrogen-helium envelopes remains open, but probably involves giant collisions (Ikoma et al. 2006).
Acknowledgements.
We wish to thank the French National Research Agency (ANR-08-JCJC-0102-01) for its continuous support for our planet-search program. The team at the IAC acknowledges support by grant ESP2007-65480-C02-02 of the Spanish Ministerio de Ciencia e Innovación. The German CoRoT Team (TLS and the University of Cologne) acknowledges DLR grants 50OW0204, 50O0603, and 50QP07011. T. M. acknowledges the supported of the Israeli Science Foundation (grant no. 655/07). This research has made use of the SIMBAD database, operated at the CDS, Strasbourg, France, and of NASA’s Astrophysics Data System.References
- Auvergne et al. (2009) Auvergne, M., Bodin, P., Boisnard, L., et al. 2009, A&A, 506, 411
- Baglin et al. (2006) Baglin, A., Auvergne, M., Barge, P., et al. 2006, in ESA Special Publication, Vol. 1306, ESA Special Publication, ed. M. Fridlund, A. Baglin, J. Lochard, & L. Conroy, 33–+
- Bakos et al. (2010) Bakos, G. Á., Torres, G., Pál, A., et al. 2010, ApJ, 710, 1724
- Baranne et al. (1996) Baranne, A., Queloz, D., Mayor, M., et al. 1996, A&AS, 119, 373
- Bordé et al. (2007) Bordé, P., Fressin, F., Ollivier, M., Léger, A., & Rouan, D. 2007, in Astronomical Society of the Pacific Conference Series, Vol. 366, Transiting Extrapolar Planets Workshop, ed. C. Afonso, D. Weldrake, & T. Henning, 145–+
- Borucki et al. (2010) Borucki, W. J., Koch, D. G., Brown, T. M., et al. 2010, ArXiv e-prints
- Bouchy et al. (2009a) Bouchy, F., Hébrard, G., Udry, S., et al. 2009a, A&A, 505, 853
- Bouchy et al. (2009b) Bouchy, F., Moutou, C., Queloz, D., & the CoRoT Exoplanet Science Team. 2009b, in IAU Symposium, Vol. 253, IAU Symposium, 129–139
- Bruntt (2009) Bruntt, H. 2009, A&A, 506, 235
- Bruntt et al. (2004) Bruntt, H., Bikmaev, I. F., Catala, C., et al. 2004, A&A, 425, 683
- Bruntt et al. (2002) Bruntt, H., Catala, C., Garrido, R., et al. 2002, A&A, 389, 345
- Burrows et al. (2007) Burrows, A., Hubeny, I., Budaj, J., & Hubbard, W. B. 2007, ApJ, 661, 502
- Cabrera et al. (2009) Cabrera, J., Fridlund, M., Ollivier, M., et al. 2009, A&A, 506, 501
- Charbonneau et al. (2007) Charbonneau, D., Brown, T. M., Burrows, A., & Laughlin, G. 2007, Protostars and Planets V, 701
- Deleuil et al. (2009) Deleuil, M., Meunier, J. C., Moutou, C., et al. 2009, AJ, 138, 649
- Geem et al. (2001) Geem, Z., Kim, J., & Lonatathan, G. 2001, Simulation, 76, 60
- Gillon et al. (2007) Gillon, M., Pont, F., Demory, B., et al. 2007, A&A, 472, L13
- Giménez (2006) Giménez, A. 2006, A&A, 450, 1231
- Guillot (2008) Guillot, T. 2008, Physica Scripta Volume T, 130, 014023
- Guillot et al. (2006) Guillot, T., Santos, N. C., Pont, F., et al. 2006, A&A, 453, L21
- Ikoma et al. (2006) Ikoma, M., Guillot, T., Genda, H., Tanigawa, T., & Ida, S. 2006, ApJ, 650, 1150
- Lammer et al. (2009) Lammer, H., Odert, P., Leitzinger, M., et al. 2009, A&A, 506, 399
- Léger et al. (2009) Léger, A., Rouan, D., Schneider, J., et al. 2009, A&A, 506, 287
- Mandel & Agol (2002) Mandel, K. & Agol, E. 2002, ApJ, 580, L171
- Mayor et al. (2003) Mayor, M., Pepe, F., Queloz, D., et al. 2003, The Messenger, 114, 20
- Mazeh et al. (2009) Mazeh, T., Guterman, P., Aigrain, S., et al. 2009, A&A, 506, 431
- Mordasini et al. (2009) Mordasini, C., Alibert, Y., & Benz, W. 2009, A&A, 501, 1139
- Morel & Lebreton (2008) Morel, P. & Lebreton, Y. 2008, Ap&SS, 316, 61
- Pepe et al. (2002) Pepe, F., Mayor, M., Galland, F., et al. 2002, A&A, 388, 632
- Perruchot et al. (2008) Perruchot, S., Kohler, D., Bouchy, F., et al. 2008, in Society of Photo-Optical Instrumentation Engineers (SPIE) Conference Series, Vol. 7014, Society of Photo-Optical Instrumentation Engineers (SPIE) Conference Series
- Pinheiro da Silva et al. (2008) Pinheiro da Silva, L., Rolland, G., Lapeyrere, V., & Auvergne, M. 2008, MNRAS, 384, 1337
- Press et al. (1997) Press, W. H., Teukolsky, S. A., Vetterling, W. T., & Flannery, B. P. 1997, Numerical Recipes in C, The Art of Scientific Computing, 2nd edn. (Cambridge University Press)
- Queloz et al. (2009) Queloz, D., Bouchy, F., Moutou, C., et al. 2009, A&A, 506, 303
- Sartoretti & Schneider (1999) Sartoretti, P. & Schneider, J. 1999, A&AS, 134, 553
- Sato et al. (2005) Sato, B., Fischer, D. A., Henry, G. W., et al. 2005, ApJ, 633, 465
- Schneider (2003) Schneider, J. 2003, in SF2A-2003: Semaine de l’Astrophysique Francaise, ed. F. Combes, D. Barret, T. Contini, & L. Pagani, 149–+
- Siess (2006) Siess, L. 2006, A&A, 448, 717
- Sing (2010) Sing, D. K. 2010, A&A, 510, A260000+
- Surace et al. (2008) Surace, C., Alonso, R., Barge, P., et al. 2008, in Society of Photo-Optical Instrumentation Engineers (SPIE) Conference Series, Vol. 7019, Society of Photo-Optical Instrumentation Engineers (SPIE) Conference Series
- Valenti & Fischer (2005) Valenti, J. A. & Fischer, D. A. 2005, ApJS, 159, 141
- Valenti & Piskunov (1996) Valenti, J. A. & Piskunov, N. 1996, A&AS, 118, 595