Magnetic excitations in multiferroic LuMnO3 studied by inelastic neutron scattering
Abstract
We present data on the magnetic and magneto-elastic coupling in the hexagonal multiferroic manganite LuMnO3 from inelastic neutron scattering, magnetization and thermal expansion measurements. We measured the magnon dispersion along the main symmetry directions and used this data to determine the principal exchange parameters from a spin-wave model. An analysis of the magnetic anisotropy in terms of the crystal field acting on the Mn is presented. We compare the results for LuMnO3 with data on other hexagonal RMnO3 compounds.
pacs:
75.30.Ds, 75.25.Dk, 75.50.Ee, 75.85.+tI Introduction
Multiferroic materials have been intensively studied in recent years following the discovery of compounds that display giant cross-coupling effects between magnetic and ferroelectric order parameterskimura03 ; hur04 ; lottermoser04 . Particular interest has been aroused by the possibility of new magnetoelectric coupling mechanismsmostovoy06 ; betouras07 ; cheong07 and the potential for exploitation in technological applicationsfiebig05 ; tokura06 ; eerenstein06 . One of the most investigated families of multiferroics is the hexagonal manganites MnO3, which form with Sc, Y, Ho, Er, Tm, Yb and Lu. The magnetoelectric behavior found in this family is associated with frustrated antiferromagnetic interactions of Mn spins on a triangular lattice. The compounds formed with Sc, Y and Lu are attractive for fundamental studies because they are not complicated by additional magnetic contributions from the ions and because they form a family in which changes in structure and magnetoelectric behavior can be correlated in a systematic way. Here we focus on LuMnO3, and present neutron scattering measurements of the cooperative magnetic dynamics and measurements of the thermal expansion by dilatometry. The data provide quantitative information on the exchange interactions, magnetic anisotropy, and magnetostriction, all of which play a part in the magnetoelectric coupling. The results are compared with similar measurements on YMnO3.
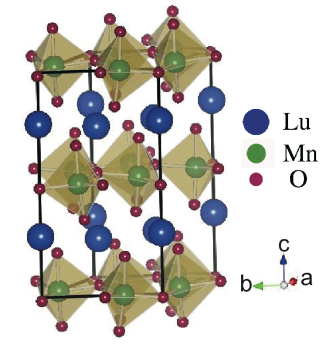
The crystal structure of the hexagonal manganites, which is described by the space group , is built from corner-sharing MnO5 bipyramids which form layers parallel to the plane separated by rare earth ions, as shown in Fig. 1. The Mn ions form a near-ideal triangular lattice. The ferroelectric distortion, which occurs at a high temperature ( K for LuMnO3, Ref. katsufuji02, ), is caused by a tilting of the MnO5 bipyramids and a buckling of the plane, which together create a superlattice distortion (trimerization) of the Mn ions and a ferroelectric moment along the axiskatsufuji02 ; akenNM04 . The distortion shifts the Mn ions along the axis away from the ideal positionfootnote — see Fig. 1.
The magnetic properties of LuMnO3 arise from the (almost) triangular layers of Mn3+ (3) ions with . Neighboring spins are coupled by antiferromangetic exchange interactions which are frustrated by the triangular geometry, as evidenced by the large ratio of the Weiss to Néel temperatures (Ref.katsufuji01, ), the anomalous magnetic entropy below katsufuji01 , and the reduction in the value of the ordered magnetic moment to about 75% of the full spin-only moment for (Ref. katsufuji02, ). The Mn spins in all the hexagonal MnO3 compounds form a classical 120∘ structure within the triangular layers (Fig. 1)bertaut63 ; koehler64 ; munoz00 ; fiebig00 ; brown06 ; katsufuji02 . The spins are confined by anisotropy to lie in the plane, and the large inter-layer separation decouples the layers electronically and makes the magnetism quasi-two-dimensional. In the case of LuMnO3, magnetic ordering occurs below K.
Evidence for magnetoelectric coupling in MnO3 compounds is provided by anomalies at in the dielectric constant huang97 ; katsufuji01 , lattice dynamicssouchkov03 ; jang10 ; poirier07 ; petit07 , thermal conductivitysharma04 and structural parametersakenPRB04 ; lee05 ; lee08 . There are also interesting observations by optical second-harmonic generation which show a cross-correlation between ferroelectric and magnetic domains due to the formation of magnetic domain walls below which coincide with ferroelectric domain wallsfiebig02 ; goltsev03 ; hanamura03 .
The precise microscopic mechanism of the magnetoelectric coupling in MnO3 has not been described yet. Careful structural measurements on Y1-xLuxMnO3 have shown that an isostructural transition takes place at (Ref. lee08, ), which causes further displacements of the ions resulting in a small increase in the ferroelectric polarization. It was therefore proposed that the magnetoelectric coupling is driven by a primary magnetoelastic coupling. The origin of the magnetoelastic coupling, however, remains unclear. One possibility is that the isostructural distortion may occur in order to relieve some energy associated with magnetic frustrationfabreges09 . Another proposal is that the system might benefit energetically from the Dzyaloshinskii–Moryia interaction below via a small -axis displacement in the oxygen atoms that bond adjacent Mn atomspailhes09 . This displacement would produce a small additional electric polarization along the axis.
II Experimental
Single crystals of LuMnO3 were prepared by the optical floating-zone technique as follows. Polycrystalline LuMnO3 was prepared by standard solid-state reaction from high purity (99.999%) Lu2O3 and MnO2. The polycrystalline powder was pressed into rods of diameter 8 mm and length 80 mm, and sintered at 1300∘C for 24 hours. Single crystals were grown in a four-mirror optical floating-zone furnace (Crystal Systems Inc.) at a scanning rate of 3–4 mm hr-1 with the feed and seed rods counter-rotating at 30 rpm. The growth was performed in a flowing atmosphere of argon and oxygen in the ratio 12:1. At each stage in the preparation the phase purity of the product was checked by powder X-ray diffraction.
Unpolarized neutron scattering measurements were performed on a crystal of mass 1.9 g on the cold-neutron triple-axis spectrometer TASP at the SINQ facility (PSI, Switzerland) and on the thermal triple-axis 2T1 at LLB-Orphée (Saclay, France). At TASP, the crystal was mounted in an ‘orange’ helium cryostat and neutron spectra were recorded with a fixed final energy of 4.5 meV. The corresponding setup at 2T1 was with a closed-cycle refrigerator and a fixed final energy of 14.7 meV. Measurements were made with either and or and in the horizontal scattering plane, where , and are the axes of the hexagonal reciprocal lattice. On 2T1 some measurements were also made in the plane parallel to the plane but displaced by 0.5 reciprocal lattice units along the axis. The lattice parameters of LuMnO3 referred to the space group are , , and the inter-axis angles are ∘, ∘. Hence, , and .
Magnetic measurements were performed with a superconducting quantum interference device (SQUID) magnetometer on a small piece of crystal cut from the same rod as the neutron crystal. The thermal expansion was measured on the same piece of crystal with a miniature capacitance dilatometerrotter98-2742 ; rotter-patent .
III Results
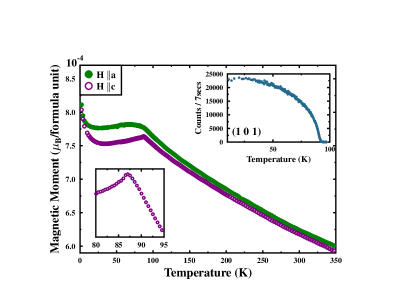
Figure 2 shows the magnetization of LuMnO3 for a magnetic field of strength 1000 Oe applied parallel to the plane and along the axis. Magnetic ordering is signalled by a sharp peak in the magnetization at K (Fig. 2 lower inset). This is confirmed by the appearance of magnetic Bragg peaks below in neutron diffraction data (Fig. 2 upper inset). The magnetization exhibits a small anisotropy, being slightly larger when the field is applied parallel to the plane () than along the c-axis. This easy-plane anisotropy is consistent with the observation that the moments lie in the plane in the ordered phase. The data follows a Curie–Weiss law at high temperatures (not shown) with a negative Weiss temperature, . From fits of vs we obtain K from , and K from . These values are close to those reported previously from single crystalskatsufuji01 , but somewhat larger in magnitude than obtained from powder samplestomuta01 . A clear cusp is seen at in whereas a broader peak is seen in . It has been suggested that the cusp in is caused by coupling between adjacent Mn layers, and the more rounded peak in is due to frustrationkatsufuji01 .
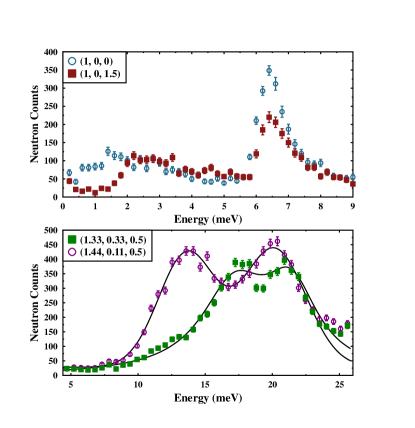
Examples of neutron scattering spectra from both instruments are presented in Fig. 3. Figure 3(a) shows energy scans recorded on TASP at the scattering vectors and , both of which contain two asymmetric peaks. Figure 3(b) shows data at and measured on 2T1. Since the ordered moment on the Mn sites is relatively large ( ) the scattering from magnons is expected to be much stronger than phonon scattering at these relative small scattering vectors. This, together with the resemblance of the spectra to previous measurements on YMnO3, gives us confidence that the main features in the spectra correspond to magnon excitations.
To determine the magnon dispersion we fitted the peaks with Gaussian or Lorentzian functions (depending on the peak shape) on a linear background. The fitted peak positions have been collected together into a dispersion curve which is plotted in Fig. 4, including data from both TASP and 2T1. Measurements on TASP extended from below 1 meV up to about 13meV, while measurements at 2T1 covered the range from about 5 meV up to the energy of the highest modes. Measurements were performed in several different zones to find the maximum intensity and to check that the peaks were periodic in reciprocal space.
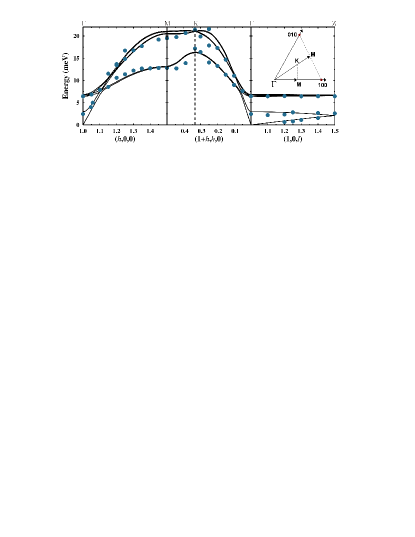
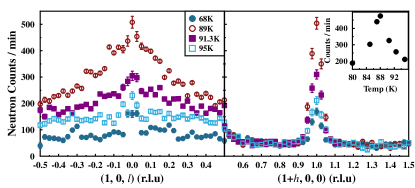
Figure 5 shows diffuse scattering measurements in the vicinity of the point in reciprocal space at temperatures close to . The reflection has zero nuclear structure factor, and we observed zero magnetic intensity here at low temperatures. The scans in Fig. 5 reveal strong diffuse scattering at temperatures close to with maximum intensity at itself, as shown in the inset. The diffuse scattering is highly anisotropic, being very broad in the direction but much sharper in the direction.
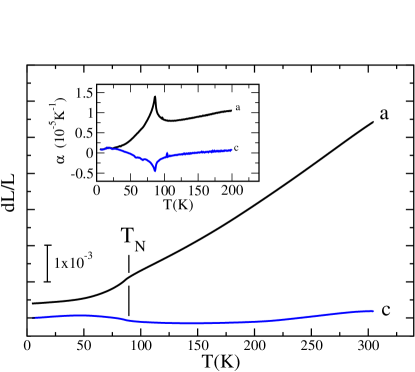
Figure 6 shows measurements of the thermal expansion of LuMnO3 parallel to the and axes. A magnetoelastic anomaly is clearly visible at the Néel temperature, both in the strain and in its temperature derivative . On cooling through the magnetoelastic strain expands the axis and shrinks the hexagonal plane. As a check, we also measured the thermal expansion in the hexagonal plane in the direction normal to . The data resemble the behaviour of to within the experimental error. Above the thermal expansion is highly anisotropic. The -axis strain is almost temperature independent.
IV Analysis and discussion
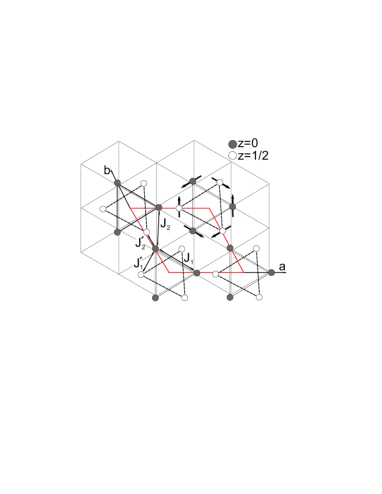
We first review the magnetic structure of the MnO3 compounds bertaut63 ; koehler64 ; munoz00 ; fiebig00 ; brown06 , with particular reference to LuMnO3. The six Mn sites in the unit cell (Fig. 1) form two near-equilateral triangles, one in the layer and the other in the layer. The spins on these triangles lie in the basal plane and order in 120∘ structures. Symmetry constrains the relation between the and layers to two possibilities, conventionally labeled and . In the structure the spin on the Mn at () is parallel to that at (, whereas in the structure the spins on these two sites point in opposite directions. Each spin makes an angle to the unit cell axis on which it lies, and the magnetic structure factors depend on and on the stacking relation ( or ). For , the magnetic structures occur in homometric pairs, such that the magnetic diffraction intensities for the configuration (, ) are identical with those from (, ).
In the case of LuMnO3, Katsufuji et al. concluded from neutron powder diffraction measurementskatsufuji02 that the low temperature structure is one of two possibilities, either (, ) or (, or ). These two structures transform respectively like the and irreducible representations of the space group (Ref. munoz00, ). Only this particular homometric pair have a completely absent magnetic reflection. In our single crystal measurements we also found very little intensity at the reflection (but relatively strong intensity for the reflection — see the inset in Fig. 2) at the lowest temperature ( K), in agreement with Katsufuji et al. The homometric pairs can in principle be distinguished by optical second harmonic generation (SHG). Using this method, Fiebig et al. found that their sample of LuMnO3 was a two-phase mixture of structures with and an unspecified other valuefiebig00 . Since our low-temperature data, as well as that of Ref. munoz00, , conclusively rule out any structure which does not have it is difficult to see how to reconcile the diffraction and SHG results. For the purpose of modeling the spin wave spectrum we will assume the (, ) structure, as shown in Fig. 1. The magnetic spectrum of this and its homometric partner are not distinguishable at the level of precision of our data.
We calculated the spin wave spectrum from the spin Hamiltonian
| (1) |
with two in-plane near-neighbor interactions ( and ) and two inter-plane interactions ( and ) defined as shown in Fig. 1. The first summation in (1) is over pairs of spins with each pair counted once so that the constants are per spin pair. The second term models the out-of-plane anisotropy with a single-ion anisotropy parameter . We neglect the small in-plane anisotropy since the in-plane magnon gap was too small to measure in our experiment.
Analytic expressions have been given previously for the spin-wave energies derived from spin Hamiltonians similar to (1), Refs. sikora88, ; sato03, ; vajk05, ; chatterji07, . These expressions have been obtained via the usual transformation of the Hamiltonian into a quadratic form of boson normal-mode operators in the linear approximation. Here we use an alternative method based on dynamical matrix diagonalisation (DMD) as outlined in previous work rotter06-400 , which is implemented in the McPhase software packagerotter-mcphase . This formulation employs the random phase approximation to calculate the magnon cross sections in addition to the dispersion relations.
There are six Mn spins per unit cell, which gives rise to a total of six spin-wave modes for each wavevector. As the interlayer coupling is small, the in-plane dispersion relations appear as three branches each containing two nearly-degenerate modes. The degeneracy of the lowest two modes is lifted close to the point and along Z by the effect of the and interactions, while the upper four modes are almost degenerate along Z. This degeneracy precludes the possibility to fit accurate values for and independently, and so we chose to fix and to vary under the constraint that to maintain the stability of the structure.
A least-squares fitting procedure returned the following values for the model parameters: meV, meV, meV (), and meV. The calculated dispersion relations from the model with these parameters are shown in Fig. 4. The agreement is seen to be very good, and the parameters are well constrained by the data. For example, the 6.5 meV gap to the upper mode at is sensitive to the single-ion anisotropy, and controls the dispersion in the out-of-plane direction. The splitting of the magnon peaks in the vicinity of the point, seen in Fig. 3, is sensitive to the difference between and . Qualitative agreement between the measured and calculated magnon cross sections gave us further support for the obtained parameters.
As a check, we calculated the bulk magnetization using the best-fit exchange and anisotropy parameters. The predicted by the mean-field model is about 2.5 times larger than the observed , presumably as a consequence of frustration. The calculated susceptibility has a small easy-plane anisotropy consistent with the measured susceptibility, Fig. 2. The magnetization of the sample as a function of applied field (not shown) is linear and almost identical in the and directions. Increasing the single-ion anisotropy in the model creates a step in the -axis magnetization which is not observed. This adds to the evidence that the single-ion anisotropy is very small compared to the exchange interactions.
The exchange parameters obtained here show that the dominant magnetic interaction is the in-plane antiferromagnetic superexchange via the Mn-O-Mn path. The inter-layer superexchange is two orders of magnitude weaker, confirming that the magnetism in LuMnO3 is highly two-dimensional. It is interesting to compare the magnetic spectrum of LuMnO3 investigated here with those obtained from similar measurements on YMnO3 (Refs. sato03, ; chatterji07, ; petit07, ; fabreges09, ) and HoMnO3 (Ref. vajk05, ). Qualitatively, the spectra of the three compounds look very similar, but the overall band width of the LuMnO3 spectrum is about 30% larger than that of YMnO3 and HoMnO3 (21 meV compared with 16 meV). Consistent with this, the fitted exchange parameters for LuMnO3 are found to be systematically larger than those of YMnO3 and HoMnO3. This accounts for the difference in the antiferromagnetic ordering temperatures of these compounds: K (LuMnO3) compared with K (YMnO3) and K (HoMnO3) and the larger Weiss temperature of LuMnO3 ( K) compared with YMnO3 ( K)katsufuji01 .
The stronger magnetic interactions in LuMnO3 fits with the systematic trend in the ionic radii and the lattice parameterskatsufuji02 , i.e. the smaller the ionic radius the smaller the unit cell and the stronger the exchange interactions. The single-ion anisotropy parameter is also found to be larger for LuMnO3 ( meV) than for YMnO3 ( to meV) and HoMnO3 ( meV). This could be another consequence of the small differences in the structural parameters of these compounds.
The character of the diffuse scattering from LuMnO3 close to (Fig. 5) strongly resembles that observed from YMnO3.roessli05 The appearance of scattering which is very broad along but relatively sharp in the plane indicates that the inter-layer correlations are very weak, consistent with the small and and two-dimensional nature of the magnetic system. The strong enhancement in the diffuse scattering intensity around was also observed in powder diffaction measurements on LuMnO3.katsufuji02 These showed that the diffuse peak persists up to at least ,katsufuji02 which was interpreted as evidence for strong geometric frustration.
Careful powder diffraction measurementslee08 have shown that the magnetically-induced ferroelectricity in MnO3 is associated with an isostructural transition involving an additional rotation of the MnO5 bipyramids, and that the increase in ferroelectric polarization below scales with the square of the ordered moment. The thermal expansion of LuMnO3 reported here (Fig. 6) reveals a striking magnetoelastic anomaly at , consistent with the diffraction data of Lee et al. (Ref. lee08, ) who argued that magnetoelastic coupling (exchange striction) is the primary source of the magnetoelectric couplinglee08 . One might expect, therefore, that the magnetoelectric effect would scale with the strength of the exchange interactions and hence be greater in LuMnO3 than in YMnO3. Support for this idea is provided by the magnetically-induced polarization calculated from the measured atomic displacements below , which indeed appears to be systematically larger for LuMnO3 than for YMnO3 (Ref. lee08, ). However, given the large experimental uncertainties in the values of the small atomic displacements this evidence should be considered tentative.
Another notable feature of the thermal expansion is how small the -axis thermal expansion is relative to the plane expansion above (see Fig. 6). This effect, which is observed both for LuMnO3 and YMnO3, does not correlate with the compressibility of these materials, which is similar along the direction and in the planekozlenko_JEPT . The relatively isotropic compressibility suggests that the anomalous -axis thermal expansion is not due to a straightforward anharmonicity in the interatomic potentials along the axis, and it would be interesting to find out what is responsible for it.
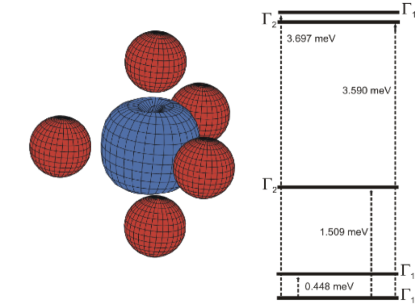
Before concluding, we investigate the origin of the small magnetic anisotropy of LuMnO3, which is represented in the Hamiltonian (1) by the phenomenological term. For reference, we performed a point-charge calculation of the the crystal field at the Mn sites assuming Mn to be in the Mn3+ state with configuration and using the structural parameters reported by Katsufuji et al. in Ref. katsufuji02, . We included only the five nearest oxygen neighbors of Mn in the MnO5 bipyramid, as shown in Fig. 7. The ground-state manifold is split by the crystal field via the spin–orbit interaction. The calculated splitting, due to the crystal field alone, is also shown in Fig. 7. This model of the crystal field predicts that the ordered magnetic moment points along the normal to the local mirror plane, as shown in Fig. 1, and with the inclusion of the exchange field from the neighboring Mn ions predicts an anisotropy gap in the magnon spectrum of 10 meV. This size of gap is in clear disagreement with the observed spin-wave modes, which have a gap of less than 1 meV at the zone centre, Fig. 4. The anisotropy gap may be reduced in the model if the local symmetry is increased to , i.e. by lessening the degree of Mn trimerization and tilting of the MnO5 bipyramid. We conclude, therefore, that the single-ion anisotropy is controlled by a tiny distortion of the ideal MnO5 bipyramid and that the anisotropy is much smaller than that predicted by a simple point-charge model.
V Conclusions
We have measured the magnon dispersion in LuMnO3 and achieved a very good description of the spectrum using the Heisenberg Hamiltonian, Eq. (1). We also observed a striking magnetoelastic coupling at in the thermal expansion. The results are qualitatively similar to those previously obtained on the sister compound YMnO3. The bandwidth of the one-magnon spectrum of LuMnO3 is about 30% larger than that of YMnO3, and the difference between the two nearest-neighbour in-plane exchange constants and is greater for LuMnO3 than for YMnO3. As the magnetic interactions are stronger in LuMnO3 than in YMnO3 we expect the magnetically-induced ferroelectric polarization to be greater in LuMnO3. The available diffraction data provides tentative support for this.
VI Acknowledgments
This work was performed partly at the Swiss spallation neutron source SINQ, Paul Scherrer Institut, Switzerland, and partly at the Laboratoire Léon Brillouin, Saclay, France. We are grateful for support from by the Engineering and Physical Sciences Research Council of Great Britain and from the European Commission under the 7th Framework Programme through the ‘Research Infrastructures’ action of the ‘Capacities’ Programme, Contract No: CP-CSA INFRA-2008-1.1.1 Number 226507-NMI3.
References
- (1) T. Kimura, T. Goto, H. Shintani, K. Ishizaka, T. Arima, and Y. Tokura, Nature (London) 426, 55 (2003).
- (2) N. Hur, S. Park, P. A. Sharma, J. S. Ahn, S. Guha, and S.-W. Cheong, Nature 429, 392 (2004).
- (3) T. Lottermoser, T. Lonkai, U. Amann, D. Hohlwein, J. Ihringer, and M. Fiebig, Nature 430, 541 (2004).
- (4) M. Mostovoy, Phys. Rev. Lett. 96, 067601 (2006).
- (5) J. J. Betouras, G. Giovannetti, and J. van den Brink, Phys. Rev. Lett. 98, 257602 (2007).
- (6) S.-W. Cheong and M. Mostovoy, Nature Mat. 6, 13 (2007).
- (7) M. Fiebig, J. Phys. D: Appl. Phys. 38, R123 (2005).
- (8) Y. Tokura, Science 312, 1481 (2006).
- (9) W. Eerenstein, N. D. Mathur and J. F. Scott, Nature 442, 759 (2006).
- (10) T. Katsufuji, M. Masaki, A. Machida, M. Moritomo, K. Kato, E Nishibori, M. Takata, M. Sakata, K. Ohoyama, K. Kitazawa, and H. Takagi, Phys. Rev. B 66, 134434 (2002).
- (11) B. B. Van Aken, T. T. M. Palastra, A. Filippetti and N. A. Spaldin, Nature Materials 3, 164 (2004).
- (12) Note that there is a discrepancy between different structural studies about whether the Mn shifts to a position with or . For LuMnO3, Van Aken et al. (Ref. akenPRB04, ) and Lee et al. (Ref. lee08, ) report , whereas Katsufuji et al. (Ref. katsufuji02, ) report .
- (13) T. Katsufuji, S. Mori, M. Masaki, Y. Moritomo, N. Yamamoto, and H. Takagi, Phys. Rev. B 64,104419 (2001).
- (14) E. F. Bertaut and M. Mercier, Phys. Lett. 5 27 (1963).
- (15) A. Muñoz, J. A. Alonso, M. J. Martínez-Lope, M. T. Casáis, J. L. Martínez, and M. T. Fernández-Díaz, Phys. Rev. B 62, 9498 (2000).
- (16) W. C. Koehler, H. L. Yakel, E. O. Wollan, and J. W. Cable, Phys. Lett. 9, 93 (1964).
- (17) M. Fiebig, D. Fröhlich, K. Kohn, S. Leute, Th. Lottermoser, V. V. Pavlov and R. V. Pisarev, Phys. Rev. Lett. 84, 5620 (2000).
- (18) P. J. Brown and T. Chatterji, J. Phys.: Condens. Matter 18, 10085 (2006).
- (19) Z. J. Huang, Y. Cao, Y. Y. Sun, Y. Y. Xue, and C. W. Chu, Phys. Rev. B 56, 2623 (1997).
- (20) A. B. Souchkov, J. R. Simpson, M. Quijada, H. Ishibashi, N. Hur, J. S. Ahn, S.W. Cheong, A. J. Millis, and H. D. Drew, Phys. Rev. Lett. 91, 027203 (2003).
- (21) K.-J. Jang, J. Lim, J. Ahn, J.-H. Kim, K.-J. Yee, J. S. Ahn, and S.-W. Cheong, New Journal of Physics 12, 023017 (2010).
- (22) S. Petit, F. Moussa, M. Hennion, S. Pailhès, L. Pinsard-Gaudart and A. Ivanov, Phys. Rev. Lett. 99, 266604 (2007).
- (23) M. Poirier, F. Laliberté, L. Pinsard-Gaudard, and A. Revcolevschi, Phys. Rev. B 76, 174426 (2007).
- (24) P. A. Sharma, J. S. Ahn, N. Hur, S. Park, S. B. Kim, S. Lee, J.-G. Park, S. Guha, and S-W. Cheong, Phys. Rev. Lett. 93, 177202 (2004).
- (25) S. Lee, A. Pirogov, J. H. Han, J.-G. Park, A. Hoshikawa, and T. Kamiyama, Phys. Rev. B 71, 180413(R) (2005).
- (26) S. Lee, A. Pirogov, M. Kang, K.-H. Jang, M. Yonemura, T. Kamiyama, S.-W. Cheong, F. Gozzo, N. Shin, H. Kimura, Y. Noda, and J.-G. Park, Nature (London) 451, 805 (2008).
- (27) B. B. Van Aken and T. T. M. Palstra, Phys. Rev. B 69,134113 (2004).
- (28) M. Fiebig, Th. Lottermoser, D. Frölich, A. V. Goltsev, and R. V. Pisarev, Nature (London) 419, 818 (2002).
- (29) A. V. Goltsev, R. V. Pisarev, Th. Lottermoser and M. Fiebig, Phys. Rev. Lett 90, 177204 (2003).
- (30) E. Hanamura, K. Hagita, and Y. Tanabe, J. Phys.: Condens. Matter 15, L103 (2003).
- (31) X. Fabrèges, S. Petit, I. Mirebeau, S. Pailhès, L. Pinsard, A. Forget, M. T. Fernandez-Diaz, and F. Porcher, Phys. Rev. Lett. 103, 067204 (2009).
- (32) S. Pailhès, X. Fabrèges, L. P. Régnault, L. Pinsard-Godart, I. Mirebeau, F. Moussa, M. Hennion, and S. Petit, Phys. Rev. B 79, 134409 (2009).
- (33) M. Rotter, H. Mueller, E. Gratz, M. Doerr, M. Loewenhaupt, Rev. Sci. Instr. 69, 2742 (1998).
- (34) M. Rotter, Patent Nr 502515, Austrian Patent Office.
- (35) D. G. Tomuta, S. Ramakrishnan, G. J. Nieuwenhuys and J. A. Mydosh, J. Phys.: Condens. Matter 13, 4543 (2001).
- (36) T. J. Sato, S.-H. Lee, T. Katsufuji, M. Masaki, S. Park, J. R. D. Copley and H. Takagi, Phys. Rev. B 68, 014432 (2003).
- (37) W. Sikora, O. V. Gurin, and V. N. Syromyatnikov, J. Magn. Magn. Mater. 71, 225 (1988).
- (38) O. P. Vajk, M. Kenzelmann, J. W. Lynn, S. B. Kim, and S.-W. Cheong, Phys. Rev. Lett. 94, 087601 (2005).
- (39) T. Chatterji, S. Ghosh, A. Singh, L. P. Regnault, and M. Rheinstädter, Phys. Rev. B 76, 144406 (2007).
- (40) M. Rotter, J. Comp. Mat. Sci. 38, 400 (2006).
- (41) McPhase: a software package for the calculation of phase diagrams and magnetic properties of magnetic systems, M. Rotter et al., (2002 – 2010), available at http://www.mcphase.de.
- (42) B. Roessli, S. N. Gvasaliya, E. Pomjakushina, and K. Conder, JETP Lett. 81, No. 6, 287, (2005).
- (43) D. P. Kozlenko, S. E. Kichanov, S. Lee, J.-G. Park, V. P. Glazkov and B. N. Savenko, JETP Lett. 82, 193 (2005).