A numerical study of one-patch colloidal particles: from square-well to Janus.
Abstract
We perform numerical simulations of a simple model of one-patch colloidal particles to investigate: (i) the behavior of the gas-liquid phase diagram on moving from a spherical attractive potential to a Janus potential and (ii) the collective structure of a system of Janus particles. We show that, for the case where one of the two hemispheres is attractive and one is repulsive, the system organizes into a dispersion of orientational ordered micelles and vesicles and, at low , the system can be approximated as a fluid of such clusters, interacting essentially via excluded volume. The stability of this cluster phase generates a very peculiar shape of the gas and liquid coexisting densities, with a gas coexistence density which increases on cooling, approaching the liquid coexistence density at very low .
pacs:
81.16.Dn, 61.20.Ja, 82.70.DdI Introduction
The synthesis of colloidal particles with controlled anisotropy is central in today research. One of the main ideas is the development of a set of colloidal moleculesZhang et al. (2005); Manoharan et al. (2003); Cho et al. (2005); Kraft et al. (2009); De Michele et al. (2006); Glotzer and Solomon (2007); Pawar and Kretzschmar (2010) which can be useful to generate, on the nano and micron-scale, collective phenomena presently observed only at atomic or molecular scale as well as additional phenomena, induced by the possibility of controlling the parameters of the effective interaction potential between colloids. The self-assembly of a colloidal diamond crystal, to be used in photonic applicationsMaldovan and Thomas (2004), is one of these technological relevant goals. The anisotropy can be induced not only by building colloidal molecules (i.e. colloids with peculiar non-spherical shapes), but also (with a promising alternative) via the process of patterning the particle surface, generating in this way particles interacting in very different way according to their relative orientationZhang et al. (2005); Roh et al. (2005); Hong et al. (2006, 2008); Wang et al. (2008); Jackson et al. (2004).
This vision of a material science, based on the design and self-assembly of materials with required properties has stimulated, beside the experimental work, a large amount of theoretical and numerical studies based on simple, primitive, anisotropic potentialsKern and Frenkel (2003); Bianchi et al. (2006, 2008); Wilber et al. (2007); Doye et al. (2007); Foffi and Sciortino (2007); Whitelam and Bon (2010). Indeed, the possibilities of modifying the surface properties are endless, including the number of patches, their width, their location, their chemical specificity, and seem to pose no limits to the design of specific particle-particle interaction potentials. In this large parameter space, primitive potentials — modeling repulsion as a hard-core and attraction as a square-well interaction — can provide a useful reference system to deeply investigate the role played by the number of patches, their width, their spatial location and the role of the attraction range. In addition, there is some consensus that these studies can shed light on the aggregation properties of proteins and on the sensitivity of the aggregates on the protein surface propertiesSear (1999); Lomakin et al. (1999); Liu et al. (2007); Li et al. (2009).
Another useful aspect of the study of primitive models is the possibility to accurately investigate theoretically and numerically their phase diagram, casting the self-assembly process of these systems into a wider thermodynamic perspective. Important questions about the nature of the self-assembly process and its reversibility, the relative stability of aggregates of different sizes, the competition between self-assembly and phase-separation can in principle be addressed with an accurate study of these models. Finally, in some cases, numerical simulations can be compared with state of the art integral equation approaches for non-spherical potentials providing a benchmark for the possibility of developing a fast and accurate prediction of the structural properties. Several efforts in this directions, capitalizing on studies of molecular associationsWertheim (1984, 1986); Vakarin et al. (1997); Jirsák and Nezbeda (2007), are taking place in these daysFantoni et al. (2007); Giacometti et al. (2009, 2010).
In this article we report a study of the phase behavior of a very simple primitive potential, proposed in 2003 by Kern and FrenkelKern and Frenkel (2003) with the aim of exploring the scaling of the critical parameters (including the reduced second virial coefficient) on the number and width of the patches, and the possible implications for the phase behavior of globular proteins. We limit ourselves to the case where the surface of the colloid particle is divided into two parts, respectively repulsive and attractive. On decreasing the surface area corresponding to the attractive part, the potential interpolates between the well-known isotropic square well potential and the symmetric case of an evenly divided surface, commonly indicated as Janus potential. We find that an unconventional phase diagram characterizes Janus particles, due to the onset of a micelle formation process which takes place in the gas phase, providing additional stability to this phase as compared to the liquid one. We characterize the structural and connectivity properties of the system in a wide range of temperatures and number densities , to clarify the origin of the aggregation process and the mechanisms behind the stability of the cluster phase. Our study demonstrates how a small change in the attractive surface has profound consequences on the collective behavior of the system.
II Model and Simulation Techniques
The Kern-Frenkel potential is a paradigmatic model for highly anisotropic interactions. In this model, a hard-sphere of diameter is complemented by a set of unit vectors , locating the position of the center of a patch on the particle surface. Each patch can be reckoned as the intersection of the sphere with a cone of semi-amplitude and vertex at the center of the sphere. In the case studied in this model, each particle has only one patch. When unit vectors the patch of particle and of particle form an angle smaller than , and in addition the distance between the center of the two particles is between and , then an attractive interaction of intensity is present. More precisely, the two body potential is defined as:
| (1) |
where is an isotropic square well term of depth and attractive range and is a function that depends on the orientation of the two interacting particles . The angular function is defined as
| (2) |
The diameter of the particles and the depth of the square well have been chosen as units of length and energy respectively, i.e. and .
In practice, two particles interact attractively if, when they are within the attractive distance , two patches are properly facing each other. When this is the case, the two particles are considered bonded. The fraction of surface covered by the attractive patches is related to by the relation .
Structural properties of the system have been evaluated by mean of standard MC simulations, for a system of particles. Extremely long simulations, of the order of MC sweeps, have been performed to reach a proper equilibrium state of the system. Here a MC sweep is defined as an attempted random translation and rotation for each particle. To calculate the location of the gas-liquid critical point we perform grand canonical Monte Carlo (GCMC) simulations Smith and Frenkel (1996), complemented with histogram reweighting techniques to match the distribution of the order parameter with the known functional dependence expected at the Ising universality class critical point Wilding (1996). Here is the potential energy density, the number density and is the mixing field parameter. We did not performed a finite size study, since we are only interested in the trends with . We have studied systems of different sizes, up to . For each studied — using the methods described in Romano et al. (2007) — we calculated the critical temperature and density for values of between and (at fixed ). Temperature is measured in reduced units, i.e. Boltzmann constant .
We also performed Gibbs ensemble simulations to evaluate the coexistence curve. The GEMC method was designed Panagiotopoulos (1987) to study coexistence in the region where the gas-liquid free-energy barrier is sufficiently high to avoid crossing between the two phases. Since nowadays this is a standard method in computational physics, we do not discuss it here. We have studied a system of (total) 350 particles which partition themselves into two boxes whose total volume is , corresponding to an average density of . At the lowest this corresponds to roughly particles in the liquid box (of side ) and about 30 particles in the gas box (of side ). Equilibration at the lowest reported required about one month of computer time.
The model, in the case , can be related to the experimental system that is currently under investigationHong et al. (2008). In these newly synthesized Janus particles, the repulsive interaction has an electrostatic origin and the attractive part is hydrophobic At the present time, experiments by Granick’s groupHong et al. (2008) have focused on the analysis of the structure of the aggregates sedimented on the bottom surface due to gravity. Micelle formation has been observed. While the interaction range in the Granick’s experimental system is about 0.1 of the particle size, nano-sized particles synthesized with the same protocol would indeed give rise to potential ranges similar to the one we have selected. It is also in principle possible to modify the range of the interaction by tuning the physical properties of the solvent (for example the ionic strength or the solvent dielectric constant). Another interesting possible experimental realization of longer range interactions can be achieved by mean of the recently measured Casimir critical forces [for a highlighting review see for example Ref. Gambassi et al. (2009) or Ref. Soyka et al. (2008)] dissolving the particles close to the critical point of the solvent. By tuning the distance from the critical point, the range of the interaction can be controlled and tuned close to the value we have explored. Moreover, in the critical Casimir effect, the coating of the two hemispheres will controls if the interaction is attractive or repulsive. Other possibilities of probing different ranges will be offered by studies of Janus-like proteins. Indeed, the hydrophobin proteins (extracted from fungi) are good candidates for nano-Janus particles, as discussed in Ref. Walther and Müller (2008). Even in this protein case, the bulk phase diagram has never been explored.
III Results: From Square-well to Janus
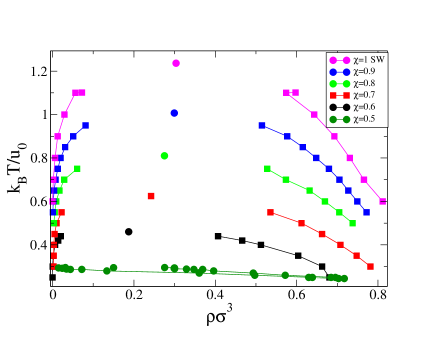
The Kern-Frenkel model offers the possibility to continuously change the coverage interpolating from the isotropic square-well potential to the symmetric Janus-like one, when the coverage moves from to . To investigate how the phase diagram of Janus particles arises, we start by looking how the gas-liquid coexistence is modified on progressively reducing . Fig. 1 depicts the gas-liquid phase coexistence for several values, extending the original data by Kern and FrenkelKern and Frenkel (2003). While the critical density presents a significant decrease with decreasing , the density of the liquid branch does not show any significant reduction, consistent with the possibility of forming six or more bonds with neighboring particles when . Recent studies on the role of the valence (defined as the maximum possible number of bonded nearest neighbors)Bianchi et al. (2006, 2007), have suggested a progressive reduction of the critical temperature and critical density on decreasing the valence. Indeed, when the valence decreases below six, a significant reduction of the density of the liquid branch has been reportedBianchi et al. (2008). Estimates of the critical parameters have been calculated using grand-canonical simulations, i.e. simulations in which the chemical potential , and the volume are kept constant. In GCMC simulations, the number of particles fluctuates. When and are close to their critical values, the number of particles fluctuates widely (since the compressibility, which is a measure of the variance of the density fluctuations diverges). The distribution of sampled densities, close to the critical point, follows an universal curve which depends only on the class of universality of the critical phenomenon.
The critical parameters, resulting from the grand-canonical simulations, are summarized in Table 1. The last column indicates the size of the largest simulation box, which has been progressively increased to compensate the decrease of the critical density and the associated shift towards smaller number of particles of the density fluctuations. Table 1 also reports the critical chemical potential and the value of the second virial potential , normalized to the hard-sphere value
| (3) |
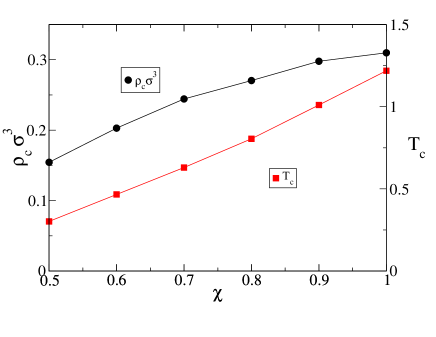
also evaluated at the critical point. Previous workFoffi and Sciortino (2007) has shown that becomes smaller and smaller with decreasing valence. The actual value of can provide an estimate of the effective valence of the system. A comparison with Table 1 of Ref. Foffi and Sciortino (2007) suggests that when reaches the value 0.6, the effective valence becomes less than 4 and that when the effective valence is still larger than three. The critical parameters and are also shown graphically in Fig. 2. In agreement with the progressive reduction of the valence, and do decrease with decreasing . Note that results presented in Figure 1 have a counterpart in the case where the attractive part is spread over two patches distributed at the opposite poles of the sphere (see Fig.2 in Ref.Giacometti et al. (2010)).
| L | ||||||
|---|---|---|---|---|---|---|
| 1 | 0.31 | 1.22 | -2.955 | -3.601 | -2.020 | 7 |
| 0.9 | 0.30 | 1.01 | -3.048 | -3.079 | -2.253 | 7 |
| 0.8 | 0.27 | 0.800 | -3.270 | -2.613 | -2.790 | 11 |
| 0.7 | 0.24 | 0.610 | -3.684 | -2.248 | -3.828 | 15 |
| 0.6 | 0.20 | 0.446 | -4.482 | -1.200 | -6.187 | 15 |
| 0.5 | 0.15 | 0.302 | -6.371 | -1.924 | -14.68 | 15 |
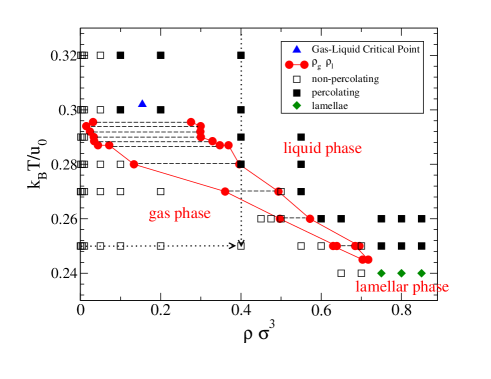
When (the Janus case), a new interesting phenomenon appears. Fig. 1 shows indeed that, differently from the standard behavior (and for all the studied cases) the density of the gas phase along the coexistence line increases progressively on cooling. This peculiar behavior is discussed in full details in the following sections. For smaller values of we have not presently been able to evaluate the phase diagram for two different reasons: i) the temperature region where the critical point is expected (around for , by a quadratic extrapolation of the data reported in Table 1) requires significant computational resources. ii) preliminary tests have detected the formation of lamellar phases for already at . Despite the disappearance of the liquid phase as an equilibrium phase in the presence of anisotropic potentials is a potentially relevant issueRomano et al. (2009), we can not at the present time address this point for the present model. A study of the stability of the liquid phase as compared to the (unknown) ordered phases will be the argument of a future study, which will require the use of algorithms to identify the possible crystal structuresFornleitner et al. (2008); Filion et al. (2009) as well as free-energy evaluations to establish the relative stability compared to the liquid phase. A similar study for tetrahedral patchy particles has been recently reportedRomano et al. (2009, 2010). Indeed, it could well be, as suggested in a recent study of particles with two patchesGiacometti et al. (2010), that the reduction of the bonding angle could play a role analog to the reduction of the range in spherically interacting potentialHagen and Frenkel (1994); Ilett et al. (1995) and limited valence potentialsRomano et al. (2009), where the liquid phase disappears when the range is smaller than .
IV Results: Janus
The gas-liquid coexistence for the Janus () particles is enlarged in Fig. 4. As discussed in a preliminary publicationSciortino et al. (2009), the phase diagram has a very odd behavior. The gas coexisting density, which typically is a decreasing function of the temperature, here increases progressively on cooling, approaching the coexisting liquid density. In a simple liquid, coexistence between gas and liquid is established on the basis of a compensation between the gas and liquid free energies. The lower energy of the liquid phase is compensated by a larger entropy of the gas phase, which is acquired by significantly increasing the volume per particle. As discussed in Ref. Sciortino et al. (2009) (and detailed more in the following), the uncommon behavior observed in the Janus case arises by a completely different compensation mechanism between the liquid and the gas. The gas becomes the energetically stable phase (due to the formation of orientationally ordered aggregates, micelles and vesicles) and the liquid phase instead is stabilized by the larger orientational entropy of the particles. This odd behavior give rises to a gas-liquid coexistence curve in the plane which is negatively sloped and to an expansion of the system on crossing from the gas to the liquid phase on cooling along isobars (see Fig. 4 in Ref.Sciortino et al. (2009)).
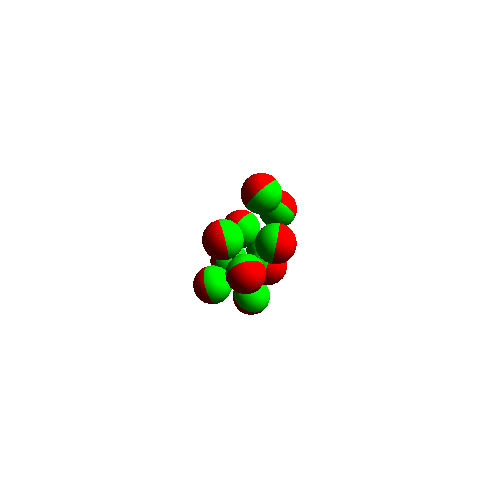
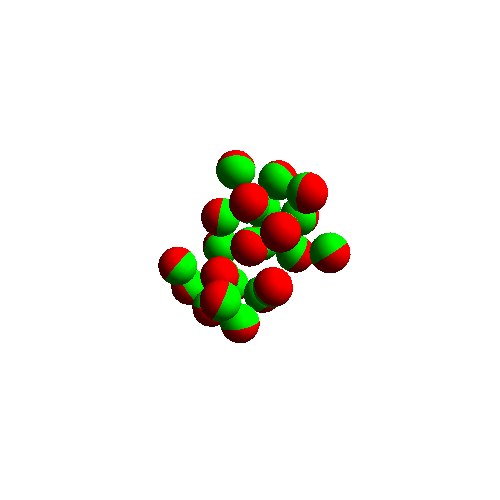
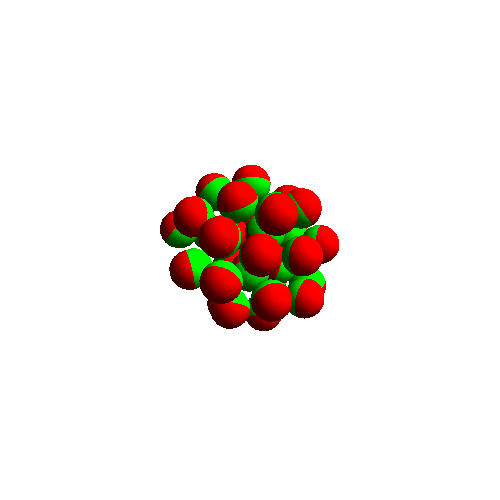
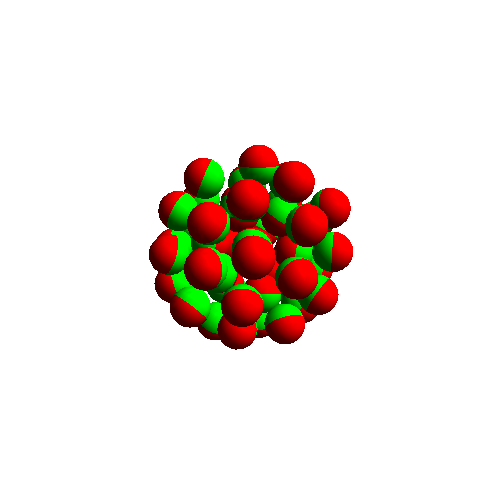
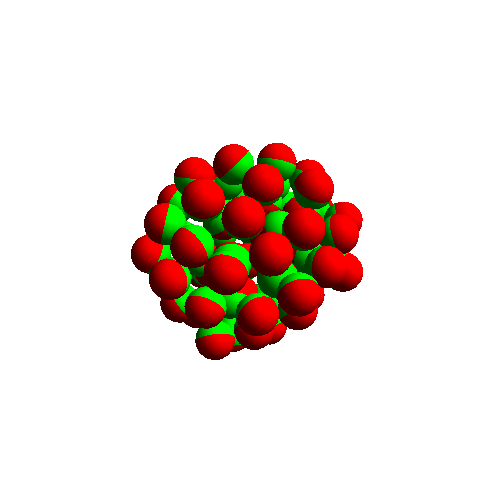
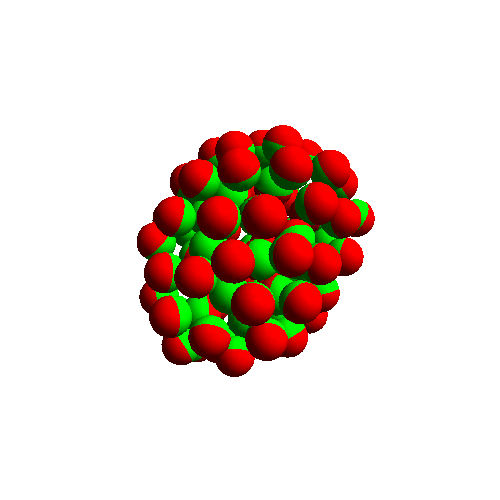
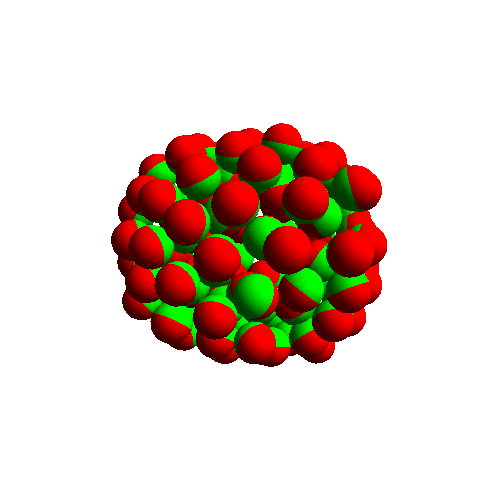
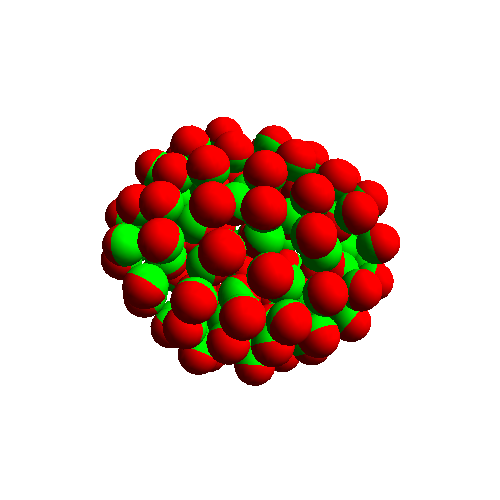
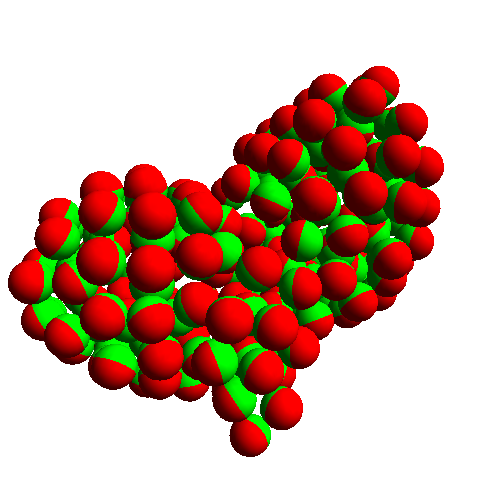
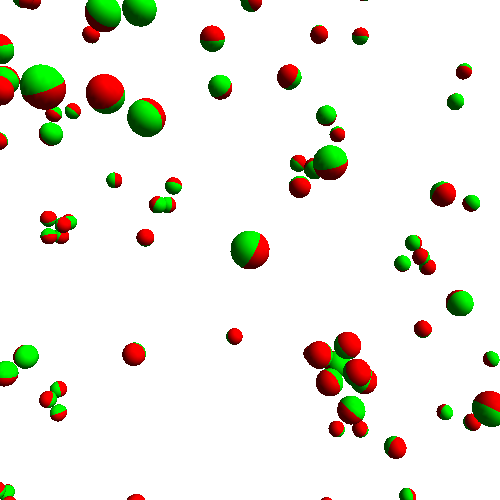
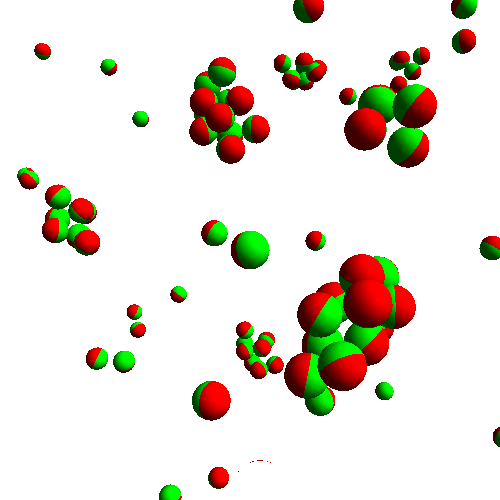
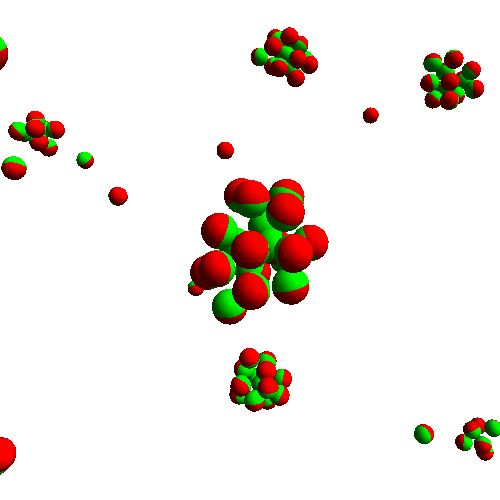
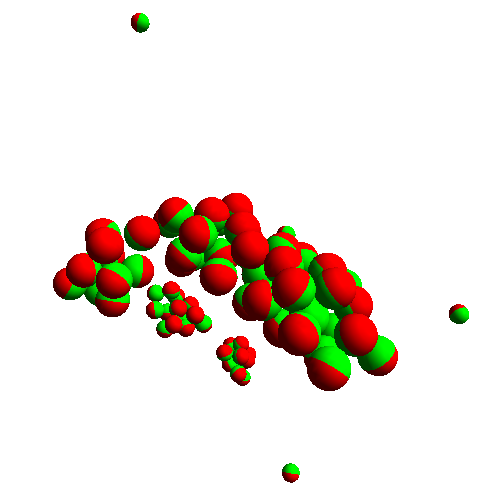
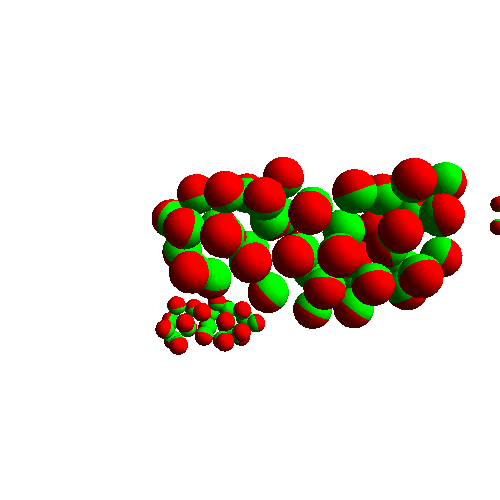
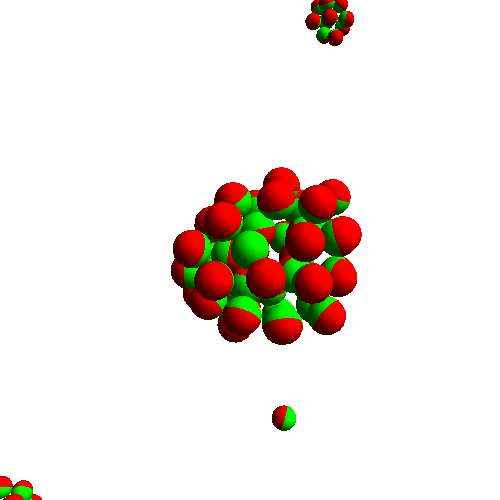
This anomalous thermodynamic behavior arises from the progressive establishment in the gas phase of clusters of particles which — due to the surface pattern properties of the particle — organize themselves in particularly stable structures. Typical cluster shapes for different values of the cluster size are shown in Fig. 3. For small cluster sizes () clusters are of micellar type, i.e. formed by aggregates in which the attractive part constitutes the core of the aggregate. For larger size, the cluster organization changes in favor of a double layer structure, reminiscent of vesicles, in which the inner and outer surfaces are repulsive and the inner core is attractive. Here, and in the rest of the manuscript, clusters are defined as set of particles connected by an uninterrupted path of bonds, where we define bonded any pair of particles whose pair potential energy is .
In this article we explore in details the properties of the clusters which develop in the gas phase, their structure, energy and abundance. We then investigate the gas and liquid phases with the aim of characterizing the collective structure of the system (both in real and wave-vector space) as well as its connectivity properties (percolation).
IV.1 Critical Micelle Concentration
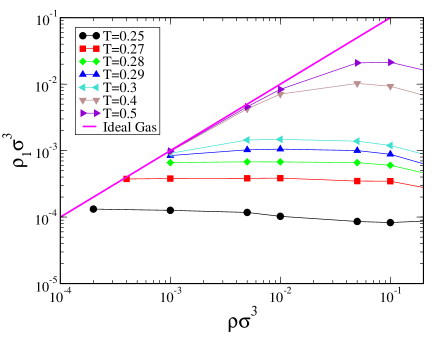
The onset of micelles can be demonstrated and quantified by the study of the relation between the density of particles in monomeric state (i.e. un-bonded particles) and the system density . Fig. 5 shows that for , a sharp kink separates the ideal gas behavior (where all the particles are in a very dilute monomeric state and ) from a rather insensitive density dependence of the number of monomers in solutions, a clear indication that, at low , the addition of particles to a constant volume system promotes the formation of additional aggregates. This behavior is indeed typical of micelle forming systemsD. Fennell Evans and H. Wennerström (1999), and the location of the kink provides an estimate of the critical micelle concentration (c.m.c.), which in the present case varies from down to when changes from to .
One may wander why this system, on cooling, does not show a typical gas-liquid coexistence. In simple fluids, at low , the gas phase does not show significant clustering. Indeed, on increasing the density, the system transforms into a liquid phase, by establishing an infinite size percolating clusters, in the attempt to minimize the potential energy, being the entropic loss in the free energy (associated to the restricted sampling of the system available volume) made less relevant by the small . In the present case, the Janus potential allows for the establishment of significantly bonded aggregates, i.e. with a small potential energy, without the need of forming an infinite size cluster. By exposing the hard-core part to the exteriors, these clusters do not feel any driving force toward further clustering.
IV.2 Cluster Size Distributions, percolation
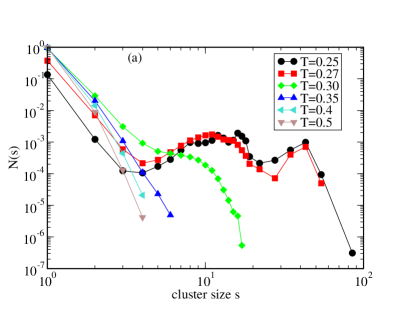
To quantify the effect of clustering and its and dependence we show in Fig. 6 the cluster size distribution, .
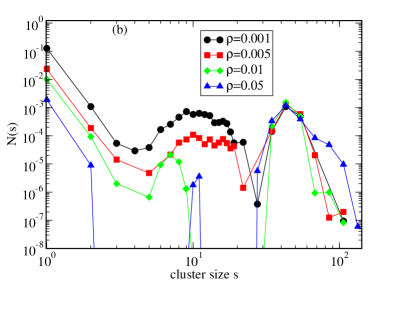
Below the critical temperature, the gas phase becomes populated by rather stable clusters. Particularly significant are clusters of size between 10-15 (micelles) and clusters between size 40 and 50 (vesicles). Other sizes are also found, but their statistical relevance decreases on decreasing . This feature appears clearly in the cluster size distribution, , shown in Fig. 6. On decreasing , the monotonic decaying develops a shoulder around , which evolves into a clear two-peaked function on further cooling, signaling the appearance of micelles and vesicles (Fig. 6-(a)). Part (b) of Fig. 6 shows the evolution of on increasing . The micelle peak progressively empties in favor of the vesicles peak, which at low and large are the most stable structures. Similar trends are seen at other or .
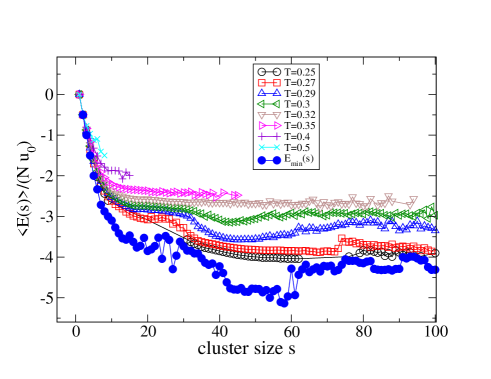
An indication of the relative stability of the clusters as a function of their size is provided by the cluster potential energy. Fig. 7 shows the average potential energy , averaged over all clusters of the same size, vs. size for different at fixed . One notices that for each size there are several distinct arrangements with different energies and entropies. On cooling, lower energy clusters become preferentially selected and decreases. One also notices a plateau between size 10 and 30 followed by an additional plateau, at low , starting from . The initial location of the plateaus coincides with the size of the mostly represented clusters. This can be understood by considering that the free energy of the system has both energetic and entropic contributions. When the potential energy per particle does not change with the size of the cluster, then it becomes convenient to the system to favor the formation of the smallest possible cluster with the same energy, since it will be possible in this way to maximize the total number of clusters and hence the translational component of the entropy.
Fig. 7 also shows the lowest energy configuration found for each cluster size, independently from temperature and density of the simulation. This curve provides an estimate for the cluster ground state and clearly show that the lowest-energy structures are the vesicles, i.e. clusters composed between 40 and 60 particles.
We have examined the connectivity properties of the different state points by evaluating the presence of clusters spanning the entire simulation box. When more than 50 per cent of the configurations are characterized by spanning clusters, the state point is classified as percolating. Fig. 4 shows the location of the percolating state points in the phase diagram. The cluster gas phase is never percolating, while the liquid states always are, so that percolation properties can also be used to distinguish between the two phases. We also confirm that the critical point is located inside the percolation region, confirming once more that a pre-requisite for critical phenomena is the existence of a percolating network of interactionsConiglio and Klein (1980).
IV.3 Structure Factor
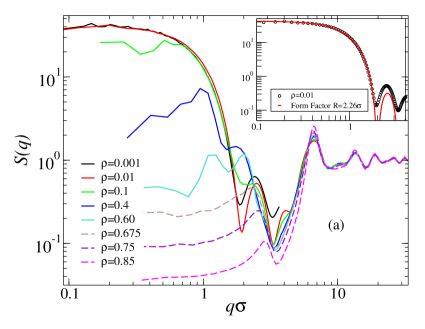
It is particularly relevant to look at the structure factor in this system both in the gas phase at low , when micelles and vesicles become prominent, as well as in the liquid phase. Fig. 8-(a) shows the evolution of the structure factor on increasing density at , across the gas-liquid transition. At this low , as discussed in Sec. IV.2, vesicles are the dominant clusters. The structure factor indeed evolves from the one characteristic of an ideal gas of spherical vesicles (and indeed the inset shows that is well represented by the form factor of a sphere of radius )
| (4) |
to the one of interacting spheres, in the micelle-rich gas phase. Indeed, on increasing , oscillations at arise, which correspond to distances comparable to the vesicle size. Beyond density the gas condenses into the liquid phase, where only a very weak pre-peak around is found.
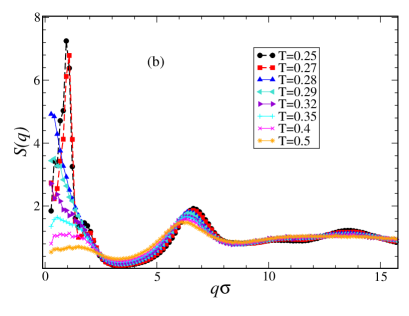
Fig. 8-(b) shows the evolution of the structure factor on cooling along the isochore. Compared to simple liquids, one observes a non negligible scattering at small , which progressively increases on approaching the phase separation. These are the standard critical fluctuations which are expected to diverge on approaching a spinodal line. While in simple liquids, below the spinodal temperature the system phase separate in a gas coexisting with a liquid phase, here, the peculiar shape of the gas-liquid coexistence line (Fig. 1) opens up new stable states, composed by interacting vesicles and becomes peaked at the vesicle-vesicle distance.
IV.4 Angular Correlations
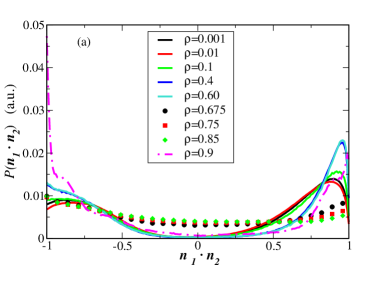
To provide evidence of the different ordering of the particles in the gas and in the liquid phase, we have calculated the distribution of relative orientations between all pairs of bonded particles. More precisely, we have evaluated the distribution of the scalar product where and are the two unit vectors indicating the location of the patch center in each particle frame, for all bonded pairs. The distribution is expected to show well defined peaks for an ordered state and to be flat in a completely disordered state. Fig. 9 shows such distribution for several values at low . The orientational differences between the ordered gas phase and the disordered liquid phase appear very clearly. On increasing , evolves from a highly structured function with peaks close to in the vesicle-rich gas phase, to a more uniform distribution for the liquid phase state points, going back to an evenly more structured function when the lamellar phase is entered. The peak at close to is created by the pairs of particle which face each other (as in a double-layer), while the peak at close to arises from particles which are forming the shells of the vesicle.
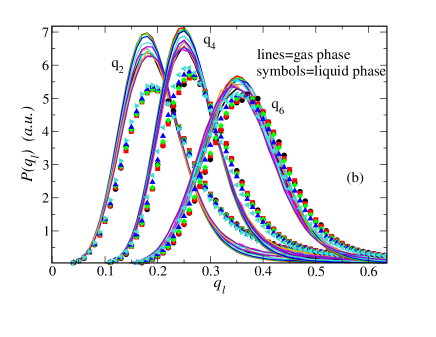
We note that, to quantify the orientational ordering in the system, it is necessary to identify an order parameter which does not depend on single-particle properties, since both gas and liquid phases are isotropic. We have also investigated the rotationally invariant local orderSteinhardt et al. (1983) indicators, which have been often exploited to quantify order in crystalline solids, liquids and colloidal gelsCampbell et al. (2005); Sciortino et al. (2005).
| (5) |
where is defined as,
| (6) |
Here is the set of bonded neighbors of a particle . The unit vector specifies the orientation of the bond between particles and . In a given coordinate frame, the orientation of the unit vector uniquely determines the polar and azimuthal angles and . The are the corresponding spherical harmonics. We have calculated the distribution of for the present model. As shown in Fig. 9-(b), the resulting distributions show systematic differences between gas and liquid phase, but it is hard to provide a clear connection with the degree of order in the system.
IV.5 Pathways for vesicles formation
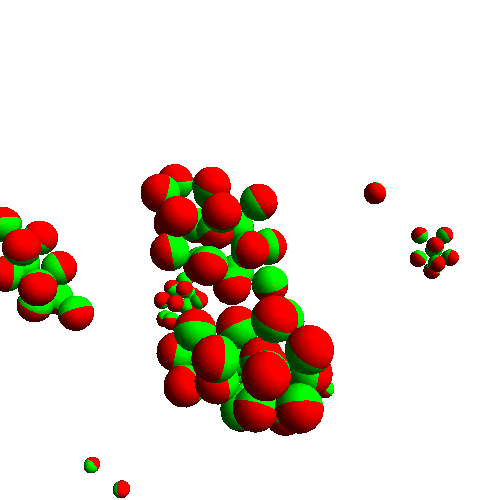
Despite Monte Carlo simulations do not allow for a precise definition of time, it is interesting to analyze how particles rearrange themselves into large aggregates. More specifically, the analysis of the sequence of MC configurations may help understanding how vesicles are generated. We have examined graphically several processes of formation of a vesicle starting from a monodisperse solution of particles and one of these processes is documented in Fig. 10. In all cases, the system starts by forming small clusters that grow by incorporating isolated monomers or colliding to similar clusters, to form micelles (Fig. 10-(a-c)). The transition to vesicle requires the interaction between three micelles (d-e), with the formation of a long cylindrical micelle (f) which then self-restructures itself into the more energetic vesicles configuration (g).
V Conclusions
This article reports a numerical study of a simple potential for Janus-like particles, i.e. colloidal spherical particles whose surface is divided evenly into two areas of different chemical composition. This study is motivated by the ongoing effort in the direction of synthesizing optimal Janus colloidsRoh et al. (2005); Wang et al. (2008); Chen et al. (2009); Jackson et al. (2004); Hong et al. (2008). The possibility of creating particles whose surface has different behavior on the two hemispheres significantly enlarges the richness of the resulting collective behaviors. The phase diagram, the ordered and disordered stable structures, the self-assembly properties of optimal clusters are indeed expected to finely depend on the chemistry and physical properties of the particle surface. For this reason, the assembly behavior of Janus particles is receiving a considerable attention even from a theoretical and numerical point of viewHong et al. (2006); Erdmann et al. (2003); Miller and Cacciuto (2009); Vanakaras (2006); Whitelam and Bon (2010). With proper choices of the chemico-physical surface properties, Janus particles can provide the most elementary and geometrically simple example of a surfactant particleErhardt et al. (2001), in which solvophilic and solvophobic areas reside on different part of the surface of the same particle.
Modeling of the phase behavior of these particles can be performed at different levels of realism. In this article we have chosen to implement the highest coarse-graining procedure, by considering the two sides of the particle as repulsive and attractive, and modeling each of them with the simplest corresponding potential, a hard-core plus a square-well. Despite this strong simplification, the phase diagram of the system displays a very rich behavior, with a colloidal-poor (gas) colloidal-rich (liquid) de-mixing region, which is progressively suppressed by the insurgence of micelles, thus providing a model where micelle formation and phase-separation are simultaneously observed. The study of this model shows that the suppression of the phase separation is driven by the possibility of building low energy clusters which are shielded by the presence of an external hard-sphere surface, diminishing the driving force for forming large-size aggregates. As a result, at low , the system organizes into a dispersion of orientational ordered micelles and vesicles, essentially interacting via excluded volume only.
Another advantage of studying the one-patch Kern-Frenkel potential is that the parameters of the potential can be tuned continuously from the square-well to the Janus potential, simply by changing the bonding angle, that is the coverage . This has made possible to follow the evolution of the gas-liquid coexistence curve with , thus including the Janus case which displays the inherintly interesting simultaneous presence of a critical point and of a micelle formation. It would be interesting in the future to explore more in details the transition from the standard gas-liquid coexistence to the more exotic Janus case exploring a more refined grid of values. It is of course possible that the stabilization of micelle and vesicles can take place already at but in a low region where numerical simulations can not be performed at the present time.
Several questions are still open including the role of the interaction range. Experimentally realized Janus particles are characterized by interaction ranges of the order of or smaller. The range width is an important variable, since it controls both the internal flexibility of the aggregates (and hence the cluster entropy) and the geometries of the lowest-energy aggregates (cluster energy). In this respect, it can not be a priori foreseen if micelle and vesicles will remain the most stable clusters on further decreasing the range. We are currently repeating our study for smaller ranges, but this requires a major computational effort, since clustering shifts to lower temperature, making studies of the phase diagram (in particular Gibbs ensemble calculations) extremely hard with present time numerical resources. The sensitivity of the cluster shape to the cluster range would be an important observation and could teach us a lot about how to control the shape of the assembly experimentally, and, perhaps, help us understanding geometric arrangements which are found in protein aggregates. In this respect it is worth noticing that micelles have been detected in the most recent experimental work of GranickHong et al. (2008) together with Bernal-spiral clusters, which have not been observed with the present model, perhaps due to differences in the interaction ranges.
VI Acknowledgements
FS acknowledges support from ERC-226207-PATCHYCOLLOIDS, ITN-234810-COMPLOIDS and NoE SoftComp NMP3-CT-2004-502235. AG acknowledges support from PRIN-COFIN 2007B57EAB(2008/2009). We thank C. De Michele for providing us with the code for generating Fig. 3 and Fig. 10, J. Horbach, J. Largo, J. Russo and M. Noro for discussions.
References
- Zhang et al. (2005) G. Zhang, D. Wang, and H. Möhwald, Angew. Chem. Int. Ed. 44, 1 (2005).
- Manoharan et al. (2003) V. N. Manoharan, M. T. Elsesser, and D. J. Pine, Science 301, 483 (2003).
- Cho et al. (2005) Y.-S. Cho, G.-R. Yi, J.-M. Lim, S.-H. Kim, V. N. Manoharan, D. J. Pine, and S.-M. Yang, J. Am. Chem. Soc. 127, 15968 (2005).
- Kraft et al. (2009) D. J. Kraft, J. Groenewold, and W. K. Kegel, Soft Matter 5, 3823 (2009).
- De Michele et al. (2006) C. De Michele, S. Gabrielli, P. Tartaglia, and F. Sciortino, J. Phys. Chem. B 110, 8064 (2006).
- Glotzer and Solomon (2007) S. C. Glotzer and M. J. Solomon, Nat. Mat. 6, 557 (2007).
- Pawar and Kretzschmar (2010) A. B. Pawar and I. Kretzschmar, Macromol. Rapid Comm. 31, 150 (2010).
- Maldovan and Thomas (2004) M. Maldovan and E. Thomas, Nat. Mat. 3, 593Ð600 (2004).
- Roh et al. (2005) K.-H. Roh, D. C. Martin, and J. Lahann, Nature Materials 4, 759 (2005).
- Hong et al. (2006) L. Hong, A. Cacciuto, E. Luijten, and S. Granick, Nano Letters 6, 2510 (2006).
- Hong et al. (2008) L. Hong, A. Cacciuto, E. Luijten, and S. Granick, Langmuir 24, 621 (2008).
- Wang et al. (2008) B. Wang, B. Li, B. Zhao, and C. Y. Li, J. Am. Chem. Soc. 130, 11594 (2008).
- Jackson et al. (2004) A. M. Jackson, J. W. Myerson, and F. Stellacci, Nat. Mat. 3, 330 (2004).
- Kern and Frenkel (2003) N. Kern and D. Frenkel, J. Chem. Phys. 118, 9882 (2003).
- Bianchi et al. (2006) E. Bianchi, J. Largo, P. Tartaglia, E. Zaccarelli, and F. Sciortino, Phys. Rev. Lett. 97, 168301 (2006).
- Bianchi et al. (2008) E. Bianchi, P. Tartaglia, E. Zaccarelli, and F. Sciortino, J. Chem. Phys. 128, 144504 (2008), eprint 0802.2466.
- Wilber et al. (2007) A. W. Wilber, J. P. K. Doye, A. A. Louis, E. G. Noya, M. A. Miller, and P. Wong, J. Chem. Phys. 127, 085106 (2007).
- Doye et al. (2007) J. P. K. Doye, A. A. Louis, I.-C. Lin, L. R. Allen, E. G. Noya, A. W. Wilber, H. C. Kok, and R. Lyus, Phys. Chem. Chem. Phys. 9, 2197 (2007).
- Foffi and Sciortino (2007) G. Foffi and F. Sciortino, J. Phys. Chem. B 111, 9702 (2007).
- Whitelam and Bon (2010) S. Whitelam and S. A. F. Bon, J. Chem. Phys. 132, 074901 (2010).
- Sear (1999) R. P. Sear, J. Chem. Phys. 111, 4800 (1999).
- Lomakin et al. (1999) A. Lomakin, N. Asherie, and G. Benedek, Proc. Natl. Acad. Sci. 96, 9465 (1999).
- Liu et al. (2007) H. Liu, S. K. Kumar, and F. Sciortino, J. Chem. Phys. 127, 084902 (2007).
- Li et al. (2009) X. Li, J. D. Gunton, and A. Chakrabarti, J. Chem. Phys. 131, 115101 (2009).
- Wertheim (1984) M. Wertheim, J. Stat. Phys. 35, 19, ibid. 35 (1984).
- Wertheim (1986) M. Wertheim, J. Stat. Phys. 42, 459, ibid. 477 (1986).
- Vakarin et al. (1997) E. Vakarin, Y. Duda, and M. F. Holovko, Molecular Physics 90, 611 (1997).
- Jirsák and Nezbeda (2007) J. Jirsák and I. Nezbeda, J. Chem. Phys. 127, 124508 (2007).
- Fantoni et al. (2007) R. Fantoni, D. Gazzillo, A. Giacometti, M. A. Miller, and G. Pastore, J. Chem. Phys. 127, 234507 (2007).
- Giacometti et al. (2009) A. Giacometti, F. Lado, J. Largo, G. Pastore, and F. Sciortino, J. Chem. Phys. 131, 174114 (2009).
- Giacometti et al. (2010) A. Giacometti, F. Lado, J. Largo, G. Pastore, and F. Sciortino, J. Chem. Phys. 132, 174110 (2010).
- Smith and Frenkel (1996) B. Smith and D. Frenkel, Understanding molecular simulations (Academic, New York, 1996).
- Wilding (1996) N. B. Wilding, J. Phys.: Condens. Matter 9, 585 (1996).
- Romano et al. (2007) F. Romano, P. Tartaglia, and F. Sciortino, J. Phys.: Condens. Matter 19, 322101 (2007).
- Panagiotopoulos (1987) A. Z. Panagiotopoulos, Mol. Phys. 61, 813 (1987).
- Gambassi et al. (2009) A. Gambassi, C. Hertlein, L. Helden, S. Dietrich, and C. Bechinger, Europhysics News 40, 18 (2009).
- Soyka et al. (2008) F. Soyka, O. Zvyagolskaya, C. Hertlein, L. Helden, and C. Bechinger, Phys. Rev. Lett. 101, 208301 (2008).
- Walther and Müller (2008) A. Walther and H. Müller, Soft Matter 4, 663 (2008).
- Bianchi et al. (2007) E. Bianchi, P. Tartaglia, E. La Nave, and F. Sciortino, J. Phys. Chem. B 111, 11765 (2007).
- Romano et al. (2009) F. Romano, E. Sanz, and F. Sciortino, J. Phys. Chem. B 113, 15133 (2009).
- Fornleitner et al. (2008) J. Fornleitner, F. Lo Verso, G. Kahl, and L. C. N., Soft Matter 4, 480 (2008).
- Filion et al. (2009) L. Filion, M. Marechal, B. van Oorschot, D. Pelt, F. Smallenburg, and M. Dijkstra, Phys. Rev. Letts. 103, 188302 (2009).
- Romano et al. (2010) F. Romano, E. Sanz, and F. Sciortino, J. Chem. Phys. 132, 184501 (2010).
- Hagen and Frenkel (1994) M. H. J. Hagen and D. Frenkel, J. Chem. Phys. 101, 4093 (1994).
- Ilett et al. (1995) S. M. Ilett, A. Orrock, W. C. K. Poon, and P. N. Pusey, Phys. Rev. E 51, 1344 (1995).
- Sciortino et al. (2009) F. Sciortino, A. Giacometti, and G. Pastore, Phys. Rev. Letts. 103, 237801 (2009).
- D. Fennell Evans and H. Wennerström (1999) D. Fennell Evans and H. Wennerström, The colloidal domain (Wiley-Vch, 1999).
- Coniglio and Klein (1980) A. Coniglio and W. Klein, J. Phys. A 13, 2775 (1980).
- Steinhardt et al. (1983) P. J. Steinhardt, D. R. Nelson, and M. Ronchetti, Phys. Rev. B 28, 784 (1983).
- Campbell et al. (2005) A. I. Campbell, V. J. Anderson, J. S. van Duijneveldt, and P. Bartlett, Phys.Rev.Lett. 94, 208301 (2005).
- Sciortino et al. (2005) F. Sciortino, P. Tartaglia, and E. Zaccarelli, J. Phys. Chem. B 109, 21942 (2005).
- Chen et al. (2009) C.-H. Chen, R. K. Shah, A. R. Abate, and D. A. Weitz, Langmuir 25, 4320 (2009).
- Erdmann et al. (2003) T. Erdmann, M. Kröger, and S. Hess, Phys. Rev. E 67, 041209 (2003).
- Miller and Cacciuto (2009) W. L. Miller and A. Cacciuto, Phys. Rev. E 80, 029903 (2009).
- Vanakaras (2006) A. G. Vanakaras, Langmuir 22, 88 (2006).
- Erhardt et al. (2001) R. Erhardt, A. Boker, H. Zettl, H. Kaya, W. Pyckhout-Hintzen, G. Krausch, V. Abetz, and A. H. E. Muller, Macromolecules 34, 1069 (2001).