The 2008-2009 outburst of the young binary system Z CMa unraveled by interferometry with high spectral resolution
Abstract
Z CMa is a young binary system consisting of an Herbig primary and a FU Ori companion. Both components seem to be surrounded by active accretion disks and a jet was associated to the Herbig B0. In Nov. 2008, K. Grankin discovered that Z CMa was exhibiting an outburst with an amplitude larger than any photometric variations recorded in the last 25 years. To study the innermost regions in which the outburst occurs and understand its origin, we have observed both binary components with AMBER/VLTI across the Brγ emission line in Dec. 2009 in medium and high spectral resolution modes. Our observations show that the Herbig Be, responsible for the increase of luminosity, also produces a strong Brγ emission, and they allow us to disentangle from various origins by locating the emission at each velocities through the line. Considering a model of a Keplerian disk alone fails at reproducing the asymmetric spectro-astrometric measurements, suggesting a major contribution from an outflow.
keywords:
Astrophysics, Young star, Circumstellar Matter, Interferometry, Infrared, Outburst1 Introduction
Accretion plays an important role in star and planet formation. For many years, it was considered to be a slow quasi-stationary process[1], occurring mostly through a viscous disk ending in its inner part by a boundary layer[2] with the star or by magnetospheric funnels[3, 4]. However, this scenario has been challenged by observations[5, 6] that suggest that the accretion process could be time-variable and occur quickly by means of short high mass accretion rate bursts. Studying the very inner region of a young stellar object that is known to experience episodic photometric outbursts is thus of prime importance to understand the role of accretion in the formation of the star and its environment.
The study presented in this paper is part of a large observational campaign targeting Z CMa during its 2008 outburst that aims to understand its origin. To directly probe the morphology of the hot gas in the inner AUs, we took advantage of the spatial and spectral resolution available at the VLTI to perform micro-arcsecond spectro-astrometry. With AMBER, we resolve the -band emission of the hot gas surrounding each star at the milliarcsecond resolution. This paper outlines the analysis already published by Benisty et al. (2010)[7].
2 The system Z Canis Majoris
Z CMa is a pre-main-sequence binary with a separation[9, 10] of 0.1” located at a distance estimated[11, 12] from 930 to 1150 pc. The primary, embedded in a dust cocoon, was identified as a Herbig Be star based on spectropolarimetry[13]. It is surrounded by an inclined disk, possibly a circumbinary disk, as inferred from millimeter observations[14], and dominates the infrared continuum and total luminosity of the system. In contrast, the secondary is the major source of continuum emission at visual wavelengths. Although the secondary has not undergone a large outburst this century, it was identified as a FU Or object based on its broad double-peaked optical absorption lines, which are typical of a circumstellar disk that undergoes a strong accretion, and spectral type[15] of F-G. In the past twenty years, the Z CMa system exhibited repeated brightness variations, of 0.5-1 visual magnitude, which were attributed to the Herbig Be star[16]. Z CMa is clearly associated with a bipolar outflow[17, 18] that extends to 3.6 pc along PA240∘. A 1”x0.24” micro-jet[19] was detected in the [OI] 6300Å line in the same direction, and the authors of this work[19] concluded that the optical emission-line spectrum and the jet are associated with the primary. However, the innermost environments of the Z CMa components have been poorly studied. Two broad-band interferometric measurements have been obtained, allowing only characteristic sizes[20, 21] of the -band continuum emission to be derived.
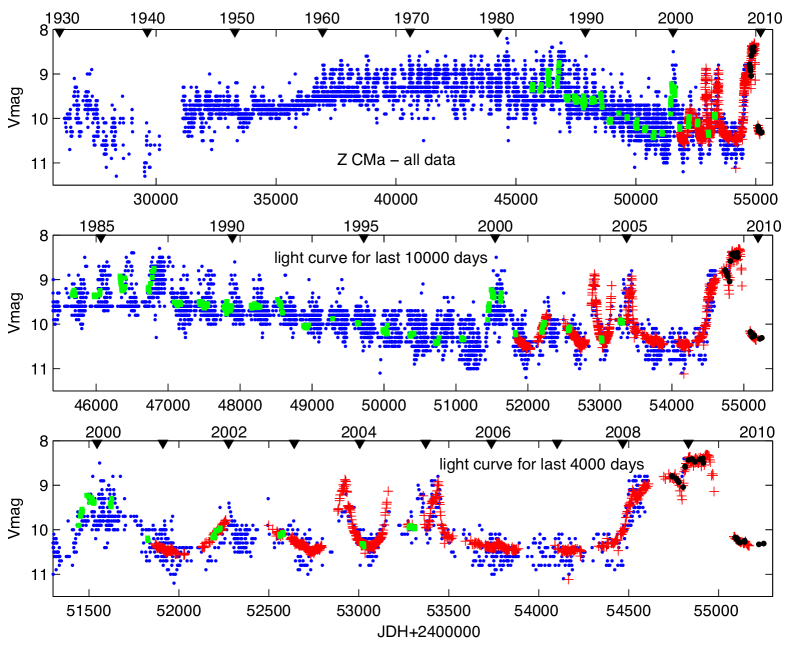
In January 2008, Z CMa’s brightness increased[8] by about two visual magnitudes, representing the largest outburst observed in the past 90 years (see Fig. 1). Based on spectropolarimetric observations[22], this outburst was considered to be associated with the Herbig Be star. The overall spectral energy distribution of the system is strongly modified during the outburst at wavelengths shorter than 10 m, which indicates that the outburst originates close to the star.
3 Observations and data processing
Z CMa was observed at the Very Large Telescope Interferometer[23] (VLTI), using the AMBER instrument[24] that allows the simultaneous combination of three beams in the near-infrared. The instrument delivers spectrally dispersed interferometric observables (visibilities, closure phases, differential phases) at spectral resolutions up to 12 000.
| Date | Baseline | Projected | Position | ||
| length (m) | angle (∘) | ||||
| 05/12/08 | D0-G1 | 69 | 137 | 1500 | FUOr+HBe |
| 07/12/08 | K0-G1 | 89 | 28 | 12000 | FUOr+HBe |
| 09/12/08 | K0-G1 | 88 | 24 | 12000 | FUOr+HBe |
| 15/12/08 | U2-U3 | 44 | 35 | 1500 | |
| U3-U4 | 62 | 107 | |||
| U2-U4 | 86 | 78 | |||
| 16/12/08 | U1-U2 | 56 | 35 | 1500 | |
| U2-U4 | 77 | 88 | |||
| U1-U4 | 120 | 66 | |||
| 10/01/10 | D0-G1 | 71 | 133 | 1500 | FUOr+HBe |
| Note: is the spectral resolution. ’FUOr+HBe’ specifies when the binary is in the field of view. | |||||
We report -band observations taken in the medium spectral resolution mode (MR; R1500) with the 8.2 m Unit Telescopes (UTs) as well as with the 1.8 m Auxiliary Telescopes (ATs), and in the high spectral resolution mode (HR; R12 000) with the ATs. The data were obtained within programs of Guaranteed Time, Director’s Discretionary Time, and Open Time observations. Z CMa was observed with 11 different baselines of 4 VLTI configurations, during 5 nights in December 2008 and one night in January 2010 (see Table 1 for the summary of observations; the baselines G1-A0 and K0-A0 which could not be used are not reported). The longest baseline is 120 m corresponding to a maximum angular resolution of 3.7 mas. With the UTs, the observations are coupled with the use of adaptive optics and the resulting field of view ranges from 50 to 60 mas. This allowed us to spatially resolve the binary and obtain separate measurements of the FU Or and the Herbig Be. In contrast, the ATs field-of-view, ranging from 230 to 280 mas, includes both stars and the interferometric signal results from both emissions. In addition to Z CMa, calibrators (HD45420, HD60742, HD55137, HD55832) were observed to correct for instrumental effects. All observations were performed using the fringe-tracker FINITO[25].
The data reduction was performed following the standard procedures[26, 27], using the amdlib package, release 2.99, and the yorick interface provided by the Jean-Marie Mariotti Center111http://www.jmmc.fr/amberdrs. Raw spectral visibilities, differential phases, and closure phases were extracted for all the frames of each observing file. A selection of 80% of the highest quality frames was made and to avoid the effects of instrumental jitter and unsatisfactory light injection. Consecutive observations were merged to enhance the signal-to-noise ratio. Calibration of the AMBER+VLTI instrumental transfer function was done using measurements of the calibrators, after correcting for their diameter. The accuracy of the wavelength/velocity calibration is km/s. Because the -band continuum measured by the ATs (due to both stars) is very resolved on long baselines (), the observations obtained on the G1-A0 and K0-A0 baselines could unfortunately not be exploited. The absolute value of the visibilities obtained with the UT baselines could not be determined due to random vibrations of the telescopes. However, this issue affects all spectral channels in the same way, and does not modify our conclusions.
4 Findings
We recall that the visibilities provide information about the spatial extent of the emission, and decrease as the extension increases. Differential phases provide a measurement of the photocenter displacements across the sky, projected along the baseline direction. They can therefore be converted into differential spectro-astrometric shifts. They are measured relative to the continuum, for which we assume a zero phase. Finally, the closure phases are related to the asymmetry of the brightness distribution (e.g., they are null for a point-symmetric object).
4.1 The Brγ line is present only during the outburst
Fig. 2 compares the spectra and the visibilities obtained during and after the outburst: the emission line, and the signature in the visibilities, disappear after the outburst. Plotted within a large velocity range, the visibilities show a typical signature of binarity (i.e., a cosine modulation), in agreement with the system main characteristics (separation, position angle, flux ratio; Bonnefoy et al., in prep.).
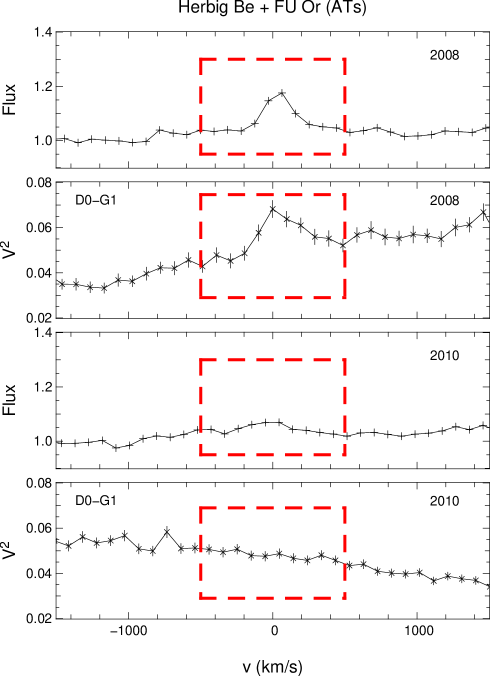
The main consequence of the outburst at least for interferometric observations is to produce a Brγ in the spectrum and a raise of the visibility which disappears when the outburst is over. Therefore, the origin of the outburst must be searched in the emission line, the Brγ line being well-suited.
4.2 The outburst is seen only in the Herbig Be component
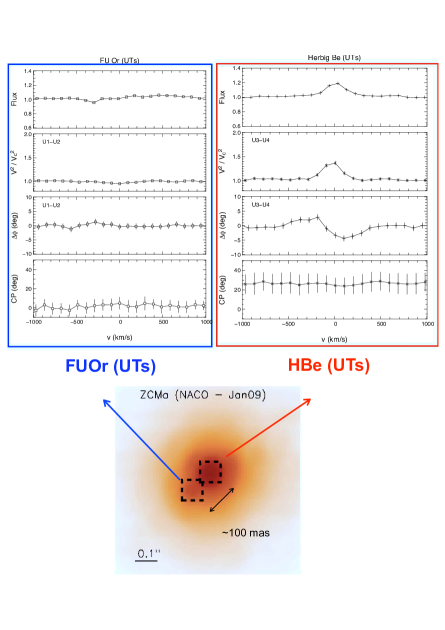
The left and right columns of Fig. 3 present examples of the MR observations obtained with the UTs for each star during the outburst. Each column includes a spectrum (normalized to the continuum), squared visibilities, differential phases, and closure phases. Since the absolute values of the visibilities measured with the UTs are unknown, we normalized the continuum values to 1 – even though the emission is resolved.
For the FU Or (left panels), within the error bars, the spectrum shows Brγ in neither emission nor absorption. Consequently, no change in the visibilities or phases across the line is expected nor seen. In contrast, the Herbig Be star exhibits a clear Brγ line in emission (right panels), although at this spectral resolution (200 km/s), the line is not spectrally resolved. The visibility increases through the line and the differential phases produce an S-shape variation. The closure phases differ from zero, with values of 2512∘. The phase, line, and visibility signals are present from -600 to 500 km/s, although because of the low line-to-continuum ratio in the extended wings, the flux and visibilities appear narrower. Within the large errors, no variation in the closure phases is detected across the line.
4.3 Size of the Herbig Be system in the continuum and in Brγ
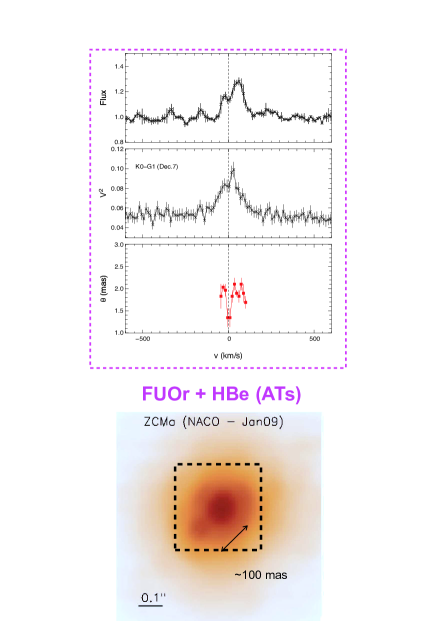
Figure 4 shows measurements obtained with the ATs, i.e., with both stars in the field of view. In this case, the level of continuum is determined by both stellar components. These panels present observations obtained in high spectral resolution (). In this case, the line is spatially and spectrally resolved (25 km/s), and the spectra exhibit a clear double-peaked and asymmetric profiles, with less emission at blueshifted velocities. The spectral visibilities present a similar profile.
From the visibilities, one can locate the emission at each velocity and distinguish between various scenarios capable of producing the line. The visibility increase within the line implies that the Brγ emitting region is more compact than the one responsible for the continuum. To derive the characteristic sizes of the region emitting Brγ only, for each spectral channel of the HR measurements, one has to subtract the underlying continuum to first determine the visibility of the line only[28]. These estimates can only be performed using the data gathered with the ATs, for which reliable absolute values for the Brγ visibilities are obtained. Using a model of an uniform ring, the emission in the line has a typical extension (ring diameter) of 1.6 mas at zero velocity, and 2.5 mas at higher velocities (100 km/s), i.e., from 1.5 to 2.6 AU, depending on the distance.
As the continuum emission measured with the ATs includes both stars, it is not direct to establish the typical size of the Herbig Be continuum. In contrast, the UTs data includes only one stellar component. Although no absolute visibility values can be obtained, size ratios between the line and the continuum can be derived. Using the sizes previously estimated for the line from the ATs data, typical sizes of 3.4 mas (3.6 AU) for the Herbig Be -band continuum can be determined, in agreement with the previous estimate[20] (3.9 mas in 2004;).
Considering a dust sublimation temperature around 1500-2000 K[29], and the stellar properties determined by van den Ancker et al. (2004) [16], the inner edge of the dusty disk must be located at 4-7 AU, in agreement with our findings. An asymmetry in the inclined inner disk could explain the non-zero closure phases measured at a level similar to other Herbig AeBe stars[30, 31]. Such methodology is however uncertain as it depends on the stellar contribution of the Herbig Be to the -band continuum, that is unknown.
The Brγ emitting region in the Herbig Be component is therefore more compact than the one responsible for the continuum.
4.4 Spectro-astrometry of the Brγ line
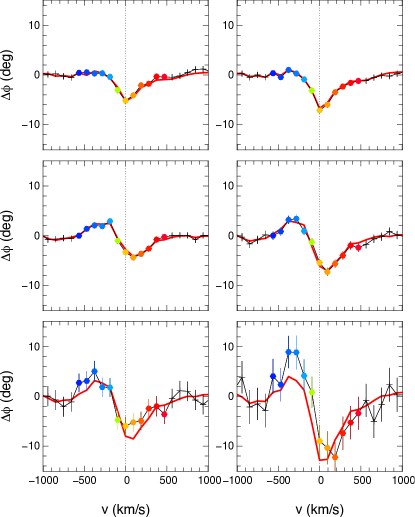
The differential phases which are represented in Fig. 5 can be expressed in terms of photocenter displacements [32] (in arcseconds), given by , where and are the wavelength and the projected baseline length of the observations, respectively. is the projection along the baseline direction, of the 2D photocenter vector in the plane of the sky (i.e., of a spectro-astrometric signal).
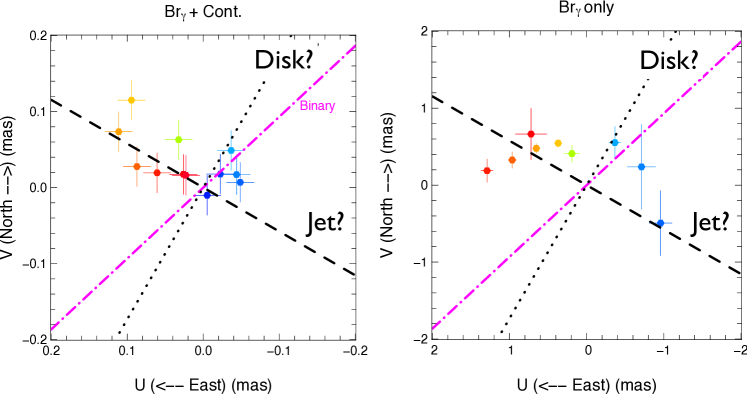
We fitted all the differential phases along the 6 available baselines with a single vector , independently of each spectral channel. Figure 5 shows the differential phases and the best solution for . The left plot of Fig. 6 gives in a 2D map of the plane of the sky. Clear asymmetric displacements, up to 150 micro-arcseconds, are observed, both at red-shifted and blue-shifted velocities. In this case, accounts for the emission of both the line and the continuum.
Subtracting the continuum contribution to determine the photocenter displacements, , due to the line only, is difficult, as it has to be done in the complex visibility plane. We provide such an attempt in the velocity range where the line is clearly detected ([-350;350] km/s, with line-to-continuum ratio larger than 1.05). As can be seen in the right panel of Fig. 6, the displacements are much larger (up to 1 mas) with the largest measured at the highest velocities, and appear more spread. Nonetheless, the observed asymmetry is still consistent with the closure phase measurements that show no change through the line, within the large errors.
5 Interpretation: Accretion or ejection signature?
As has already been discussed in previous studies[33, 34], the Brγ line could be emitted by a variety of mechanisms, such as accretion of matter onto the star, in a gaseous disk, or in outflowing matter. The spectra obtained at high spectral resolution show a double-peaked and asymmetric profile that can be interpreted in the context of the formation of optically thick lines in a dense environment with a temperature gradient[35, 36].
5.1 Infalling envelope of gas?
Formation of the Brγ line in an infalling envelope of gas can be ruled out. Considering that the line excitation temperature increases towards the star, if the line is emitted in infall of matter, or accretion flows, the profile would be double peaked but with an opposite asymmetry to what is observed (see Fig. 4, i.e. with a lower emission at redshifted velocities[37, 38]). In addition, in that case, the smallest extension and photocenter displacements would be expected at the highest velocities, which is in disagreement with our findings (see Figs. 4 and 6).
5.2 Hot layers of a gaseous disk?
The possibility that the Brγ line forms in the hot layers of the gaseous disk can also be ruled out. If one considers that the circumstellar disk surrounding the Herbig Be star is perpendicular to the large-scale jet at PA240∘, it would be expected that the velocities projected onto the line of sight cancel out along the semi-minor axis, while large spectro-astrometric displacements are seen along this axis at high velocities (Fig. 6). Apart from this, the displacements increase with velocity while Keplerian rotation should behave in the opposite way, and a phase signal is measured up to high velocities (500 km/s), which are much larger than the expected Keplerian velocities (100-120 km/s at 1 AU). It therefore seems unlikely that the Brγ line is emitted in the disk.
5.3 Bipolar wind or base of a jet?
We consider that the most likely origin of the Brγ emission is a wind. Strong winds are expected to take place in massive Herbig Be[40, 41], and could be responsible for the Brγ emission. The double peaked and asymmetric line profile is consistent with outflowing matter emitting in optically thick lines[42]. The visibilities and the 2D maps of the astrometric signal also support this conclusion as the blue- and redshifted emissions are located on each side of the possible disk position angle, with the largest Brγ displacements and characteristic sizes being derived at higher velocities.
Our observations suggest that the disk is slightly inclined, to allow both red- and blueshifted emissions to be seen. We may be seeing the emission from a wind partly through an optically thin inner hole in the optically thick dusty disk[43, 44]. Alternatively, if the inner gaseous disk were optically thick, we may be seeing the redshifted emission through a much smaller hole and via scattering on the disk surface. Fig. 4 suggests also that the red lobe is larger than the blue lobe. Could this be due to the fact that, because of the hole in the disk, we see only a smaller part of the blue lobe on the other side of the disk? This agrees with the size of the displacements of the photocenter.
Whether the innermost disk is optically thick or not cannot be determined with our observations and no reliable estimate of the mass accretion rate exists for such high mass young stars. However, the presence of the CO overtone lines in emission (Bonnefoy et al., in prep) is indicative of a much lower mass accretion rate than those derived for FU Ors (Myr-1)[45, 46].
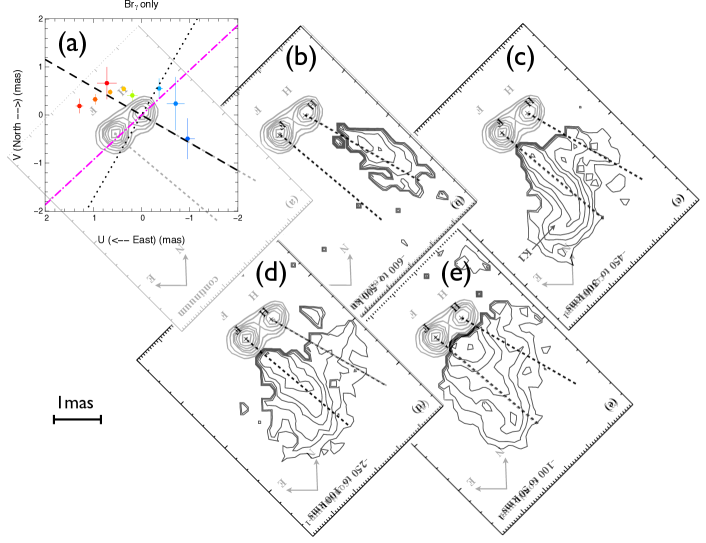
At the spatial resolutions provided by the VLTI, we trace the regions close to the inner disk hole and it is therefore unsurprising that we could detect redshifted emission, while on scales of 10-100 AU, the redshifted lobe is obscured by the circumstellar disk[17, 19] (see Fig. 7; Whelan et al. 2010[39]). During this outburst, deep blueshifted absorption was detected in the Balmer lines from zero velocity to 700 km/s, in addition to the absence of redshifted emission at similar velocities[20] (Bouvier et al., in prep), supporting our conclusion that there is a strong wind in the Herbig Be.
Could our new observations be tracing the base of the jet seen at larger scale and be in fact the inner parts of the parsec scale outflow? As shown in Fig. 6, the astrometric signal is detected at a slightly different position angle and spans a range broader than 60∘, a value commonly assumed for the opening angle of the jets. At these spatial scales, it is unlikely that the jet is already collimated. The different position angle with respect to the larger scale jet (see Fig. 7) could be due to jet precession. Our observations exclude a fully spherical wind since in that case no displacement would be expected between the redshifted and blueshifted emission lobes. The derived spectro-astrometric signatures favor a bipolar wind, maybe unrelated to the jet, but can not determine whether its geometry is that of a disk-wind or a stellar wind.
5.4 Outburst: accretion seen through massive ejection?
After detecting the same level of optical polarisation in both continuum and spectral lines along a position angle roughly perpendicular to the large-scale jet, Szeifert et al. (2010)[22] concluded that this outburst is related to a change in the path along which the photons escape from the dust cocoon. The disappearance of the Brγ emission line, with respect to the continuum, after the outburst, suggests that its emission is related to the outburst. A strong mass ejection event could account for the deep blueshifted absorption features seen in the Balmer lines that are emitted close to the star as well as for the Brγ line emitted in outer layers of the wind. Outside the outburst, the wind disappears or is more likely to be maintained at a much smaller mass loss rate. Based on these conclusions, one can speculate about the origin of the outburst, as being driven by an event of enhanced mass accretion, similar to the EX Ors and FU Ors outbursts[47]. In that case, this would suggest a strong link between mass accretion and ejection during the outburst, probably coupled with a magnetic field as in lower-mass young stars.
Whether the innermost disk is optically thick or not can not be determined with our observations and no reliable estimate of the mass accretion rate exists for such high mass young stars. However, the presence of the CO overtone lines in emission (Bonnefoy et al., in prep.) suggests a much lower mass accretion rate than the ones derived for FU Ors.
6 Conclusion
We have presented spatially and spectrally resolved interferometric observations of the -band emission in the Z CMa system. These observations were performed during the largest photometric outburst detected so far, that occurred in the innermost regions of the Herbig Be star.
We found that the Brγ line profile, the astrometric signal, and the characteristic sizes across the line are inconsistent with a Keplerian disk or with infall of matter. They are, instead, evidence of a bipolar wind seen through a disk hole, inside the dust sublimation radius.
The disappearance of the Brγ emission line after the outburst suggests that the outburst is related to a period of strong mass loss. Based on these conclusions, we speculate that the origin of the outburst is an event of enhanced mass accretion, and that it does not result from a change in the system obscuration by dust. If this is valid, our results would suggest that the link between mass accretion and ejection as observed for quiescent T Tauri stars can also be at play in more massive young stars, and in high-accretion states. Is this accretion-ejection link universal, independent of the central mass?
Finally, this paper illustrates the great potential of the combination of spectro-astrometric and interferometric techniques for observing structures on micro-arcsecond scales. It may provide strong constraints on the mechanisms at play.
Acknowledgements.
We thank the VLTI team at Paranal, as well as R. Cesaroni, S. Antoniucci, L. Podio, P. Stee and M. van den Ancker for fruitful discussions. M.B. acknowledges funding from INAF (grant ASI-INAF I/016/07/0).References
- [1] Stahler, S. W., “Deuterium and the stellar birthline,” ApJ 332, 804–825 (1988).
- [2] Bertout, C., Basri, G., and Bouvier, J., “Accretion disks around T Tauri stars,” ApJ 330, 350–373 (1988).
- [3] Koenigl, A., “Disk accretion onto magnetic T Tauri stars,” ApJ 370, L39–L43 (1991).
- [4] Calvet, N. and Hartmann, L., “Balmer line profiles for infalling T Tauri envelopes,” ApJ 386, 239–247 (1992).
- [5] Kenyon, S. J., Hartmann, L. W., Strom, K. M., and Strom, S. E., “An IRAS survey of the Taurus-Auriga molecular cloud,” AJ 99, 869–887 (1990).
- [6] Evans, N. J., Dunham, M. M., Jørgensen, J. K., and coll., “The Spitzer c2d Legacy Results: Star-Formation Rates and Efficiencies; Evolution and Lifetimes,” ApJS 181, 321–350 (2009).
- [7] Benisty, M., Malbet, F., Dougados, C., Natta, A., Le Bouquin, J. B., Massi, F., Bonnefoy, M., Bouvier, J., Chauvin, G., Chesneau, O., Garcia, P. J. V., Grankin, K., Isella, A., Ratzka, T., Tatulli, E., Testi, L., Weigelt, G., and Whelan, E. T., “The 2008 outburst in the young stellar system ZCMa: I. Evidence of an enhanced bipolar wind on the AU-scale,” A&A in press, arXiv:1007.0682 (2010).
- [8] Grankin, K. N. and Artemenko, S. A., “New Extreme Outburst of Z CMa,” IBVS 5905, 1–+ (2009).
- [9] Koresko, C. D., Beckwith, S. V. W., Ghez, A. M., and et al., “An infrared companion to Z Canis Majoris,” AJ 102, 2073–2078 (1991).
- [10] Barth, W., Weigelt, G., and Zinnecker, H., “Speckle masking observations of the young binary Z Canis Majoris,” A&A 291, 500–504 (1994).
- [11] Clariá, J. J., “A study of the stellar association Canis Major OB 1.,” A&A 37, 229–236 (1974).
- [12] Kaltcheva, N. T. and Hilditch, R. W., “The distribution of bright OB stars in the Canis Major-Puppis-Vela region of the Milky Way,” MNRAS 312, 753–768 (2000).
- [13] Whitney, B., Clayton, G., Schulte-Ladbeck, R., Calvet, N., Hartmann, L., and Kenyon, S., “Spectrum of the “Invisible” Companion of Z Canis Majoris Revealed in Polarized Light,” ApJ 417, 687–+ (1993).
- [14] Alonso-Albi, T., Fuente, A., Bachiller, R., Neri, R., Planesas, P., Testi, L., Berné, O., and Joblin, C., “Circumstellar disks around Herbig Be stars,” A&A 497, 117–136 (2009).
- [15] Hartmann, L., Kenyon, S. J., Hewett, R., Edwards, S., Strom, K. M., Strom, S. E., and Stauffer, J. R., “Pre-main-sequence disk accretion in Z Canis Majoris,” ApJ 338, 1001–1010 (1989).
- [16] van den Ancker, M., Blondel, P., Tjin A Djie, H., Grankin, K., Ezhkova, O., Shevchenko, V., Guenther, E., and Acke, B., “The stellar composition of the star formation region CMa R1 - III. A new outburst of the Be star component in Z CMa,” MNRAS 349, 1516–1536 (2004).
- [17] Poetzel, R., Mundt, R., and Ray, T. P., “Z CMa - A large-scale high velocity bipolar outflow traced by Herbig-Haro objects and a jet,” A&A 224, L13–L16 (1989).
- [18] Evans, N., Balkum, S., Levreault, R., and et al., “Molecular outflows from FU Orionis stars,” ApJ 424, 793–799 (1994).
- [19] Garcia, P. J. V., Thiébaut, E., and Bacon, R., “Spatially resolved spectroscopy of Z Canis Majoris components,” A&A 346, 892–896 (1999).
- [20] Monnier, J. D., Millan-Gabet, R., Billmeier, R., and coll., “The Near-Infrared Size-Luminosity Relations for Herbig Ae/Be Disks,” ApJ 624, 832–840 (2005).
- [21] Millan-Gabet, R., Monnier, J. D., Akeson, R. L., and coll., “Keck Interferometer Observations of FU Orionis Objects,” ApJ 641, 547–555 (2006).
- [22] Szeifert, T., Hubrig, S., Schöller, M., Schütz, O., Stelzer, B., and Mikulášek, Z., “The nature of the recent extreme outburst of the Herbig Be/FU Orionis binary Z Canis Majoris,” A&A 509, L7+ (2010).
- [23] Schöller, M., “The Very Large Telescope Interferometer: Current facility and prospects,” New Astronomy Review 51, 628–638 (2007).
- [24] Petrov, R. G., Malbet, F., Weigelt, G., and coll., “AMBER, the near-infrared spectro-interferometric three-telescope VLTI instrument,” A&A 464, 1–12 (2007).
- [25] Le Bouquin, J.-B., Bauvir, B., Haguenauer, P., Schöller, M., Rantakyrö, F., and Menardi, S., “First result with AMBER+FINITO on the VLTI: the high-precision angular diameter of V3879 Sagittarii,” A&A 481, 553–557 (2008).
- [26] Tatulli, E., Millour, F., Chelli, A., and coll., “Interferometric data reduction with AMBER/VLTI. Principle, estimators, and illustration,” A&A 464, 29–42 (2007).
- [27] Chelli, A., Utrera, O. H., and Duvert, G., “Optimised data reduction for the AMBER/VLTI instrument,” A&A 502, 705–709 (2009).
- [28] Weigelt, G., Kraus, S., Driebe, T., and coll., “Near-infrared interferometry of Carinae with spectral resolutions of 1 500 and 12 000 using AMBER/VLTI,” A&A 464, 87–106 (2007).
- [29] Pollack, J. B., Hollenbach, D., Beckwith, S., Simonelli, D. P., Roush, T., and Fong, W., “Composition and radiative properties of grains in molecular clouds and accretion disks,” ApJ 421, 615–639 (1994).
- [30] Kraus, S., Hofmann, K., Malbet, F., Meilland, A., Natta, A., Schertl, D., Stee, P., and Weigelt, G., “Revealing the sub-AU asymmetries of the inner dust rim in the disk around the Herbig Ae star R Coronae Austrinae,” A&A 508, 787–803 (2009).
- [31] Benisty, M., Natta, A., Isella, A., and coll., “Strong near-infrared emission in the sub-AU disk of the Herbig Ae star HD 163296: evidence of refractory dust?,” A&A 511, A74+ (2010).
- [32] Lachaume, R., “On marginally resolved objects in optical interferometry,” A&A 400, 795–803 (2003).
- [33] Kraus, S., Hofmann, K., Benisty, M., and coll., “The origin of hydrogen line emission for five Herbig Ae/Be stars spatially resolved by VLTI/AMBER spectro-interferometry,” A&A 489, 1157–1173 (2008).
- [34] Eisner, J. A., Graham, J. R., Akeson, R. L., and Najita, J., “Spatially Resolved Spectroscopy of Sub-AU-Sized Regions of T Tauri and Herbig Ae/Be Disks,” ApJ 692, 309–323 (2009).
- [35] Cesaroni, R., “An analytical method for computing optically thick line profiles.,” A&AS 114, 397–+ (1995).
- [36] Kurosawa, R., Harries, T. J., and Symington, N. H., “On the formation of H line emission around classical T Tauri stars,” MNRAS 370, 580–596 (2006).
- [37] Hartmann, L., Hewett, R., and Calvet, N., “Magnetospheric accretion models for T Tauri stars. 1: Balmer line profiles without rotation,” ApJ 426, 669–687 (1994).
- [38] Walker, C. K., Narayanan, G., and Boss, A. P., “Spectroscopic signatures of infall in young protostellar systems,” ApJ 431, 767–782 (1994).
- [39] Whelan, E., Dougados, C., Perrin, M., Bonnefoy, M., Bains, I., Redman, M., Ray, T. P., Bouy, H., Benisty, M., Bouvier, J., Chauvin, G., Garcia, P., Grankvin, K., and Malbet, F., “The 2008 Outburst in the Young Stellar System Z CMa: The First Detection of Twin Jets,” ApJ in press (2010).
- [40] Nisini, B., Milillo, A., Saraceno, P., and Vitali, F., “Mass loss rates from HI infrared lines in Herbig Ae/Be stars.,” A&A 302, 169–+ (1995).
- [41] Malbet, F., Benisty, M., de Wit, W., and coll., “Disk and wind interaction in the young stellar object MWC 297 spatially resolved with AMBER/VLTI,” A&A 464, 43–53 (2007).
- [42] Hartmann, L., Avrett, E. H., Loeser, R., and Calvet, N., “Winds from T Tauri stars. I - Spherically symmetric models,” ApJ 349, 168–189 (1990).
- [43] Takami, M., Bailey, J., and Gledhill, T. M. e. a., “Circumstellar structure of RU Lupi down to au scales,” MNRAS 323, 177–187 (2001).
- [44] Whelan, E. T., Ray, T. P., and Davis, C. J., “Paschen beta emission as a tracer of outflow activity from T-Tauri stars, as compared to optical forbidden emission,” A&A 417, 247–261 (2004).
- [45] Calvet, N., Patino, A., Magris, G. C., and D’Alessio, P., “Irradiation of accretion disks around young objects. I - Near-infrared CO bands,” ApJ 380, 617–630 (1991).
- [46] Carr, J. S., “Near-infrared CO emission in young stellar objects,” ApJ 345, 522–535 (1989).
- [47] Zhu, Z., Hartmann, L., Gammie, C. F., Book, L. G., Simon, J. B., and Engelhard, E., “Long-term Evolution of Protostellar and Protoplanetary Disks. I. Outbursts,” ApJ 713, 1134–1142 (2010).