Giant Faraday rotation in single- and multilayer graphene
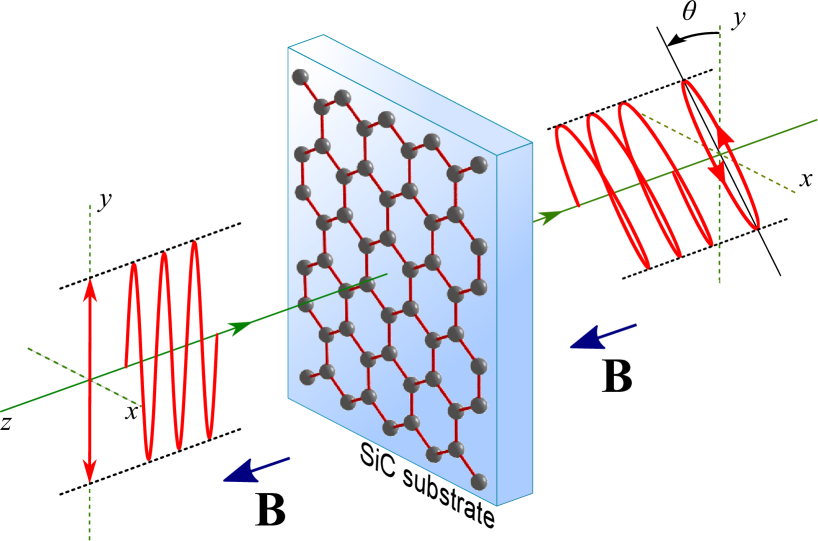
Optical Faraday rotation is one of the most direct and practically important manifestations of magnetically broken time-reversal symmetry. The rotation angle is proportional to the distance traveled by the light, and up to now sizeable effects were observed only in macroscopically thick samples and in two-dimensional electron gases with effective thicknesses of several nanometers. Here we demonstrate that a single atomic layer of carbon - graphene - turns the polarization by several degrees in modest magnetic fields. The rotation is found to be strongly enhanced by resonances originating from the cyclotron effect in the classical regime and the inter-Landau-level transitions in the quantum regime. Combined with the possibility of ambipolar doping, this opens pathways to use graphene in fast tunable ultrathin infrared magneto-optical devices.
Graphene’s unusual physical propertiesGeimNM07 ; CastroNetoRMP09 make it highly attractive for both fundamental research and novel applications. Importantly, the conduction and valence bands in graphene show a relativistic massless dispersion and a chiral character of the electronic wavefunctions, resulting in non-equidistant Landau levels (LLs) ():
| (1) |
in a perpendicular magnetic field , which includes an anomalous LL at zero energy ( is the elementary charge and m/s is the Fermi velocity). As a consequence, graphene shows the half-integer quantum Hall effect GusyninPRL05 ; PeresPRB06 , first observed in exfoliated graphene flakes NovoselovNat05 ; ZhangNat05 and later, in graphene epitaxially grown on SiC ShenAPL09 ; WuAPL09 ; JobstPRB10 .
The optical properties of graphene are equally unusual. The relativistic and gapless dispersion results in a universal and constant optical conductivity of AndoJPSJ02 ; PeresPRB06 ; FalkovskyEPJ07 ; KuzmenkoPRL08 ; NairSc08 ; LiNaturePhys08 ; GusyninNJP09 for the photon energies above twice the Fermi energy (). In magnetic field, the non-equidistant spacing of the LLs gives rise to a spectacular series of absorption peaks, corresponding to transitions between various levels SadowskiPRL06 ; JiangPRL07 ; GusyninJPCM07 ; OrlitaPRL08 . In contrast, only one peak, centered at the cyclotron frequency , where is the cyclotron mass, is observed in conventional 2D electron gases (2DEGs), produced in semiconductor heterostructures.
Up to now, experimental magneto-optical studies of graphene SadowskiPRL06 ; JiangPRL07 ; OrlitaPRL08 were focused on the diagonal conductivity component ; the off-diagonal, or AC HallKaplanPRL96 , conductivity was addressed however only theoretically GusyninJPCM07 ; MorimotoPRL09 ; FialkovskyJPAMT09 . The diagonal and Hall conductivities are directly related to the absorption and Faraday rotation angle (Fig.1) respectively. Adopting the thin-film approximation and keeping only the terms linear in conductivity SadowskiPRL06 ; MorimotoPRL09 the following expressions are obtained:
| (2) | |||||
| (3) |
where is the substrate-normalized transmission (see the Methods section), 377 is the impedance of vacuum and is a spectrally featureless function specific to the substrate (as described in the Methods section). Notably, the diagonal conductivity is formally independent of the sign of the charge carriers, while the DC Hall conductivity, which is sensitive to the carrier type, lacks spectral information. Therefore, studying the Faraday rotation is needed to complete the picture of the dynamics of electrons and holes in graphene.
Graphene, epitaxially grown on silicon carbide, is well adapted for magneto-optical studies because of its well-controlled morphology and essentially unlimited size BergerJPCB04 ; EmtsevNatMater09 . Here, we used single and multi layer graphene (SLG and MLG), grown respectively on the Si-terminated EmtsevNatMater09 and C-terminated BergerJPCB04 surfaces of 6H-SiC. The first sample underwent H-passivation of the Si dangling bonds RiedlPRL09 ; SpeckMSF10 , resulting in quasi-free standing SLG. The MLG consists of 4 - 6 rotated atomic layers (see the Methods section). These samples allowed us to explore the cases of both electron and hole doping as well as to access both the classical (high doping) and quantum (low doping) regimes as described below.
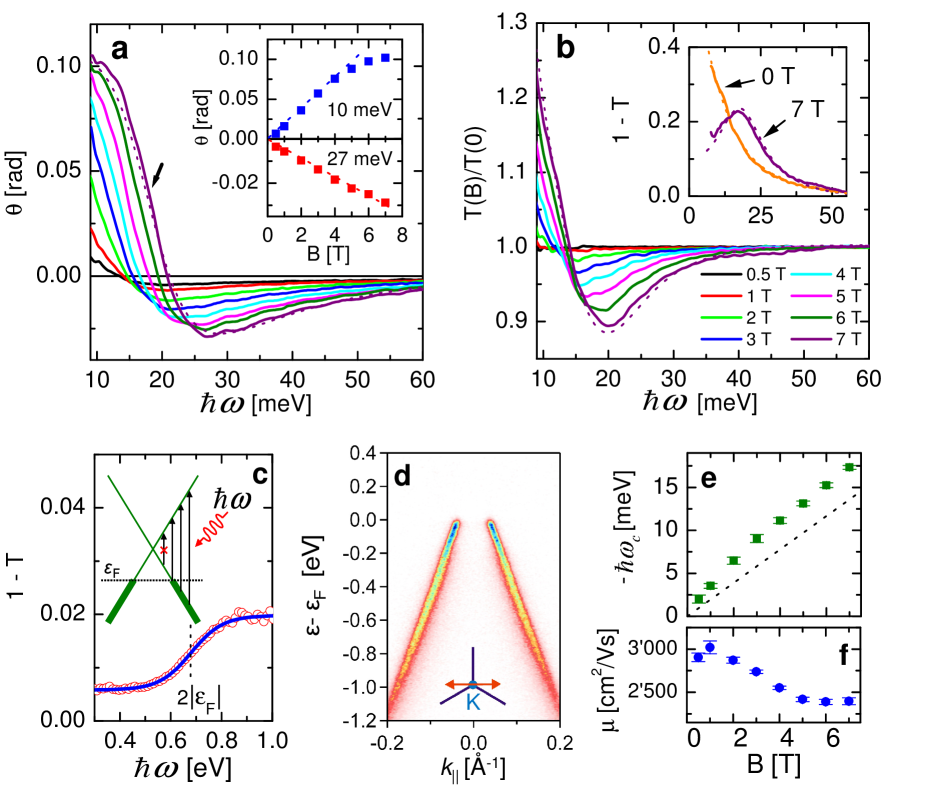
Figure 2a shows the Faraday angle measured on SLG at 5 K in magnetic fields up to 7 T in the far-infrared range as described in the Methods section. The spectra show a strongly field dependent edge-like structure, giving rise to a positive rotation at low energies and negative at high energies. The maximum Faraday rotation exceeds 0.1 radians ( 6 degrees), which is an exceptionally large effect given that it comes from a single layer. Measurements on the bare substrate did not reveal any Faraday effect, hence the observed rotation comes exclusively from the carbon monolayer. The inset shows the field dependence of at 10 and 27 meV. The curves follow an approximately linear dependence, with opposite slopes of +18.5 mrad/T and -4.5 mrad/T respectively.
The zero-field normalized transmission spectra of SLG also reveal a strong magnetic field dependence (Fig. 2b). The inset shows the absorption at 0 and 7 T. One can clearly see a strong Drude peak, signaling a high doping level. The peak center shifts from zero to a finite energy at 7 T, which is due to the cyclotron resonance as we discuss below. Although an estimate of the doping can be made from the integrated intensity of the Drude peak, the most direct measurement of the Fermi energy comes from the absorption spectra in the mid-infrared range (Fig. 2c), where an absorption edge is easily recognized. This is expected to be at 2 due to Pauli blocking AndoJPSJ02 ; PeresPRB06 ; FalkovskyEPJ07 ; LiNaturePhys08 ; GusyninNJP09 , giving an estimate for = 0.34 0.01 eV.
Independently, we have performed angle resolved photoemission spectroscopy (ARPES) on a similar sample (Fig. 2d). The obtained dispersion curves show that the sample is p-doped (the Fermi level is in the valence band). The Fermi energy inferred from optical measurements is in a reasonable agreement with an extrapolation of the occupied bands measured by ARPES. Below we show that the carrier type can also be directly extracted from the Faraday rotation.
The doping level and field strength used here puts the system in the classical regime, where the separation between the LLs at the Fermi energy is much smaller than OrlitaPRL08 ; GusyninNJP09 . In this case, the Dirac quasiparticles are expected to exhibit the classical cyclotron resonance effect. Indeed, the data in Figures 2a and 2b at each separate field are well fitted (dashed lines) using equations (2) and (3) and the classical Drude formulas:
| (4) | |||||
| (5) |
where is the Drude weight, is the cyclotron frequency (which is positive for electrons and negative for holes) and is the scattering time. From here we see that the observed large Faraday rotation is associated with the cyclotron resonance. Furthermore, the curve reveals the value and sign of the cyclotron frequency, since coincides with the position of the maximum absolute slope (shown by the arrow in Figure 2a for 7 T), while the sign of the slope matches the sign of . In our case, the negative slope is an unmistakable signature of hole doping.
In the picture of non-interacting Dirac fermions, the Drude weight (at zero magnetic field) is equal to . Using this relation, we estimate eV from the Drude weight extracted from the fit. This agrees with the estimate based on the mid-infrared absorption threshold but is subject to relatively large error bars.
The cyclotron frequency (Fig.2e) demonstrates an approximately linear growth with field, in agreement with the theoretical relation AndoJPSJ02 ; GusyninNJP09
| (6) |
However, the theoretical curve using the value = -0.34 eV and m/s extracted from the mid-infrared optical spectra and ARPES data respectively (dashed line in Fig.2e) is somewhat lower than the experiment. Although the reason of this deviation is currently unknown, one can speculate about its possible relation to many-body effects. Interestingly an electron-plasmon coupling was recently observed in similar samples BostwickScience10 .
The carrier mobility can also be extracted using the relation (Fig.2f). The mobility varies weakly with field between 2,400-3,000 cm2/(Vs). Even at 7 T, , which means that the cyclotron resonance is significantly damped due to disorder. This can also be seen from the large width ( 10 meV) of the cyclotron peak in the inset of Figure 2b.
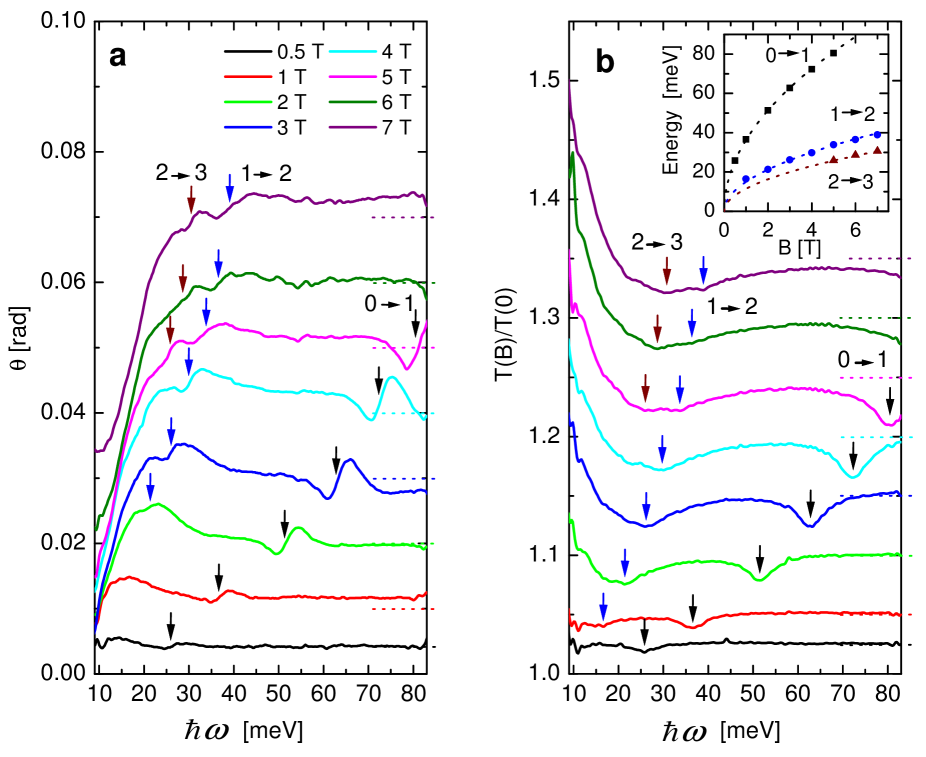
The Faraday rotation and absorption observed in multi layer graphene is strikingly different (Figure 3). Both the Faraday angle and absorption spectra show additional, strongly field dependent resonance structures, marked by arrows. As was found in previous studies SadowskiPRL06 ; JiangPRL07 , they correspond to optical transitions between individual LLs. The series of transitions with energies , and can be identified and fitted using equation (1), which gives m/s (inset of Fig.3b). Although inter-LL absorption peaks have been observed before SadowskiPRL06 ; JiangPRL07 , the measurement of the Faraday rotation at the same conditions is the key novelty of the present work. Now we can distinguish transitions involving electrons from the ones involving holes. In particular, the positive sign of at the transition energies, which coincide with the inflection points, unequivocally determines that the transitions are between electron bands. The low frequency part of the spectra features a cyclotron-resonance like structure, similar to the data on SLG. The sign of the Faraday angle now corresponds to electron doping.
Since only transitions between occupied and empty levels are allowed, the simultaneous presence of 01, 12 and 23 transitions and the low-frequency cyclotron structure in MLG arises from a variation of the Fermi energy across different layers. The layer closest to the substrate is highly doped OhtaPRL07 ; the doping in subsequent layers decreases exponentially with layer number. The most strongly doped innermost layer gives rise to the cyclotron resonance, as in SLG. Meanwhile, the individual inter-LL transitions originate from the weakly doped layers, which are in the quantum regime, as can be seen from the square-root field dependence of the transition energies. The maximum Faraday angle in this sample is smaller than in the monolayer sample, because the innermost layer in MLG is more weakly doped than the latter.
Summarizing the data on both samples, we point out that the Faraday rotation is a powerful contact-free tool to distinguish the carrier type and measure the mobility in graphene. Both in the classical (high doping) and quantum (low doping) limits this technique reveals magneto-optical resonances due to either the cyclotron effect or to inter-LL transitions. The technique has the potential to distinguish electronic contributions from separate graphene layers. However, our most striking observation is the giant value of the rotation ( 0.1 rad for a single atomic layer). This is much larger than the fine-structure constant () - the predicted scale for the Faraday angle, associated with the quantized Hall conductance VolkovJETPL85 ; MorimotoPRL09 ; FialkovskyJPAMT09 ; IkebePRL10 . We demonstrated that this enhancement is due to the proximity to the resonance frequency. Although in 2DEGs the cyclotron resonance gives rise to comparable absolute rotations SuzukiJPSJ03 ; IkebePRL10 , the rotation comes from an effective layer which is about one order of magnitude thicker than graphene. Furthermore, while in 2DEGs the cyclotron frequency is doping independent, in graphene it can be tuned with doping (electrostatic or chemical) as seen from Equation (6), and much higher frequencies can be achieved at the same fields.
The Faraday effect and the associated magneto-optical Kerr effect are widely used in optical communication, data storage and computing. We suggest that the use graphene for fast tunable ultrathin magneto-optical devices should be explored. Indeed, the possibility of easy and fast ambipolar doping together with a strong Faraday effect in a wide frequency range is a unique combination not present in other known materials.
This work was supported by the Swiss National Science Foundation (SNSF) by the grant 200021-120347, through the National Center of Competence in Research “Materials with Novel Electronic Properties-MaNEP”. Work in Erlangen was supported by the German Research Council (DFG) through research grant SE 1087/5-1 and through the Cluster of Excellence ‘Engineering of Advanced Materials’ at the University of Erlangen-Nuremberg. We thank S.G. Sharapov, J. Hancock and J.L.M. van Mechelen for discussions.
I Methods
I.1 Samples
Single and multi layer epitaxial graphene were made by graphitization of the surface of semi-insulating 6H-SiC substrates in an argon atmosphere EmtsevNatMater09 . The sample size was 1010 mm2. SLG was obtained on the Si terminated face of SiC by first preparing a () reconstructed surface (the so-called buffer layer) by annealing in 1 bar of Ar at a temperature of 1450 ∘C, which was subsequently converted into quasi-freestanding graphene by intercalation of hydrogen RiedlPRL09 ; SpeckMSF10 . MLG was grown on the C-terminated face of SiC. In either case, the back side of the substrate was cleaned from undesirably grown graphene using scotch-tape and was checked to be graphene free using X-ray photo emission (XPS). Likewise, the layer thicknesses of the SLG and MLG samples were determined using XPS measurements EmtsevPRB08 .
I.2 Magneto-optical experiment
The sample was mounted in a split-coil superconducting magnet attached to a Fourier-transform spectrometer. A globar light source and He-cooled bolometer detector were used. Two grid-wire gold polarizers (one fixed and one rotating) were mounted before and after the sample. The Faraday rotation was deduced from the angle of the rotating polarizer at which the intensity was at minimum. The substrate-normalized transmission was measured with one polarizer only and is defined as the ratio between the intensity of the light transmitted through the graphene on SiC and through bare substrate.
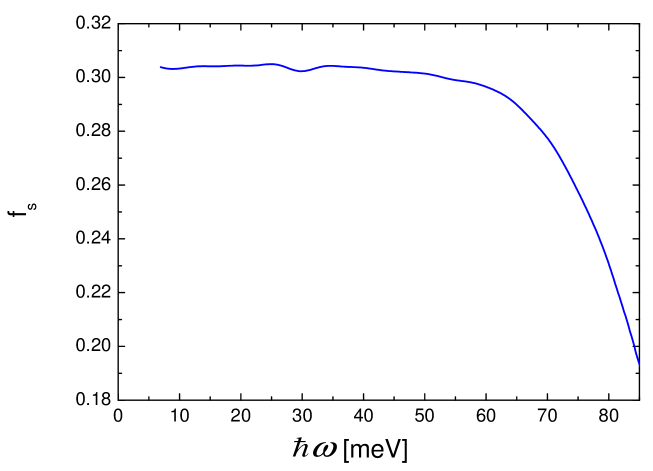
In the thin-film limit, the absorption and the Faraday angle are related to the diagonal and the Hall conductivity respectively by equations (2) and (3), where we made use of a spectrally smooth dimensionless function , which depends on the refractive index and the extinction coefficient and the thickness of the substrate. In our measurements, the Fabry-Perot interference in the substrate was not spectrally resolved. In this case:
| (7) |
where .
Note that for a weakly absorbing substrate and therefore while for a strongly absorbing substrate and . Experimentally, both and can be determined from the measurement of the absolute transmission and reflection spectra of the bare substrate. Figure 4 shows the function of the used SiC substrate ( microns) at 5 K. Below 60 meV, this function is constant; at higher photon energies it decreases because of the presence of a strong optically active phonon in SiC.
References
- (1) Geim, A.K. & Novoselov K.S. The rise of graphene, Nature Mater. 6, 183 (2007).
- (2) Castro Neto, A.H., Guinea, F., Peres, N.M.R., Novoselov K.S., & Geim, A.K. The electronic properties of graphene, Rev. Mod. Phys. 81, 109 (2009).
- (3) Gusynin, V. P. & Sharapov S. G. Uniconventional Integer Quantum Hall Effect in Graphene, Phys. Rev. Lett. 95, 146801 (2005).
- (4) Peres, N. M. R., Guinea, F. & Castro Neto, A. H. Electronic properties of disordered two-dimensional carbon, Phys. Rev. B 73, 125411 (2006).
- (5) Novoselov, K. S. et al., Two–dimensional gas of massless Dirac fermions in graphene, Nature 438, 197-200 (2005).
- (6) Zhang, Y., Tan, Y-W., Stormer, H. L. & Kim, P. Experimental observation of the quantum Hall effect and Berry’s phase in graphene, Nature 438, 201-204 (2005).
- (7) Jobst J. et al. Quantum oscillations and quantum Hall effect in epitaxial graphene Phys. Rev. B 81, 195434 (2010).
- (8) Shen, T. et al. Observation of quantum-Hall effect in gated epitaxial graphene grown on SiC (0001) Appl. Phys. Lett. 95, 172105 (2009).
- (9) Wu, X. et al. Half integer quantum Hall effect in high mobility single layer epitaxial graphene Appl. Phys. Lett. 95, 223108 (2009).
- (10) Ando, T., Zheng, Y. & Suzuura, H., Dynamical Conductivity and Zero-Mode Anomaly in Honeycomb Lattices, J. Phys. Soc. Jpn. 71, 1318 1324 (2002).
- (11) Falkovsky, L.A.& Varlamov, A.A. Space-time dispersion of graphene conductivity, Eur. Phys. J. B 56, 281-284 (2007).
- (12) Kuzmenko, A. B., van Heumen, E., Carbone, F. & van der Marel, D. Universal optical conductance of graphite, Phys. Rev. Lett. 100, 117401 (2008).
- (13) Nair, R.R. et al. Fine structure constant defines visual transparancy of graphene, Science 320, 1308 (2008).
- (14) Li, Z.Q. et al. Dirac charge dynamics in graphene by infrared spectroscopy, Nature Phys. 4, 532 (2008).
- (15) Gusynin, V. P., Sharapov, S. G. & Carbotte, J. P. On the universal AC optical background in graphene, New J. Phys. 11, 095013 (2009).
- (16) Sadowski, M.L., Martinez, G., Potemski, M., Berger, C. & de Heer, W.A. Landau Level Spectroscopy of Ultrathin Graphite Layers, Phys. Rev. Lett. 97, 266405 (2006).
- (17) Jiang, Z. et al. Infrared spectroscopy of Landau levels in graphene, Phys. Rev. Lett. 98, 197403 (2007).
- (18) Gusynin, V. P., Sharapov, S. G. & Carbotte, J. P., Magneto-optical conductivity in Graphene, J. Phys. Condens. Matter 19, 026222 (2007).
- (19) Orlita, M. et al. Approaching the dirac point in high-mobility multilayer epitaxial graphene. Phys. Rev. Lett. 101, 267601 (2008).
- (20) Kaplan, S.G. et al. Normal state ac Hall effects in YBa2Cu3O7 thin films, Phys. Rev. Lett. 76, 696-699 (1996).
- (21) Morimoto, T., Hatsugai, Y. & Aoki, H. Optical Hall Conductivity in Ordinary and Graphene Quantum Hall Systems, Phys. Rev. Lett. 103, 116803 (2009).
- (22) Fialkovsky, I.V. & Vassilevich, D.V., Parity-odd effects and polarization rotation in graphene, J. Phys. A: Math. Theor. 42 442001 (2009).
- (23) Berger, C. et al., Ultrathin epitaxial graphite: 2d electron gas properties and a route toward graphene-based nanoelectronics, J. Phys. Chem. B, 108, 19912 (2004).
- (24) Emtsev, K.V. et al., Towards wafer-size graphene layers by atmospheric pressure graphitization of silicon carbide, Nature Mater. 8, 203 (2009).
- (25) Riedl, C., Coletti C., Iwasaki T., Zakharov, A.A. & Starke, U. Quasi-Free-Standing Epitaxial Graphene on SiC Obtained by Hydrogen Intercalation, Phys. Rev. Lett. 103, 246804 (2009).
- (26) Speck, F. et al. Quasi-freestanding Graphene on SiC(0001), Mat. Sci. Forum, 645-648, 629-632 (2010).
- (27) Bostwick, A. et al. Observation of plasmarons in quasi-free-standing doped graphene, Science, 328, 999 (2010).
- (28) Ohta, T. et al. Interlayer Interaction and Electronic Screening in Multilayer Graphene Investigated with Angle–Resolved Photoemission Spectroscopy, Phys. Rev. Lett. 98, 206802 - 206804 (2007).
- (29) Volkov, V.A. & Mikhailov, S.A., Quantization Of The Faraday-Effect In Systems With A Quantum Hall-Effect, JETP Lett. 41, 476-478 (1985).
- (30) Ikebe, Y. et al., Optical Hall Effect in the Integer Quantum Hall regime Phys. Rev. Lett. 104, 256802 (2010).
- (31) Suzuki, M., Fujii, K., Ohyama, T., Kobori, H. & Kotera, N. Far-Infrared Resonant Faraday Effect in Semiconductors, J. Phys. Soc. Jpn. 72, 3276-3285 (2003).
- (32) Emtsev, K. V., Speck, F., Seyller, Th., Ley, L.& Riley, J. D. Interaction, growth, and ordering of epitaxial graphene on SiC{0001} surfaces: A comparative photoelectron spectroscopy study, Phys. Rev. B 77, 155303 (2008).