FLAMINGOS Near Infra-Red Survey
of The Serpens Cloud Main Core
Abstract
We obtained images and low-resolution spectra in the embedded young cluster in the Serpens cloud Main core (also known as Serpens North). We determined spectral types (SpT) for 15 previously identified cluster members (for 5 of them for the first time), 1 new candidate, and 11 stars that appear to be field interlopers. Extinction, for which we derived an analytical expression, was obtained by taking SpT and near-IR excess into account. The location on the Hertzsprung-Russell diagram indicates that we probed a low-mass population of the cloud (0.05 – 1.5 M☉), including 1 – 3 brown dwarfs. We used our individually determined photospheric parameters to analyze the ISO and the Spitzer determined spectral energy distribution (SED) classes. The latter were correlated with the age and location of the sources in the cloud. We find that most flat objects from our study (4 out of 5) have SEDs consistent with reddened classical T Tau stars; however, when comparing to the thick disk SEDs of lower mass M-type objects, we find that the flat ones show more excess, perhaps indicating an earlier evolutionary stage. We determined a median age for the cluster to be 1 Myr for distance of 380 pc, and 3 Myr for a less likely distance of 260 pc. The core of the cluster is on average younger than the rest of the cluster. We do not find objects with disks past 5 Myr. We do find diskless, X-ray bright objects younger than 1 Myr, as was also noted in the study of Winston et al (2009). We find two groups of young objects associated with dark filaments, indicating that star formation was not always confined to the core.
Subject headings:
infrared: stars — circumstellar matter — open clusters and associations1. Introduction
Embedded young clusters are where the earliest stages of star formation are taking place. As a result of the interplay of gravity, turbulence, external pressure, and magnetic fields, molecular clouds fragment into filaments and cores. Then protostars with envelopes and disks develop, and finally single and multiple stars with planets evolve. Once the gas dissipates, stars leave their birthplaces due to velocity dispersion and mutual interactions (Bate et al., 2003). The outcome can range from a moving group of a dozen young stars to a rich super-cluster of a few thousand members (Lada & Lada, 2003).
When, where, and for how long the cloud fragmentation proceeds is currently not fully understood. Although evidence is accumulating in favor of triggered sequential star formation (e.g., Lee & Chen, 2007), small statistics and the large observational uncertainties of extinction-limited optical surveys can not provide definitive answers to these questions. An age spread of a few tenths of Myr is often observed in a given cluster, while the use of different theoretical isochrones may result in markedly different mean ages (Lada & Lada, 2003; Hillenbrand, 2005; Hillenbrand et al., 2008). These results call for infra-red (IR) surveys, that are also better at studying cool low-mass objects, including brown dwarfs and free floating planets (e.g., Muench et al., 2003; Luhman, 2007; Andersen et al., 2008). In 2003 the Spitzer Space Telescope was launched. Its un-precedented sensitivity and mapping capabilities allowed an extensive study of the circumstellar (and circum-substellar) matter in cluster stars. A large variation of disk properties in a given cluster was found in these surveys (e.g., Cieza et al., 2007). A number of explanations have been proposed, however, none is widely accepted yet: (1) diskless stars are older than the ones with disks (Bertout et al., 2007); (2) diskless stars are more massive since they disperse their disks faster (Carpenter, 2006), e.g. due to photo-evaporation (Hollenbach et al., 1994); (3) low-mass disks can also be evaporated by nearby O stars (Balog et al., 2006); (4) in some systems giant planets may form early on and sweep up the disk (Quillen et al., 2004); (5) disks are truncated by close companions (Bowman et al., 2006), or (6) during the close passage of another star (Olczak et al., 2006). Young clusters provide ideal places to test these hypotheses.
The first step toward deciphering the star formation history in the cloud is to identify its population. At the typical distances of a few hundred parsecs, members are most efficiently identified through the mid-IR excess from circumstellar material. Spitzer investigated a number of molecular clouds and uncovered many new clusters as well as distributed populations of young stellar objects (YSOs) (Allen et al., 2007). The IR excess method, however, misses YSOs that have already dispersed their circumstellar material. To obtain a total count of the cloud population, complementary less reliable methods are being used, such as association with nebulosities, X-rays, and variability surveys that detect YSOs by the elevated magnetic activity.
Once cloud members are identified, the next step is to characterize the age and the evolutionary state of each one. This requires the determination of photospheric luminosity and temperature for comparison with evolutionary tracks. Obscuration by dust makes traditional optical techniques (like multi-color photometry or spectroscopy) inefficient. The mid-IR region, on the other hand, is not sensitive to the photospheric temperature, falling on the Rayleigh-Jeans tail of the stellar flux. Near-IR (NIR) photometry would be optimal, however, it is not sufficient by itself. The leverage in wavelength space is too small for the accurate determination of the effective temperature and reddening. For example, late-type YSOs can be mistaken with reddened early-type YSOs and with background evolved stars. The latter is inevitable since molecular clouds are usually confined to the Galactic plane (Dame et al., 2001). These obstacles can be overcome by obtaining NIR spectra. We designed our Molecular Cloud Survey to gather both deep NIR images of dark clouds and NIR spectra of cloud sources, using the multi-object capabilities of the FLAMINGOS instrument (Florida Multi-Object Imaging Near-Infrared Grism Observational Spectrometer, Elston et al. (2003)). The Serpens cloud is one of the targets of this survey.
The cluster of protostars at the heart of the dark cloud in Serpens Cauda has been known since the mid 70’s. It was extensively studied since then at all wavelengths, and new concentrations of YSOs were traced in the southern direction. Young objects in all evolutionary stages were found throughout the cloud, indicating a prolonged star formation history. Despite the large body of research, a Hertzsprung-Russell (HR) diagram with a representative number of sources did not exist until recently (Wilking et al., 2008; Winston et al., 2009). Earlier, Doppmann et al. (2005) attempted to derive ages for nine Class I and flat-spectrum Serpens protostars using an alternative form of the HR diagram, that employs spectroscopically-determined surface gravity in place of luminosity. They obtained an age spread 3 Myr, too large on statistical and physical grounds for a protostellar stage that is expected to last 0.1 Myr. Giovannetti et al. (1998) and Kaas et al. (2004) modeled the K-band luminosity function around the Main core and concluded that protostars represent a recent “micro-burst”, while a more evolved distributed bulk population originated 2–3 Myr ago, perhaps in a similar burst.
It is difficult to correct luminosity functions for the background population in this region because of the highly non-uniform extinction and proximity to the galactic plane (). Recently an alternative spectroscopic approach has been attempted (Wilking et al., 2008; Oliveira et al., 2009; Winston et al., 2009). Our study follows this approach with the first NIR multi-object spectrograph. Our primary goal is to carry out spectral classification for the accurate age determination. We also want to understand the age spread, by considering the spatial location and the evolutionary status of individual objects, based on the Chandra and Spitzer SED classification. Spectroscopy also allows to identify interesting emission-line objects and brown dwarf members (of which only one has been closely scrutinized by Lodieu et al. (2002)).
2. The Serpens Cloud
A chain of dark clouds in Serpens Cauda is part of the Aquila Rift, a larger complex of molecular clouds that branches off the Milky Way plane in Cygnus, runs through northern parts of Aquila and Serpens Cauda, and disappears in Ophiuchus. One of the prominent sources in the cloud is an optically visible Herbig Ae/Be star VV Ser ( for 400pc, Hillenbrand et al. (1992)), surrounded by a mid-IR nebula (Pontoppidan et al., 2007a, b). The region covered in our study lies inside a dark filamentary cloud 1 north of VV Ser and is called the Main Serpens Core (Figure 1). It was first noticed due to the red reflection nebula, the Serpens Reflection Nebula (SRN). Strom et al. (1974, 1976) conducted a NIR survey of the cloud and identified the first embedded population (now referred to as “cluster A”), including SVS20, a bright IR source with a ring-like nebulosity, and SVS2, an illuminating source of the SRN (Worden & Grasdalen, 1974). An NH3 map revealed an elongated cloud of dense gas that stretches 10 south and bends 4 north-west from the SRN (Little et al., 1980), following contours of high extinction (Cambrésy, 1999; Harvey et al., 2006). Sub-mm and mm surveys of the dust continuum emission revealed a double core with clumps, most of which (but not all) harbor mid-IR sources (Casali et al., 1993; Davis et al., 1999; Kaas et al., 2004; Enoch et al., 2007, 2008). Unlike the southern sub-core, the north-western one is devoid of bright NIR sources, but teems with outflows powered by deeply embedded class 0 and I protostars (Bally & Lada, 1983; Davis et al., 1999; White et al., 1995; Ziener & Eislöffel, 1999).
Following the initial NIR studies of the region (Strom et al., 1976; Cohen & Kuhi, 1979; Churchwell & Koornneef, 1986), Eiroa & Casali (1992) assembled the first representative list of 50 potential cloud members. Membership criteria included association with a nebulosity or mini-cluster, NIR excess, emission lines, and the 3 m ice absorption feature. They estimated a reddening of . More members were identified in the subsequent NIR surveys of Sogawa et al. (1997), Giovannetti et al. (1998), and Kaas (1999). In the latter study 39 members without NIR excess were added based on their –band variability. The low IR luminosity of the region implies that it is devoid of O/B stars. The nearest massive stars are three late type B stars that illuminate reflection nebulosities at the north-east rim of the cloud (HD 170784, HD 170739, & HD 170634, see Figure 1 in Zhang et al. (1988a)). Being detached from the main concentrations of protostars, they are likely field stars passing through the cloud. They have been used for the estimation of the distance to the cloud (§5.2).
The Serpens cloud was surveyed with all three major IR space observatories: IRAS (Zhang et al., 1988a, b), ISO (Kaas et al., 2004; Djupvik et al., 2006), and Spitzer. Two Spitzer teams independently studied the central region: the Legacy Cores to Disks (c2d) group (Harvey et al., 2006, 2007a, 2007b), and the IRAC and MIPS instrument team (Winston et al., 2007). The c2d group in addition extended coverage south, following the contours of Cambrésy (1999). The Spitzer studies provided the most comprehensive census of the YSO population in the cloud. Sources were assigned a spectral energy distribution (SED) class and their spatial distribution was examined. Protostars (class 0 & I sources) showed a strong clustering around two main dusty ridges – the Main core with its cluster A, and another filament 42 south with a new cluster dubbed “cluster B” (Harvey et al., 2006; Enoch et al., 2007). The latter is also known under the Ser/G3-G6 name (Djupvik et al., 2006), after 4 classical T Tau stars (CTTS) found by Cohen & Kuhi (1979). Soon after, Gutermuth et al. (2008) discovered yet another pocket of protostars, “Serpens South”, located south of the Main core. On the other hand, class II and III sources were found to be nearly uniformly distributed throughout the cloud as defined by contours. The resolution of the extinction maps used in these Spitzer studies and of the mm images, however, was not sufficient to explore association with dusty filaments in detail. Our deep NIR FLAMINGOS image of the region (Figure 2) makes this investigation possible (§7.2).
Due to the high sensitivity of Spitzer and the negligible extinction in the mid-IR, the cloud population constitutes only a miniscule fraction of all the sources in the field of view (FOV). The vast majority are extragalactic objects (such as star-forming galaxies and active galactic nuclei) and field stars. Extragalactic point sources are eliminated based on the faintness at 2–6 m and the large excess at 5.8 and 8 m due PAHs, combined with the absence of excess at shorter wavelengths. Harvey et al. (2007b) undertook a more conservative selection of YSOs against AGB stars and galaxies than Winston et al. (2007), by selecting brighter sources and with a more robust 2MASS/IRAC excess. This approach helps to remove spurious detections in the case of close companions or nebulosity, as shown by cyan squares in Figure 2, however, it can miss sources where the excess starts beyond 5 m, such as W68, W109, and W181.
Magnitude cuts of the IR surveys limit the ability to detect very low-mass YSOs, class III are indistinguishable from field stars, and weak/transition disks are missed due to loss of sensitivity in the Spitzer IRAC 6 & 8 m channels. In the latter two cases X-ray observations are used to discriminate between X-ray quiet slowly rotating field giants / Main Sequence stars and X-ray active YSOs. Preibisch (2004) observed 30 diameter Serpens area with XMM-Newton for a total exposure time of 52 ks, while Giardino et al. (2007) surveyed smaller area (17 diameter) with Chandra in a deeper exposure of 90 ks. The latter data was independently analyzed by Winston et al. (2007), who found a 95% agreement between their and Giardino’s et al. yields. There are several limitations to these X-ray surveys. One is the smaller FOV that only covers the Main Core area. Next is the lower yield of detections for embedded objects. For example Preibisch et al. (2005) report 97% detection rate for the optically-visible T Tauri members of the Orion Nebula cluster, while Winston et al. (2007) only 50% for classes 0/I-II in Serpens, and no confirmed detections of class 0 is reported anywhere (either due to high extinction, a flaring pattern of their X-rays, or because X-rays are simply not emitted). Sensitivity also limits the detection of the low-mass YSOs. Winston et al. (2007) find that the X-ray detection rate in Serpens drops quickly below 0.2 M☉ for an age 3 Myr and extinction 5. The X-ray detected YSO sample can be still contaminated by the foreground active binaries and M dwarfs. Finally, Figure 2 shows that there are many X-ray sources whose nature can not be reliably identified by means of the IR photometry. Spectroscopy may help clarify whether they are faint members or contaminants.
Oliveira et al. (2009) followed with the optical spectroscopy on the IR excess objects (from the c2d survey) in the cluster B and the VV Ser region. Out of 78 stars they identified 58 as cloud members and 20 as background giants, which represents the less embedded half of their original sample. They obtained a somewhat old median age of 4.7 – 7.5 Myr (depending on the models), and a substantial age spread of 15 Myr. Considering their large errorbars, however, the latter result should be taken with caution. Winston et al. (2009) classified 65 YSOs in the Main core area, using optical and NIR spectroscopy. Their sample included both excess and non-excess members drawn from the Spitzer and Chandra surveys, as well as a four new members identified by the presence of the Li I line. Seven objects were identified as probable contaminating giants. Winston et al. (2009) found a younger mean age 3 Myr for this upper region, but also detected a tail of an apparently old population stretching to 20 Myr. Younger objects were demonstrated to have a stronger clustering and higher extinction than the older ones. This and the detected decline of the SED slopes with age provided confidence in the isochronal ages, despite large uncertainties anticipated with the placement of YSOs on the HR diagram. These studies left open the question of whether the older population was formed inside the current pockets of the active star-formation and drifted out, or whether there were different sites of star-formation in the past. Winston et al. (2009) in addition found a surprisingly high disk fraction among the old cluster population.
In attempt to clarify these issues, we carry an independent study of the Main core with FLAMINGOS. In addition to obtaining new spectra and photometry, we use spectral information in the de-reddening procedure and in evaluation of the SEDs, critically assess the distance to the cluster, collate information on the individual sources from the literature, and use our deeper FLAMINGOS images to further examine the spatial distribution of the cloud population.
3. Observations and Data Reduction
3.1. Serpens Photometry
Our Serpens observations were carried on two telescopes at the Kitt Peak National Observatory, imaging on the 2.1 m telescope and spectroscopy on the 4 m one. We imaged the Serpens molecular cloud in bands with FLAMINGOS instrument in October 2003. Seventeen fields were tiled in the NE–SW direction to trace dense material between , , based on the CO and the 25 m IRAS maps. In this work we only discuss photometry for our spectroscopic targets which are situated in the Main core and were covered by a single field (Figure 2). The field was imaged on October 20 (in the filters) and on October 22 (in the ). In the and filters 9 dithered exposures were taken 35 sec each, in 25 exposures 15 sec each, for a total time of 5 – 6 min per filter. The plate scale was 0.6 pixel-1, the seeing varied between 1.4 – 1.7, the airmass between 1.2 and 2.
The reduction was performed the same way as for the other regions from our FLAMINGOS Molecular Cloud Survey (Muench et al., 2003; Levine et al., 2006; Román-Zúñiga et al., 2008). The raw images were reduced using IRAF-based pipeline developed by C. Román-Zúñiga (2006). The PSF-photometry, astrometry, and the source match between three filters were performed with a pipeline written by Levine (2006). Finally, the zero-point of photometry in each filter was corrected for geometrical distortion using an IDL-based routine by A. Stolte. The image quality degrades away from the optical center, which for this field is near , . For each filter we plotted the difference between our and 2MASS photometry as a function of distance to the optical center, and corrected the trend with a 6th-order polynomial fit (for more details see Román-Zúñiga et al. (2008)). Note that this procedure does not affect colors that are defined by the filter system. The diagram indicates that FLAMINGOS system is closer to the CIT than to the 2MASS system.
The detection limits of our Serpens observations, defined as the drop-off in the magnitude distribution function, are around 18, 18, & 17 mag at , & , respectively, which is 2 mag deeper than 2MASS observations. For spectroscopic sources FLAMINGOS errorbars are 2 – 5 times smaller than 2MASS, particularly for the J band. As a result, the presence of the NIR excess is now better constrained on the diagram for faint sources, while spectroscopically identified K–M background giants form a tighter sequence. FLAMINGOS photometry for our spectroscopic sample is reported in Tables 1 and 2.
3.2. Serpens Spectroscopy
3.2.1 Target Selection
We selected our spectroscopic targets based on FLAMINGOS photometry of the Main core region. Objects with according to the evolutionary models of Siess et al. (2000) and Baraffe et al. (1998) should have spectral types (SpT) of late-K – M for the estimated cluster age 2 Myr. From our experience of observing embedded clusters at similar distances (300 – 400 pc) in Orion and Perseus (Luhman et al., 2005; Levine et al., 2006), we should have been able to classify M stars based on the depth of water bands at 1.4 and 1.8 m with a signal to noise ratio S/N20 for a typical integration time of 1 hour. We designed 4 masks with 30–40 slits each to cover the FOV of FLAMINGOS on the 4 m telescope, centered approximately half way through the dusty filament emanating south of the SRN (see Figure 2). The zoom-in on the area around the SRN is shown in Figure 3. Only 4 – 6 objects per mask had a NIR excess according to the diagram, the remainder were picked uniformly across the field according to the above mentioned magnitude cut. However, due to the strong reddening in the region, our spectra of objects with turned out to be too noisy for a meaningful classification. Similarly, the first 2–3 spectra from the top and bottom (north and south) of the array had to be discarded due to the poor signal in the flat fields. In total, we obtained 30 good spectra, 27 of which revealed spectral features strong enough for spectral classification. These objects are marked in Figure 2 and discussed throughout the paper.
We further split our spectroscopic sample into two groups: candidate YSOs and field stars. YSOs are listed in Table 1 together with their identification numbers and the SED classes from the literature, while field candidates are listed in Table 2. Also given are the FLAMINGOS photometry and the c2d catalog numbers, used for the construction of SEDs (§6). Throughout the paper we adopt for YSOs mainly the naming scheme after Eiroa & Casali (1992) (EC), or after whichever study identified a particular source as a YSO first, to be consistent with the map of the cluster in Figure 2 of Kaas (1999). For the remaining stars (field candidates and source 19) we use our own numbering sequence. The YSO group includes objects that either have NIR or mid-IR excess (SED classes 0 – II), non-excess objects (SED class III) that have been detected in the X-rays, and source 19. The field group consists of non-excess objects not known to be X-ray emitters, and that either have been suspected to be background giants from our spectroscopy, or appear under-luminous/old on the HR diagram (a possible foreground M dwarf with a small star 28, A-type stars 29 and 30, and a K-type star 27).
The SED class is usually assigned based on the slope of the dereddened energy distribution between 2 – 4 m and 7 – 14 m. The borderline values of between class 0/I, flat (Fl), II (usually corresponds to classical T Tau stars), and III are typically adopted as 0.3, 0.3, 1.6 respectively. A finer subdivision is sometimes used, like transition disks (TD), where excess only starts at wavelengths 8 m. The general interpretation of the SED class is that in class 0 objects the observed energy is originating entirely from the optically-thick cold envelope, in class I objects a central source becomes visible through a cavity in the thinned envelope, in class II objects disk radiation dominates over the envelope, and class III objects have largely dissipated the primordial circumstellar material. Since SED classification is not strictly defined, as it relies on dereddening and sometimes on viewing geometry (like disk inclination, cavity orientation, etc.), the object may be assigned to two neighboring classes. We report SED classes in Tables 1 and 2 as determined in the three main space-based mid-IR studies of Kaas et al. (2004), Harvey et al. (2006), and Winston et al. (2007). SED classes are shown in all of our figures to search for supporting evidence of the described evolutionary interpretation.
3.2.2 Multi-Object Spectroscopy
Spectra of the Serpens sources were obtained on the Kitt Peak 4m telescope with FLAMINGOS with four masks on four nights of 2004 October 4–7. Masks were designed based on the FLAMINGOS band image obtained on the 2.1 m telescope and scaled to the 4 m telescope FOV. The masks were in size, oriented north-south, and were arranged along the right ascension near to cover the area centered on the opaque filament south of the SRN (Figure 2). Each mask contained 30 – 40 slits, 0.95 (3 pix) wide, 10–20 long for the science targets, and 3 – 4 boxes for the bright alignment stars. The mask design was optimized to produce as many non-overlapping spectra as possible, one object per slit, and to allow a 4 nod along the slit for the sky subtraction. The grism coupled with the filter provided complete wavelength coverage at 0.9 – 1.8 m with a dispersion 4.7 Å/pix, which resulted in spectral resolution of 950 in the band and 1250 in the band. Despite the diminished reddening in the band, the grism was not used for two reasons: a strong, non-uniform background radiation from the instrument and the expected veiling in the band for sources with NIR excess. The latter effect occurs when the continuum radiation from the circumstellar dust () adds to the photospheric flux, diluting weak spectral features, making it problematic to measure line strengths in the low-resolution spectra.
Cluster observations consisted of three ABBA sequences, where A and B correspond to the two positions of the star on the slit separated by 4, achieved by nodding the telescope in the north-south direction. Subtraction of the upper and lower exposures removes telluric emission lines and the background radiation (from sky and the instrument). A single exposure was 5 min long. Due to occasional problems with read-out, some AB pairs had to be discarded, resulting in a total exposure time of 40 – 60 min per mask. Observations of the cluster field were followed by a few flat field quartz lamp exposures through the mask, with the lamp on and off (the latter is for the background subtraction). An early G dwarf of was then observed as a telluric standard (HD 9562, HD198802, and HD 187923 for masks m1, m2 – m3, and m4, respectively) at an airmass within 0.2 of the cluster observation (except for m1, where the cluster was at 0.5 larger airmass). Standard spectra were obtained in seven 5 – 10 s exposures along a 3 pix-wide long slit, followed by the flat-field exposures. In some cases HeNeAr arc spectra were taken to complement the wavelength calibration of the standard from the OH telluric emission lines. At the end of each night a series of dark frames were observed with the corresponding integration times.
We reduced the spectra using Shrimpeater, our iraf-based pipeline. Individual mask frames were dark-subtracted, flat-fielded, and shifted for AB pair subtraction. Two combined images were produced, the first of the slit spectra with sky lines subtracted (in mask m3 some negative residuals can still be seen in faint spectra), and the second of the subtracted OH lines. The spectrum of each source (excluding alignment stars) was interactively traced and extracted, the trace was applied to the sky spectrum from the same slit, OH lines were identified, and the wavelength solution was applied to the source spectrum. The standard spectrum was reduced in a similar manner (with the exception that the arc spectrum was used in place of sky for wavelength calibration of a mask m3 standard). Telluric absorption lines in the standard spectrum were matched against those in the target spectra and a small shift (4–10 Å) was applied to the standard spectrum to adjust the wavelength calibration. Target spectra were divided by the aligned standard spectrum to remove telluric absorption (mostly water vapor), visually examined to interpolate over noisy spikes, and multiplied by the solar spectrum to restore the continuum shape. Multiplication by the solar spectrum is also done to compensate for weak intrinsic absorption lines in the standard. To improve the S/N we further applied box-car smoothing with the iraf task splot and obtained the final resolution . Spectra of good S/N retained for the analysis are shown in Figures 4 and 5.
3.2.3 Spectroscopic Standards
For spectral classification of the program stars we also observed with FLAMINGOS at Kitt peak 2.1 and 4m telescopes a number of stars with known spectral types outside of the Serpens cloud. These spectral standards are shown in Figures 6 and 7. They were observed and reduced in a similar manner as the Serpens targets.
IC348 standards. IC 348 is a 2 – 3 Myr cluster in the Perseus molecular cloud (320 pc). Being less embedded, but otherwise similar to the Serpens cluster, it was extensively studied in the optical and IR and served as a benchmark for the investigation of properties of young low-mass objects (e.g., Muench et al., 2007). We obtained FLAMINGOS spectra for a number of IC 348 stars for which SpTs were determined from the optical spectra, mostly by Luhman (1999) and Luhman et al. (2003). We use the numbering and SpTs as adopted in Table 2 of Luhman et al. (2003). F – K stars and three early M stars (IC 348-65, 116, 92) were observed in October 2004 in two masks. The remaining M standards were observed in January and December 2003 in four masks and have already been used for classification of other stars in IC 348 (Luhman et al., 2005) and in NGC 2024 (Levine et al., 2006).
Field standards & KPNO-Tau4. To test the possibility that some of the Serpens stars are unrelated interlopers, we also obtained spectra of field stars with SpTs available in the VizieR database111http://webviz.u-strasbg.fr/viz-bin/VizieR. These stars and a late-type young object KPNO-Tau4 were observed through a long slit. The A – K standards are bright field stars that were observed in January 2003 and October 2004 to serve as telluric standards for other targets. Field M standards and KPNO-Tau4 were observed in October and December 2004 and presented in Levine et al. (2006) and Levine (2006).
Finally, for classification of the early-type stars, we complemented FLAMINGOS standard star observations with the band spectra of field stars from Meyer et al. (1998). The latter spectra were obtained with the Fourier transform spectrometer (FTS) at the 4m Kitt Peak telescope and are available through the NOAO archive222ftp://ftp.noao.edu/catalogs/medresIR/. We convolved them from the original spectral resolution of 2900 to the FLAMINGOS resolution 500.
4. Spectral Classification
We split our spectra into two groups: those that show a steep break at 1.34 m and a knee at 1.68 m due to water bands (13 sources), and those that do not (13 sources). The former are candidates to be dwarf M stars and the latter to be earlier types and giants. Because of the strong reddening, the band is too noisy to reliably measure spectral features, except for the 1.34 m break. Therefore, we classify the first group based mainly on the depth of the water bands between the and bands (Figure 6), while the second group based on the strength of a few lines in the continuum-flattened band spectra (Figure 7). Another 4 sources (EC117, EC129, 28, and H232) are shown on both figures being borderline cases. We assign a range of spectral types to each source based on the visual comparison with the spectral standards. These SpTs are reported in our tables and in Figures 6 and 7.
4.1. Classification of Candidate M dwarfs
Greene & Lada (1996) presented the first comprehensive library of NIR spectra of YSOs in clusters. Most of them must be late K–M stars according to the initial mass function. This exploratory study revealed the challenges of identification and characterization of YSOs. On the two-index diagram designating equivalent widths (EW) of Na I Ca I and CO lines in the -band spectra, they found most Oph and R CrA YSOs situated in between the loci of field dwarfs and giants, unlike in Taurus, where all YSOs except FU Ori stars lay on the dwarf locus. No clear dependence on the SED class was established. Further studies explored the role of veiling, disk atmosphere, and age-related surface gravity (g) effects on the formation of the YSO spectra. The conclusion was reached that veiling and g are the most important factors, and therefore for classification of YSOs other YSOs should be used as templates, rather than field dwarfs. Given that dust sublimation temperature is 1500 K, veiling should have a smaller effect in our spectra than in the band often chosen by observers due to lower extinction. Due to low gravity in YSOs, matching to the field dwarf templates can result in systematic errors in . To create the first low-gravity templates, Luhman et al. (2003) constructed hybrid spectra by combining observed spectra of a giant and a dwarf star of the same SpT. They then classified a number of IC 348 members based on these hybrid spectra to produce YSO templates. We use the latter to classify our Serpens sources. We also adopt the “intermediate” SpT- scale of Luhman et al. (2003) for constructing the HR diagram (§5.3), since the scale was constructed specifically for a few Myr-old YSOs.
M stars with subsolar luminosities found in clusters with ages Myr should be low-mass objects () contracting towards the Main Sequence (MS) at nearly constant temperatures. Large radii make their surface gravity smaller than in old field dwarfs of the same effective temperature (g3–4.5 vs. 4.5–5), but not as small as in evolved red giants/supergiants (g0–3, e.g. Figure 6 in Ivanov et al. (2004)). While broad-band intrinsic colors of YSOs are dwarf-like within the measurement errors, due to the gravity difference their spectra past M5 are clearly distinct from field dwarfs. The band of field dwarfs is dominated by the strong absorption lines of FeH and K I. In low-gravity objects these lines weaken and are replaced by the shallower bands of VO and TiO (Gorlova et al., 2003; McGovern et al., 2004; Luhman et al., 2007). The difference is also seen in the shape of the band, which is triangular in YSOs and more flat-topped in field stars (Lucas et al., 2001; Allers et al., 2007). Indeed, these differences are observed between the IC 348 spectra and the field dwarfs in Figure 6. Although in most Serpens sources we cannot confidently detect lines in the band due to noise, it appears that the band flux in all our late M candidates rises from 1.50 to 1.68 m, better matching the triangular shape of IC 348 sources than the plateau of the field dwarfs. We therefore regard all Serpens targets with a strong water break to be young cluster members. For early M stars it is more difficult to claim membership based on our spectra alone. Evolved stars (such as AGB, post-AGB, and red supergiants) have extended molecular envelopes, often variable and chemically peculiar, which results in a large diversity of their spectral shapes, some of which resemble YSOs (e.g. Lancon & Wood (2000)). Being in addition luminous and numerous in the Galactic plane, they can be confused with a YSO in the low-resolution spectroscopic studies like ours. We rely on the X-ray detection to exclude this possibility for our YSO candidates, except for the faintest and the most embedded ones.
We derived SpTs for Serpens sources by matching the depth of the 1.34 m break and the shape of the band to the IC 348 sources. To eliminate difference caused by different reddening, all spectra have been preliminary de-reddened using iraf task deredden, with a nominal value of that was selected individually for each spectrum so that the slope of the line connecting fluxes at 1.32 and 1.68 m was 1.2 in all sources. In the early M stars the Mg I line at 1.50 m and the MgI/SiI doublet at 1.58 m were additionally considered. These lines weaken with later SpT until they disappear around M5. We assign SpT M1 – M8.5 to 17 Serpens objects (excluding giant candidates, §4.2), of which one star, 28, is likely a foreground dwarf due to low reddening and the low position on the HR diagram (§5).
The errorbars that we report for our SpTs reflect the goodness of the fit to the spectral standards. Residual telluric features and veiling in the excess sources can induce additional, systematic errors, that are also more difficult to assess in the individual cases. Based on our experience of observing similar object multiple times, for a reasonable difference within 0.5 airmasses between the targets and an F-G telluric standard, the effect of the telluric residuals in the water bands (within the wavelength intervals shown on Fig. 6) should be no more than 1.5 subtypes. Veiling can have a more significant effect on classification of excess sources, in particular those with low S/N where we can not see atomic lines (EC89, EC74, EC114, STGM1, H230, and [K99]40). Our tests with veiling standard spectra showed that these YSOs can be actually 2 subtypes later if they are veiled by . Later types would make them even younger than already observed. Accounting for the effect of veiling on the stellar luminosity will work in the opposite direction, by making them fainter and older, but this effect is much smaller than from SpT, as discussed in §5.3.
There are 9 common sources with SpTs between us and a higher-resolution study of Winston et al. (2009). The latter study used two methods for classification – visual comparison of broad features with standard spectra and the ratio of the atomic line depths (that helps eliminate the effect of veiling). As shown in the Appendix, types agree between us and Winston et al. (2009) (within the stated errorbars) for 5 sources: EC117(W216), W201, EC77(W204), [K99]40(W54), W68; and disagree (by 2-3 subtypes) for 4: K407(W166), H232(W40), EC84(W85), EC86(W190). There is no systematic pattern in the difference though, from which we conclude that veiling is not significant at least for these class II-III sources.
4.2. Classification of Stars Without a Water Break
Three objects, all of SED class 0/I, lack sufficiently strong absorption lines to allow a reliable classification: SVS2, SVS20A, and EC 103. These stars have steeply rising SEDs through the band without a sign of overturn, which means either SpT M1 or . The band spectrum of EC103 exhibits hydrogen Bracket lines in emission. The spectra of SVS2 and SVS20A reveal extremely weak features that can be matched with atomic lines in F – K dwarfs. We did not attempt to examine these lines in detail because at this level they may be affected by slight differences between the telluric standard spectrum, the G0 – G5 star HD 198802, and the solar spectrum. The weakness of the lines indicates a large degree of veiling, as is also suggested by the location on the diagram red-ward of the CTTS locus of Meyer et al. (1997). We did not attempt to classify these stars, but discuss them in the Appendix based on the information available in the literature.
Stars 29 and 30 are the only clear cases of hot stars in our sample having strong hydrogen lines in absorption. Based on the strength of these lines and the absence of the He I line at 1.70 m, we estimate their SpTs to be between B5 and F2 (Meyer et al., 1998). The fact that the lines are broad indicates luminosity class V. The location in the diagram indicates 6–8 mag for 29 and 8–10 mag for 30. No excess emission is observed in the 24 m and 8 m Spitzer detections of these stars, respectively. They lie in the southern part of our spectroscopic field, which is outside the area surveyed by X-ray telescopes. Assuming SpTs B5, A0, and F2 for each of the stars and placing them on the HR diagram as explained in §5, we observe that they lie dex lower than the zero-age Main Sequence (ZAMS) of Siess et al. (2000). We therefore regard these stars to be field stars behind the cloud.
The remaining stars without prominent hydrogen lines and water breaks are shown in the first column of Figure 7. Other columns on that figure represent -band spectra of reference stars: (1) FLAMINGOS spectra of YSOs in IC 348, (2) FLAMINGOS spectra of field dwarfs and subgiants, (3) FTS spectra of dwarfs and subgiants, and (4) FTS spectra of low-gravity giants and supergiants. Examination of standards shows that independent of the luminosity class, SpT F is characterized by the presence of discernable hydrogen Bracket series, that disappears by mid-G. G type is characterized overall by a weak metal line spectrum, which makes a classification difficult at low S/N. Mg I 1.50, 1.58, and Si I 1.59 m lines dominate K type spectra, reaching peak strength near K3. In dwarfs these lines disappear by mid-M, in giants they are replaced by the CO second overtone band and other molecules.
While it is easy to identify background M giants from M dwarfs by their strong absorption spectra, in G – K types it is more problematic due to a number of reasons: in late-K types dwarf and giant temperature scales coincide, in mid-G types converge (at a solar value of 4.5 dex), and on the diagram the loci of G – K dwarfs and giants are inseparable. This is a manifestation of the fact that most G – K giants are lower mass or less evolved stars compared to M giants, therefore their physical and spectral properties are more similar to dwarfs. Another complication arises from the fact that giants are observed over larger distances sampling a wider range of metallicity, and metal-poor giants have markedly weaker absorption spectra. Nevertheless, Figure 7 and examples in Ivanov et al. (2004) indicate that G – K dwarfs can be recognized by the Mg I + Si I pair at 1.58 m with both lines of approximately equal strength (except that the Mg I doublet becomes broader in early Ms), while in G – K giants Si I and the CO lines are more prominent. The strength of the Mg I + Si I pair in IC 348 sources resembles more that in dwarfs than giants. A careful examination, however, reveals a prominent feature at 1.62 m that we tentatively interpret as a CO line, a signature of a reduced gravity in the YSOs.
We now consider the Serpens spectra. Objects 24 and 25 (marked “g”) have a clear match with late K – early M giant/supergiant spectra. X-ray non-detection and the excess-free SEDs facilitate background giant interpretation for these stars. We found two cases in the literature when giants were confused with YSOs in Serpens based on the high extinction and the geometrical association with the cloud – CK2 (W158) in Figure 3, and the neighboring object to the protostar ESO Hα279 in the north-western sub-core. The giant nature was uncovered through the observation of the strong CO absorption in the band spectra of these two stars (Aspin et al., 1994; Chiar et al., 1994; Casali & Eiroa, 1996). Objects 20, 21, and 22 also have strong features at 1.62 and 1.64 m resembling CO lines in the FTS spectra of mid-K giants. On the other hand, they could potentially be a result of a very young age. Objects 23 and 26 have a very prominent Si I line, based on which they can be G – K giants; based on the weakness of Mg I lines, they could be G-type YSOs. The spectrum of star 27 has the most dwarf-like appearance, with only marginally enhanced CO lines. We mark all these tentative giant candidates with “g?” (except 27), but proceed treating them as YSOs for the placement on the HR diagram, to see whether their age is compatible with the age of the better established cluster members. The flattened spectra of EC117 (an X-ray source) and EC 129 (protostar according to the SED) are consistent with the K – early-M YSO interpretation.
Summarizing, among 13 red stars without the water break we spectroscopically identified 2 A stars, 2 M giants, and 5 possible G – K giants, all likely being reddened background stars.
5. HR Diagram
Our main goal is to derive the age of the Serpens population and to compare it to other starforming regions. This is achieved by comparing positions of sources on the HR diagram with model evolutionary tracks.
5.1. Diagram and the Reddening Determination
Because our sample is highly reddened, optical photometry is not available for most of the sources, while at Spitzer wavelengths one expects contributions from the circumstellar material. The NIR is therefore an optimum wavelength regime to study stellar properties of embedded objects. We consider the location of our spectral targets on the versus diagram to clarify their membership, to identify sources with NIR excess, and to estimate reddening for the subsequent determination of the luminosity.
It is vital to understand where various groups of stars lie in the diagram. First one needs to examine and tabulate the location of non-reddened stars as a function of spectral type and luminosity class. The Bessell & Brett (1988) compilation still remains the most popular source of the NIR intrinsic colors of stars. It was subsequently refined for main sequence stars by Kenyon & Hartmann (1995) in their seminal study of the nearest star-forming Taurus-Auriga complex. Kenyon & Hartmann (1995) demonstrated that non-excess low-mass YSOs are better dereddened to the main sequence rather than the giant locus, despite the subgiant gravities and an intermediate temperature scale (Luhman, 1999; Luhman et al., 2003). Luhman (1999) arrived at the same conclusion for young brown dwarfs (corresponding to spectral types M5), based on the comparison with colors of M stars belonging to the Galactic “young disk” from Leggett (1992). We adopt the locus of Kenyon & Hartmann (1995) for B–K dwarfs, and of Leggett (1992) and Luhman (1999) for M dwarfs, in their original photometric CIT system, as the photospheric colors for Serpens YSOs, with the estimated accuracy of 0.05 mag. Figure 8 shows the NIR color-color diagram for our spectroscopic targets.
One can see that objects suspected to be background giants on the basis of our spectroscopy and the lack of X-rays on average lie to the left from YSOs, consistent with the interpretation of being G – M giants reddened by A mag. Giants/supergiants in general form a blue envelope (in color) on this diagram, branching off the dwarf locus at K5. This is due to their extended atmospheres favorable for molecule formation, and in the case of the asymptotic branch stars due to the modified chemical composition (e.g., carbon stars). Giants can be seen to large distances and are recognized on the Serpens diagram for the whole region as a band of stars stretching along the upper-most reddening vector. All spectroscopic giant candidates from our sample lie in that band. However, three YSOs of SED classes II and III fall in that region as well. As a sanity check we place all giant candidates on the HR diagram (except for the definite giant interlopers 24 and 25) by dereddening them to the dwarf locus and assuming them to be the early-type members of the cluster, to see whether in this case their ages would be compatible with the ages of the better established members.
On the other hand, class 0/I and flat objects (except for EC129) lie to the right of the reddened stellar locus, together with the majority of class II. Their reddening, however, is on average larger than in class II and III objects. Only two sources, class II EC84 and class III EC86, have a location inconsistent with their late M SpT, having either a color too red or too blue. We discuss them further in §6 and the Appendix.
The diagram confirms that the reddening is non-negligible in the region and needs to be accounted for in the photospheric luminosity estimation. It can also affect the SED classification. Without knowledge of SpT, however, it is non-trivial to separate reddening from the excess NIR emission. Kaas et al. (2004) and Djupvik et al. (2006) determined reddening by adopting for all sources one value for the intrinsic color , an average value on the CTTS locus. Harvey et al. (2007b) on the other hand neglected excess contribution in the NIR wavelengths entirely by adopting for a photospheric color of a K7 dwarf star (an average SpT of CTTSs). We determine reddening by examining both location on the diagram and the SpT.
We use two methods for dereddening spectral sources, depending on whether they deredden to the dwarf locus approximately at their SpT or redward of it, indicating presence of the NIR excess.
For all class III sources (except for giants 24, 25 that we did not attempt to classify) and three class II (EC84, W68, K407) we use color rather than . Even if a small NIR excess is present in the latter sources, because the dust temperature is 1500 K the excess will be less in the bands than in the and will not affect our estimate significantly. This fact also explains our choice of magnitude for deriving photospheric luminosity (§5.3). Using the reddening law of Cohen et al. (1981), we adopt
| (1) |
where is the observed color and is the expected intrinsic color, based on the SpT of the object and the SpT– dwarf calibration of Kenyon & Hartmann (1995) for B–K stars and of Luhman (1999) for M stars.
For sources with strong NIR excess and the less obvious NIR cases with excesses at Spitzer bands (EC89 through [K99]40 in Tables 1 and 3) we determine from the and colors by dereddening them along the reddening vector to the adjusted CTTS locus. The CTTS locus shown on Fig. 8 was defined by Meyer et al. (1997) for low-mass YSOs in Taurus with typical SpTs K7–M0. Luhman (1999) and Liu et al. (2003) among others, however, showed that many cooler stellar/substellar young objects lie below this classical TTau star locus, and suggested that its origin on the dwarf locus depends on the SpT of the source. By calculating the intercepting point of the reddening vector passing through a given source with the CTTS locus that was shifted to originate on the dwarf locus at the SpT of that source, we arrive at the following expression for for stars with the NIR excess:
| (2) |
where is the tangent of the slope of Meyer’s CTTS locus in the CIT system, and all other designations are as in (1).
Table 3 lists the extinction and other photospheric parameters that we derive based on our SpTs for YSOs (giant candidates were omitted). Errors in were obtained by quadratically propagating uncertainties in the observed and intrinsic colors in expressions (1) and (2). The uncertainty in the intrinsic color results from a range of SpTs derived for a given source and a 0.05 mag uncertainty in the standard color for a given SpT.
5.2. Distance
Accurate Hipparcos parallaxes are not available for this embedded area, requiring indirect techniques for distance determination. Two distance scales to the Serpens cloud are used in the modern literature. In their (sub-)millimeter study Hogerheijde et al. (1999) adopted 400 pc based on the 425 45 pc estimate of Chiar (1997). The more recent radio and Spitzer surveys, however, use a shorter scale of 220 – 260 pc, based on two studies of Straižys et al. (1996) (259 37 pc) and Straižys et al. (2003) (225 55 pc). An intermediate value of 311 ( 38) pc was adopted in the binary surveys of Haisch at al. (2002) and Haisch at al. (2004), based on the earlier estimate of de Lara et al. (1991). What is the reason for the inconsistency among these estimates?
The estimate of de Lara et al. (1991) is based on the spectrophotometric parallax of 5 B – A stars from Chavarria-K et al. (1988) that have been associated with the cloud because they are surrounded by reflection nebulosities. These stars are: R1 (2MASS J18213334-0202295), R7 (2MASS J18295606+0100228, next to IRAS 18273 0059), R12 (HD 170739), R13 (HD 170784), and R15 (HD 171491). Note that only R7, R12, and R13 lie within the boundaries of the Main cloud, as can be seen in the IRAS 60 m map of Zhang et al. (1988a). The other two stars are situated further south, outside the area surveyed in our work and with Spitzer. The distance was obtained by de Lara et al. (1991) in the following manner. From the reddening-independent and the gravity-sensitive photometric indices, complemented by spectral types from the medium-resolution spectra, they determined effective temperatures and the dwarf luminosity class (class V) for these stars. The reddening was obtained by comparing the observed optical–NIR colors to the model atmospheres of Kurucz (1979). Visual magnitudes were corrected for reddening, and the distance was obtained by comparing them to the standard absolute magnitudes () as tabulated in Schmidt-Kaler (1982) as a function of SpT. Straižys et al. (1996) found that two of de Lara’s et al. (1991) stars, R12 and R15, are nearly equal flux binaries, which means their distances were underestimated in de Lara et al. (1991) by times. Averaging de Lara et al.’s (1991) distances for the remaining stars R1 , R7, & R13 (337, 416, and 330 pc respectively), we obtain 361 34 pc.
Chiar (1997) determined distance using 7 of the Chavarria-K et al. (1988) stars: R1, R7, R10 (HD 170634, illuminates S68), R12, R13, R15, & R16 (2MASS J18365749+0020357). Similar to de Lara’s et al. (1991) study, she employed spectrophotometric parallaxes. R10 was reclassified from A1 to B7 based on UBV photometry. For the remaining stars she adopted the SpTs of Chavarria-K et al. (1988)/de Lara et al. (1991). was determined as an average from two methods: the -index – calibration of Crawford (1978) (using photometry of Chavarria-K et al. (1988)) and the SpT – calibration of Schmidt-Kaler (1982). She then examined the location of these stars on the diagram to conclude that none possesses circumstellar material that could modify the interstellar medium (ISM) value of the total to selective extinction ratio , which was found to be 3.1 0.1 in agreement with 3.3 0.3 of de Lara et al. (1991). If we omit: the shell star R10 that can be more luminous than MS stars, for example, Houk & Swift (1999) assigned luminosity class IV for it; the binaries R12 & R15; R16, discarded by de Lara et al. (1991) due to the outlyingly-large distance 600 pc with a small , then Chiar’s (1997) distances for the remaining sources are 390 pc, 377 pc, and 553 pc for R1, R7, and R13, respectively. We note that R13 is of the earliest SpT of the three, being a B3 star. An uncertainty in index 0.02 mag, corresponding to 1 spectral subclass, at B3 translates to uncertainty of about 0.5 mag in , or 20% in distance, but only of 0.2 mag and 10%, respectively, at A2 (star R1). Omitting R13 and averaging distances for R1 and R7, we obtain 383 9 pc.
The sample of Straižys et al. (1996) is the largest: 18 stars lying within of S68 (R10, or star 61 in their notation). Spectral types, , and reddening were obtained in that work simultaneously by fitting seven-color optical photometry to the calibrated grid of intrinsic colors for 100 stars from the region down to . A plot of versus distance was then constructed by plotting individual values for each star. The near side of the cloud was determined at the abrupt upturn of the extinction values at 200 pc. The far side was defined where no star of zero extinction was observed, at 300 pc. Distances to 18 stars with within this distance range have been averaged to obtain 259 37 pc.
There are five stars in common between Straižys et al. (1996), de Lara et al. (1991), & Chiar (1997): R10, R12, R13, R15, and VV Ser. Stars R10 and VV Ser should not have been used by Straižys et al. (1996), since they are an evolved shell star and a pre-Main Sequence (PMS) Herbig AeBe star, respectively. If we compare distances to the remaining stars (after multiplying the distances of de Lara et al. (1991) and Chiar (1997) by 1.4 times for the binaries R12 and R15), we find that the distances of Straižys et al. (1996) are systematically lower. The reason for the disagreement for these stars lies not so much in the reddening but rather in the absolute magnitudes: the values of of Straižys et al. (1996) are systematically fainter. de Lara et al. (1991) and Chiar (1997) used SpT/color calibrations for dwarf (luminosity class V) stars, while Straižys et al. (1996) for ZAMS stars. We note that both calibrations, of Straižys et al. (1996) (as published in Straižys et al. (1982)) and of Schmidt-Kaler (1982), agree well within a given luminosity type. Since massive stars spend considerably less time on the ZAMS, for a random hot star in the field the use of a dwarf calibration is more appropriate. ZAMS stars are fainter than the more evolved dwarfs, leading to the underestimation of the distance in Straižys et al. (1996). At B6 (star R7) the difference is 0.8 mag, leading to a 40% difference in distance, at A2 (R1) it is 0.5 mag (20% in ), and only by F0 -s become comparable.
In the subsequent paper that explored other sub-areas of the Aquila Rift Straižys et al. (2003) indeed adopted a dwarf calibration for luminosity class V (judging by the catalog given in Straižys et al. (2002)). A caution, however, should be exercised when applying results of their shallow optical surveys to the embedded regions like the one studied here. For example, does not exceed 3m on their extinction plots, while already the earliest NIR studies of the Serpens cluster indicated typical . At high extinction and large distances only bright A–B stars are accessible; their luminosities, however, are very sensitive to the uncertainties in age and SpT, as discussed above. Furthermore, Straižys et al. (2003) regard 225 ( 55) pc as only the front edge of the cloud complex, while the location of the back side is far less certain (”thickness can be about 80 pc”).
Finally, Oliveira et al. (2009) cite a private communication with Jens Knude (2008) that claims distance of only 193 13 pc. With this distance a median age for their IR excess sources would be 10–16 Myr (depending on the tracks), which is quite old considering a well established primordial disk dissipation time-scale of Myr.
For this paper we adopt a distance to the SRN cluster of 380 ( 50) pc, which places it toward the back of the Aquila complex. Our investigation demonstrates that the distance to the Serpens star forming region is still not well constrained and requires a dedicated study.
5.3. Temperatures and Luminosities
Luminosities of spectrally classified Serpens sources were derived from the dereddened band magnitude. Using the reddening law of Cohen et al. (1981):
| (3) |
Bolometric corrections are determined for each SpT from the and dwarf compilations of Kenyon & Hartmann (1995) and Luhman (1999) (K. Luhman 2001, private communication). The uncertainty in for a given SpT is estimated to be 0.1 mag, from comparison between the values of Luhman (1999) and Wilking et al. (1999) for M dwarfs. The uncertainties in luminosity were estimated similarly to the uncertainties in , by quadratically adding the uncertainties of the two groups of variables that depend on the observed photometry and on SpT.
Temperatures for F–K stars were obtained from the SpT– dwarf relation of Kenyon & Hartmann (1995), while for M stars the “intermediate” relation for YSOs of Luhman et al. (2003) was used. The latter is constructed to provide an intermediate value of for a given SpT between the hotter giant and the cooler dwarf values. The largest difference between the giant and dwarf scales of 500 K is reached at M6. At M0 the difference disappears and in K types reverses its sign. The scales were combined by Luhman et al. (2003) to fulfill the condition of coevality of the members of the young quadrupole system GG Tau when using PMS evolutionary tracks of Baraffe et al. (1998) (BCAH98). The error of for each source in Table 3 only reflects the uncertainty caused by the error in SpT. As long as one considers the age spread in the cluster or compares mean ages between clusters studied with the same temperature scale and evolutionary tracks, the systematic errors in the scale should have a negligible effect.
Figure 9 shows Serpens sources over-plotted on the frequently used BCAH98 tracks. These tracks are based on the dust-free NextGen atmospheric models (Hauschildt et al., 1999a); they only start to deviate from CBAH00 DUSTY models (Chabrier et al., 2000) at ages older than 10 Myr and cooler than about 2300 K, which is outside the range of our targets. For consistency, we plot BCAH98 tracks above 0.6 with the same mixing length parameter as for lower mass stars, . We note that this value of may overestimate masses of EC117, EC 129, and some giant candidates by up to 30%, as compared with the recommended . This difference is, however, within the large error-bars on SpTs of the early type members.
The earliest available isochrone in BCAH98 models is 1 Myr, and a large fraction of our sample falls above it. Models of D’Antona & Mazzitelli (1997) (DM) provide isochrones as young as 0.1 Myr, though they may be less accurate being based on the gray atmosphere approximation. In Figure 10 we show the latest 1998 update of these models. Three sets of tracks are available with different initial deuterium abundance fractions. We chose the median value of as it reaches to larger masses; the differences are insignificant in our mass range anyway. The tracks of D’Antona & Mazzitelli (1997) originate from the so-called birthline, that in this case is defined at the on-set of the deuterium burning. All our YSOs except for EC84 fall at or below this line within the errorbars, lending support to their membership in the cloud and accommodating our larger distance. Equal-mass binarity (see Appendix), or an earlier SpT could bring EC84 down to the birthline as well.
Masses according to the two sets of tracks are reported in Table 3. Above 1 Myr isochrone (0.1 Myr in DM97) each track was extended based on the approximately linear interpolation of the the track’s segment between 1 and 3 Myr. The errors in the mass and age for these objects were adopted similarly to the objects that lie within the model grid, by finding the intersection of the errorbars with the the nearest interpolated isochrone/track. Evolutionary tracks of low-mass YSOs are nearly vertical, therefore, the error in the BCAH98 mass in Table 3 is determined primarily by the error in SpT. DM98 masses are given for comparison only. DM98 and BCAH98 tracks best agree between 0.1–0.25 and 2–10 Myr, at the location of W201. At masses DM98 tracks predict 2–3 times smaller masses and younger ages than BCAH98 tracks, while at they predict slightly larger masses and ages.
Evolutionary masses allow us to estimate surface gravities that will be used in selecting photospheric models for fitting SEDs (§6):
| (4) |
It is difficult to analytically derive errors on lg from this expression, considering the non-linear dependences of mass and luminosity on magnitudes and SpT. The difference between g obtained with BCAH98 and DM98 masses, and the difference between g obtained for an upper and lower limit on the SpT for a given set of tracks are comparable to each other and are typically 0.1–0.3 dex. The largest uncertainties are for EC129 and EC117, due to differences in the tracks at the high mass end. These uncertainties are still within the 0.5 dex step of the NextGen synthetic spectra that we use to fit the SEDs.
Since M2-M3 types of Winston et al. (2009) for EC84 and EC86 better explain their NIR colors, we re-calculated their positions on the HR diagram (cyan squares on Figs 9, 10). Both objects remain younger than 1 Myr, but EC84 now moves under the birthline, which makes it a more likely member. This exercise illustrates that unaccounted uncertainties in the SpT M of 3 subtypes translate to the uncertainty in age of the order of the distance between the isochrones drawn on our HR diagrams. The effect is largely due to the change in the temperature, while luminosity is barely affected.
Winston et al. (2009) discuss systematic uncertainties on luminosity (for class II objects). The strongest effects are due to the scattered light and accretion in strongly embedded or inclined sources, resulting in up to 1 dex scatter in the deduced . We can estimate the effect on the stellar luminosity of the unaccounted excess emission from the hot dust in the disk. It will overestimate photospheric luminosity directly, as well as through the overestimation of extinction (as both excess and extinction make object look redder). To estimate this effect on our luminosities, we can re-write the expression in Winston et al. (2009) for the band:
Adopting , from Winston et al. (2009)/Cieza et al. (2005) (corresponding to , ), and from Cohen et al. (1981), we obtain 0.10 dex for the first term in the above expression and 0.20 for the second. Similar effect is obtained when using magnitude for luminosity determination instead of (Winston et al., 2009). However, since in our work de-reddening was performed to the excess locus, the last term can be omitted from this calculation, resulting in the increase of luminosity due to veiling in the band of only 0.1 dex. Uncertainty in SpT, therefore, remains the dominant factor that affects the position of class III and the majority of class II objects on the HR diagram.
6. Spectral Energy Distributions
Unresolved warm circumstellar dust around a YSO can be studied through examining the spectrum and amount of emission it produces in the IR. This excess emission has first to be corrected for the interstellar extinction and separated from the photospheric flux. Our individually determined photospheric parameters allow us to carry out this procedure more accurately (in particular in the cases of small excesses such as evolved disks) and to search for correlations with stellar properties.
We retrieved Spitzer measurements from the High Reliability Serpens catalog (5th data release) of the Cores to Disks Legacy team, and merged them with FLAMINGOS photometry to construct SEDs. The raw and dereddened (following Mathis (1990)) fluxes are plotted in Figure 11. The stellar contribution in the SEDs is represented by the smoothed solar-metalicity NextGen model spectra of the PHOENIX group (Hauschildt et al., 1999a) . The physical parameters of the model spectrum for each star () are the nearest in the grid to our spectroscopically determined values from Table 3. The values used for de-reddening of the observed SEDs are our values from Table 3 (see §5.1). We emphasize that these parameters are based on SpTs and assume YSO properties: an intermediate temperature scale and the dwarf intrinsic colors. NextGen models () are drawn in panels a), b) (except for giant 24), and the first panel of c). For suspected field giants in addition an alternative NextGen-giant (Hauschildt al., 1999b) set of models is shown on the second sub-panel of panel c). The giant models involve spherical geometry to treat the extended atmospheres. To select appropriate giant models we adopted the giant SpT– scale of Perrin et al. (1998), and dereddened those SEDs with derived from the giant SpT– calibration of Bessell & Brett (1988).
If the dereddened Spitzer points lie above the model photospheric flux, it can indicate either an IR excess or incorrectly determined photospheric parameters. If they lie below, it can only be due to the latter reason, unless the models produce systematically wrong colors. The small over-prediction of flux in the & bands at 10% level (0.05 dex in log Fλ) seen for sources with 4000 K is a known feature of NextGen models, and is likely caused by the incomplete treatment of water bands (Leggett et al., 1996, 2001). Except for this effect, no systematic offsets are seen between the models and Spitzer fluxes in Figure 11. Among YSO candidates we find only two cases where SpTs and the assumption of dwarf NIR colors result in photospheric parameters inconsistent with their SEDs: EC84 and EC86. As discussed in the Appendix, the discrepancy is likely due to earlier SpTs. Models corresponding to M2-M3 types of Winston et al. (2009) can fully account for the dereddened fluxes of these objects up to 6 and 8 m in EC84 and EC86, respectively.
The last panel of Figure 11 verifies the giant hypothesis for the spectroscopically suspected giants. As one can see, the SEDs of all “g?” sources can be described equally well when applying YSO and giant K3 – K5 SpT–– calibrations. For the strong M giant candidates 24 and 25, however, the dwarf can be firmly ruled out, requiring that is too large to fit the SEDs. These two objects are better fitted with M0 – M3 giant models (only the giant fit is shown for source 24 in Figure 11). Sources 23 and 26 could be G type stars according to their spectra. For source 23 a good match is obtained with both dwarf and giant models of SpT G7, while for 26 only a fit with a K type model is possible (G type requires too large inconsistent with the SED). We conclude that the SEDs of all G – K field candidates are consistent with the background giant interpretation.
For stars showing excess above the photosphere we compare their de-reddened SEDs with the SpT-dependent median thick- and thin(“anemic”)-disk SEDs of IC348 YSOs from Table 4 of Lada et al. (2006), de-reddened by as recommended by the authors. Dependence of SED on the SpT has been largely ignored in the past studies, by using Meyer’s et al. (1997) approximation of the CTTS locus on the NIR color-color diagrams or the median CTTS SED from D’Alessio et al. (1999). Both have been based on the study of the solar-mass YSOs from the Auriga-Taurus star-forming region, with typical SpTs of late-K and ages 1–2 Myr. Spitzer surveys of various star-forming regions provided enough statistics to refine SED classification. According to the IC348 templates, the largest NIR excess is observed in K stars, followed by G and M stars, and finally by A–F stars. Note, however, that the SEDs of Lada et al. are empirical, so it is not clear whether the reflected dependence on SpT is due to different illumination by the host star (Muzerolle et al., 2006) or due to the different evolutionary stages, e.g. dust settling. By examining the fraction of stars with excesses and gas accretion indicators as a function of cluster age, it has been shown that the low level of the NIR excess in massive stars must be due to the shorter disk dissipation time (Haisch et al., 2001a; Hernández et al., 2005; Carpenter, 2006; Lada et al., 2006). On the other hand, the low-mass stars hold to their primordial disks longer, but the NIR excess is suppressed for the following reasons: 1) the peak of the photospheric emission shifts to longer wavelengths decreasing the excess contrast, 2) the disks themselves are expected to be cooler and smaller. Figure 11 shows a good agreement between D’Alessio et al. SED (in red) and a thick disk SED of Lada et al. (green) for K6–M0 stars (4200–3800 K), as expected. The majority of our YSOs, however, have later SpTs and should be compared to the Lada et al’s SEDs (see a case-by-case discussion in the Appendix).
7. Discussion
7.1. Circumstellar Properties of Serpens YSOs
As shown in the Appendix, the physical properties and the accurate evolutionary stage even for the brightest IR sources in the cloud are poorly constrained in the literature. Using our photometry and spectroscopy, we derived uniform SpTs, extinction, and photospheric luminosities for 16 YSOs from the Serpens core cluster and constructed the HR diagram. For 5 YSOs (EC89, EC74, EC114, STGM1, H230, SED classes 0/I–II) and a YSO candidate 19 (class III) SpTs were determined for the first time, as well as for 11 field candidates. Our sample of YSOs according to BCAH98 tracks turned out to be comprised mostly of low-mass stars, 3 substellar objects, 2 solar-mass stars, and 2 intermediate mass stars (SVS2 and SVS20), of various SED classes. Eleven excess-free stars examined as possible Class III members have been identified as probable interlopers, mostly background red giants.
There is a longstanding debate on the nature of the flat SED objects. Their SEDs are intermediate between the rising class 0/I where excess is produced by the massive cold envelopes, and the declining class II where it is produced by the un-obscured hotter disks. Does it mean that flat sources represent an intermediate evolutionary stage? Not necessarily according to Crapsi et al. (2008), who claim that flat objects are disk systems seen edge-on. Furthermore, White & Hillenbrand (2004) investigated high-resolution optical spectra of class I and class II sources with HH outflows and found little evidence of a systematic difference with the more typical class II sources, in terms of mass, luminosity, rotation rate, accretion rate, and the millimeter flux density. The larger frequency of the outflow-related forbidden emission lines in class I objects in that study was explained by a better contrast against the obscured photospheric spectrum in the edge-on disk systems. On the other hand, Doppmann et al. (2005) found based on their high-resolution -band spectra larger and veiling in classes I-flat than in class II objects. They argued that the sample of White & Hillenbrand (2004) was not representative enough: it only covered the Taurus-Auriga region and was biased toward optically-visible, more evolved objects. Beck (2007) analyzed spectra of 10 variable class I and flat objects in Taurus. Based on a number of diagnostics they concluded that of the 4 flat sources ( between 0.10 and 0.25) 1 was a truly transition source, 1 a protostar, and 2 reddened CTTS.
What about Serpens flat SED objects? First, we observe that they can be found anywhere on the diagram where , mixed with CTTSs and protostars. IRAC-based classification helps single them out, but these wavelengths are still susceptible to extinction. As a result (as shown in the Appendix), studies that perform classification on de-reddened SEDs tend to assign later classes than those that use the observed SEDs. It is difficult to estimate reddening without the knowledge of the SpT; not surprisingly, for some of our objects the values in the literature vary by as much as 5 – 10 mag. The key to typing YSOs in our work was comparison of the absorption features in their spectra (whose origin we attribute to the photosphere) with features in the the optically-classified YSOs from a similar-age cluster IC348. The protostars that we were able to classify are all located within the reddened CTTS locus on the diagram, indicating that excess emission could primarily originate from a disk. Detection in the X-rays of all observed flat-class objects but EC129 also makes them more similar to CTTS than class 0/I objects. Furthermore, after correcting for extinction we found that all of the flat class objects turned out to have SEDs resembling the CTTS SED of D’Alessio et al. (1999) (except maybe for H232 with lower excess in the IRAC bands). And while we could not deredden SVS2 and SVS20, their mid-IR spectra (obtained thanks to their high luminosity) also reveal signatures of disks (the silicate emission). However, all our spectrally classified flat objects (except EC129) turned out to be low-mass M stars, which is not surprising considering that our low-resolution spectroscopy is most favorable at characterizing late-type YSOs. Compared to the CTTS disk of D’Alessio et al. (1999) that represents more luminous solar-mass stars, disks around M stars can be expected to show smaller excesses. We therefore compared Serpens flat class SEDs with the SEDs of low-mass stars from Lada et al. (2006). The comparison revealed (Fig. 11) that Serpens flat objects do have more excess at mid-IR wavelengths than the similar SpT class II objects in IC348, perhaps indeed indicating an earlier evolutionary stage. Serpens class II objects, on the other hand, have comparable SEDs to their thick disk counterparts in IC348.
In two class flat/II objects (H232 and STGM1) we detected Pa in emission, which is interpreted as a sign of a gas accretion. The accretion luminosities inferred for these stars (see calculation in the Appendix) are average for CTTSs, as well as for class I (Muzerolle et al., 1998; Beck, 2007). H232 is of particular interest as its low-level NIR excess contrasts with the optically-thick mid-IR excess, indicating a sort of clearing in the inner disk, perhaps due to formation of a gas giant planet. In later type members the accretion is not excluded, but we could not detect comparable strength Pa in their lower S/N spectra.
We confirm the lack of excess in all class III Spitzer-classified objects. No NIR or IRAC excesses are observed beyond 10 Myr, in agreement with other studies that found primordial disk fraction of only few percent beyond this age (Haisch et al., 2001b; Hernández et al., 2008). The optically-thin emission at 24 m, in particularly expected from debris disks, can not be probed in our low-mass sample being below Spitzer detection limit. Our confirmation of the presence of the transition/evolved disks ([K99]40 and K407), however, encourages searches of young thin disks among IRAC-classified class III objects with the next generation of the IR facilities, such as Herschel.
In our study the previously reported SED classes were generally confirmed. It is not always because simply turned out to be too small ( 10 mag) to modify their SEDs. We find that the interpretation of the SED classes crucially depends on the knowledge of the SpT of the host star. The amount and the shape of the deduced excess depends on how precisely the reddened photospheric flux was subtracted, for which one needs to know the temperature and (to a lesser degree) gravity of the star. Furthermore, for a given dust configuration, the emitted SED will depend on the properties of the central star, such as the effective temperature and luminosity. In the case of the cool class Flat objects we showed that their de-reddened SEDs can look like the SEDs of the hotter (and more massive) CTTS, but when compared to other objects of the similar spectral type/mass represented by the M-type IC348 templates of Lada et al. (2006), we observe that these Flat YSOs posses more emission and thus can be less evolved than class II. Similarly (see Appendix), we showed for small excesses, by comparing SED fitting with our and with Winston’s et al. (2009) SpTs, that they can be interpreted either as thinned ([K99]40), gapped (H232), or normal thick disks depending on the amount of de-reddening and the selected SED template, both of which are derived using SpT. Our study also emphasizes the need to develop models of the circumstellar environment for the low-mass objects to understand the evolutionary status of the empirical SEDs of Lada et al. (2006).
We now want to test an age sequence between SED classes of Serpens objects. Despite a wide-accepted theory that these classes represent an evolutionary sequence, little evidence exists for the age trend in the literature. The task is difficult due to the limited samples, different techniques for placing different SED classes on the HR diagram, and large observational errors. As our HR diagrams show (Fig. 9, 10), class 0/I EC89 is one of the youngest sources, being 1 Myr old. Class II objects are mostly 1 – 5 Myr-old, and diskless stars are mostly 3 Myr old. This is in contrast with the studies of Winston et al. (2009) and Muench et al. (2007) who did not find any difference in the age distributions between class II and III sources in Serpens/NGC1333 and IC348, respectively, based on larger samples. In the light of the latter result it is hard to understand the observed evolution of the disk properties observed by other and these researches, such as the amount of extinction, the shape of the excess, gas accretion, dust crystallinity, etc. We agree with these and other surveys (e.g., Flaherty & Muzerolle, 2008), though, about the existence of the diskless objects even at the youngest ages, indicating additional factors for disk clearing besides age. Given the discussed uncertainties of placing and interpreting YSOs on the HR diagram, we feel that more afford is needed in the direction of the comprehensive study of the individual objects, which we attempted in the the present work.
7.2. Star Formation History in the Cloud
The HR diagram shows that the average age of the cluster is about 1 Myr. A smaller distance of 259 pc would shift the sources to fainter luminosities by 0.33 dex, bringing the mean age to 3 Myr and increasing the age spread, as indeed observed in Winston et al. (2009). Six stars that could be potentially G-K cluster members appear displaced on the HR diagram from the rest population. Coupled with the lack of Xrays for the moderate reddening and high luminosity, and the hints from spectroscopy (enhanced SiI or CO lines), it points to the likely background giant nature. On the other hand, 10 – 20 Myr age is not totally excluded for class III members in such clusters (see e.g. Luhman et al. (2003); Winston et al. (2009); Muench et al. (2007)). Given the lack of the classified intermediate-mass members in Serpens, we list these objects in Table 2 for the future investigation of their status with a higher spectral resolution.
Our age estimate for the more certain members is similar to that inferred for the cluster from the luminosity functions in the literature, and for the less rich cluster B further south in the cloud (Djupvik et al., 2006). The mean ages of 1 – 3 Myr are typical for embedded clusters. However, unlike some other studies, we find only a moderate age spread of Myr in the surveyed parsec-wide area around the cloud core, source 19 would be the only member older than 10 Myr according to both BCAH and DM tracks.
In order to investigate the nature of the age spread, one can examine the location of the various SED classes in the cloud. Previous IR surveys already identified that the core of the cluster is richer in protostars, while the outskirts are dominated by a much larger scattered population of T Tau stars (Kaas et al., 2004; Harvey et al., 2006; Winston et al., 2007). Furthermore, if we compare two Spitzer-selected YSO samples, one by Harvey et al. (2007b) that is limited to strong excesses, and another by Winston et al. (2007) with more relaxed excess criteria and inclusion of X-ray sources, we see that the entire (3 pc wide) region surveyed in the latter study is populated by active diskless stars, blurring the cluster boundary. But since the correlation between SED classes and ages is not perfect, in Figure 12 we show ages directly, as inferred from our BCAH98-based HR diagram. One can see that objects younger than 1 Myr are all concentrated in the core, while the older ones lie further out.
One scenario suggests that the process of star formation in the Serpens core is continuous, being responsible for both protostars and the 1 – 5 Myr-old dispersed population. In our study however, there is an evidence that not all YSOs in the halo are randomly distributed (as would be expected if they migrated from the core). Some YSOs delineate two dark filaments, one branching south and another (less conspicuous, between H232 and [K99]40) east of the main core, see Figures 2 and 12, as well as Fig. 12 in Kaas et al. (2004). Similar elongated orderings were found in many other young clusters (Allen et al., 2007), as well as in the Serpens South cluster (Gutermuth et al., 2008), and imply multiple sites for star formation in the cloud.
Did individual groupings of YSOs form independently, for example from the turbulent condensations in the cloud, or was the whole process triggered by external force? It has been proposed that winds and ionization fronts from O – B stars create a propagating wave of star formation (e.g., Ikeda et al. (2008); Reach et al. (2009); Koenig et al. (2008)). In the case of the Serpens cloud, however, there are no nearby O stars. There are only three late-B stars, including the illuminating source of the S68 nebula, to the north-east of the core, and a B9/A0 binary HD170545 to the south. The former stars may be responsible for heating the dusty ridge flanking the Serpens cluster on the east side (bright area seen on the left of Figure 12), but it is not clear how it could assist the cloud collapse. A comparable or larger age spread than in Serpens has been found in many other starforming regions without evidence of hot star intervention. For example, Gaalfalk & Olofsson (2008) describe a possible constant star-formation over 50 Myr in the low-mass region L1641N in Orion, while Muench et al. (2007) find a 5 Myr long episode in Perseus cluster IC 348. Furthermore, Román-Zúñiga et al. (2008) concluded for a rich Rosette complex that the cluster ages cannot be satisfactory explained by the propagation of the HII region. Finally, it is impossible not to speculate on the role that the intermediate-mass stars SVS2 and SVS20 may be playing in the cloud. They are centrally located between two sub-cores and are surrounded by large cavities oriented SE-NW, along the axis of protostars as seen in Figure 2, implying the same direction for the outflows. Warren-Smith et al. (1987) already proposed that the star formation in the core could have been caused by the outflow of SVS2. An outflow-triggered star formation episode was described for example in the OMC-2 FIR 3/4 region in Orion (Shimajiri et al., 2008) and in the Perseus cluster NGC 1333 (Sandell & Knee, 2001). The outflows may as well eventually destroy the cloud and shut-down the star-formation process.
To differentiate among all these scenarios, an age determination should be performed for a larger number of cloud members. For example, Figure 3 shows that there are several diskless YSOs in the vicinity of SVS2 and SVS20. We investigated EC86, EC117, and EC84, and found that formally their ages are 1 Myr, being consistent with coeval origin with the protostars in the region. It is vital to obtain ages for the rest of class III objects, as well as to search for old stars that would indicate a prolonged phase of star formation instead of a burst.
8. Summary and Conclusions
We obtained images and spectra in a area centered on the Serpens reflection nebula with an associated embedded cluster. We determined SpT/ and other stellar properties for 15 YSOs (plus 1 tentative) of SED classes 0/I through III, in 6 cases they were derived for the first time. Reddening for objects without NIR excess on the diagram was estimated assuming a dwarf intrinsic color, while for objects with excess dereddening to the adjusted CTTS locus was performed. We found that ranges from 2 to 24 mag, precluding optical studies of some of these objects. Spectral classification was performed against the comparable spectra of YSOs in a similar-age cluster IC 348. The SpTs turned out to be mostly early to late Ms, unlike the late-K types of more massive CTTSs often assumed for class II objects in the literature (Kenyon & Hartmann, 1995; Meyer et al., 1997). The derived stellar parameters allowed to construct an HR diagram and interpret the SEDs. The main results of this study are the following.
-
•
According to the the BCAH98 theoretical tracks, three objects are young brown dwarfs, all of the SED class II: [K99]40, H230, and W68 (and possibly class I EC89). Few more class II and III brown dwarf candidates are visible, but but not discussed, on the HR diagram of Winston et al. (2009). Only one other brown dwarf has been previously spectroscopically confirmed in Serpens, and its SED class is unknown.
-
•
We critically evaluated previously published distance measurements and concluded that 380 pc is a more appropriate value. The earlier distance estimate of 259 pc may be too low due to the adoption of the ZAMS, rather than a dwarf, luminosity scale for field B – A stars for this particular region in Straižys et al. (1996) and Straižys et al. (2003). One of the implications of the larger distance scale is that a number of suspected PMS wide binaries are unlikely to be gravitationally bound (such as EC 129).
-
•
Among 11 objects with NIR magnitudes comparable to Serpens low-mass YSOs, eight are likely background reddened K – M giants, as indicated by prominent CO features in the band. This technique only works for late-K to M types. At earlier types it is extremely difficult to differentiate YSOs without disks from old field stars. X-rays, variability, and atomic line youth diagnostics in the optical spectra (such as LiI and emission in H) can be used for the definite identification of class III YSOs.
-
•
The SEDs of the investigated objects are diverse: from class I, CTTSs, evolved disks with holes, to diskless objects. We showed that the uncertain reddening in the SED class flat objects can be a reason for assigning adjacent classes I and II to them in the literature. The de-reddened flat class SEDs of Serpens low-mass objects, however, do differ from the SEDs of class II objects in Serpens and IC348 of a similar SpT, by having lager excesses at mid-IR.
-
•
We found two Fl/II objects 3 Myr-old (H232 and STGM1) with on-going gas accretion typical of T Tau stars as evidenced by emission in Pa . H232 is especially interesting with depression in the SED short-ward of 10 m. We also detected He I emission line at 1.083 m in SVS2, the illuminating source of the Serpens reflection nebula, confirming that this source drives an outflow or wind and may be capable of destruction of the cloud. A rich emission-line spectrum was found in a protostar EC103, which is associated with a compact blue extension, probably an outflow cavity.
-
•
Our data confirms that X-rays are good indicators of YSOs, but not always for the more embedded class 0/I. The sensitivity limit of Chandra survey for Serpens is inferred to be at , roughly corresponding to a brown dwarf boundary at 1 Myr.
-
•
We determined the average age of the cluster to be about 1 Myr, but with a range between 1 Myr in the cluster core up to 5 – 10 Myr in the corona. Unlike in Winston et al. (2009), we do not find members beyond 30 Myrs, which makes it more similar with NGC 1333 from their study. We found that class II objects to the east and south of the core lie along two dusty filaments, seen in the NIR, Spitzer, and 850m images of Davis et al. (1999). Such filamentary structures are often observed in embedded clusters.
-
•
There is a tendency of age to correlate with the SED class: class 0/I objects are 1 Myr, and class III objects are on average older than classes Flat and II. However, there is a number of extremely young sources in the cluster core that appear to lack circumstellar material (EC84, EC86, EC117). This remains true also with the earlier SpTs of Winston et al. (2009) for EC84 and EC86. More sources like this can be seen in Winston et al. (2009). Alternatively, these sources could be multiple systems or variables.
We dedicate this work to Joern Rossa, our colleague and good friend at UF, who passed away shortly after this paper was submitted.
Appendix A Comments on Individual YSOs
In this Appendix we discuss each of the candidate YSO in detail, roughly in the order of decreasing excess, as plotted on Figure 11.
EC89 is the only class 0/I object
that we could spectroscopically classify and place on the HR diagram
(the spectrum of another similar object, EC 103,
does not have sufficient S/N for spectral classification,
and in addition is veiled with emission lines).
It was assigned SED class 0/I in Winston et al. (2007),
class I in Kaas et al. (2004), and not classified in Harvey et al. (2007b)
except for a YSO designation.
It is difficult to measure the 24 m flux
because it is a part of a dense mini-cluster of protostars, together with EC84.
Duchêne et al. (2007) consider it to be a component of a wide binary
system with class I EC88 (red protostar 4.4 south
in Figure 3, a radio source (Eiroa et al., 2005)).
Duchêne et al. (2007) discovered that EC89 itself is a binary,
with a tight IR companion at 0.13 separation,
corresponding to 49 AU for 380pc.
We derive age of EC89 to be less than 1 Myr according to both sets of tracks,
and mass close to the brown dwarf boundary.
The 10 times larger mass and surprisingly old
age of 42 Myr deduced by Pontoppidan et al. (2004) for this source (SVS4-6)
must be due to their overestimation of 4750 K,
that corresponds to an early-K star as compared to our mid-M classification.
A -band echelle spectrum is shown in Doppmann et al. (2005),
with Br in emission and CO band in absorption;
unfortunately, the authors were not able to derive
photospheric parameters due to low S/N.
According to our estimates it is more embedded and intrinsically
more luminous than the comparable mass class II objects [K99]40 and H230.
After de-reddening the SED with ,
the excess remains higher than in the CTTSs at all wavelengths,
confirming Spitzer classification (Fig. 11).
EC89 was not detected in the X-rays (Giardino et al., 2007; Winston et al., 2007),
as are none of class 0 objects in Serpens.
EC129 is intrinsically the most luminous object that we were able
to place on the HR diagram. Together with EC117 it is a solar-mass star
according to the BCAH98 tracks.
It illuminates a cometary nebula in the NIR images.
Kaas et al. (2004) assigned SED class flat to EC129,
Harvey et al. (2007b) class I, and Winston et al. (2007) class 0/I.
Figure 11 shows that the de-reddened SED lies
close to the CTTSs,
therefore, class II would be a more appropriate classification.
One can notice the lack of the NIR excess, which
can either be interpreted as an inner disk clearing
or if the star is of the slightly later SpT (M2-M3);
in the latter case, however, it will fall above the birthline
on the HR diagram.
We think that the assignment of the earlier SED classes
is due to the underestimation of the extinction –
the surveys of Kaas et al. (2004), Harvey et al. (2007b),
and Winston et al. (2007) do not report any value for ,
Eiroa & Casali (1992) obtained by adopting
constant , while our
SpT-based method resulted in the larger .
We speculate that the non-detection of X-rays may be also due to large extinction.
The -band spectrum of
Doppmann et al. (2005) exhibits weak absorption lines
that allowed them to estimate K,
based on comparison with NextGen spectra.
Br exhibits asymmetric double-peak emission.
The CO band at 2.29 m is mainly in absorption,
but also contains a weak blue-shifted emission.
The spectrum is very similar to their spectrum of
GV Tau S, an evolved class I object.
In a more recent study Doppmann et al. (2008) revised
for GV Tau S from the original 4500 K to 3800 K,
modeling the absorption part of the CO profile
as arising from the photosphere
and emission from the disk.
This implies that their estimate of for EC129 could be also too high,
favoring our value of K.
Haisch at al. (2004) detected a faint star 6.2 north-west of EC129,
which can also be seen in our -band image.
They speculate that it could be a wide companion to EC129.
However, with pc the separation would be 2360 AU,
beyond the the 2000 AU limit for the gravitationally bound systems they were looking for.
EC74 is classified as a flat class source
in Harvey et al. (2007b) and Winston et al. (2007), with no reported,
but as class II in Kaas et al. (2004).
Indeed, as seen on Fig. 11,
the de-reddened SED is close to the CTTS one of D’Alessio et al. (1999).
However, when comparing to the thick disk SED
of a mid-M source in IC348, we observe that the excess in EC74
is considerably larger.
According to the location on the
HR diagram, EC74 is 1 Myr and is likely to be in the embedded stage.
Absorption bands of silicates and ices have been detected in
the mid-IR spectrum of EC74 and other
YSOs in the Serpens core by Eiroa & Casali (1992), Boogert et al. (2008), and Pontoppidan et al. (2008).
The most straightforward association of these species is
with the massive circumstellar envelopes.
This interpretation, however, is complicated by the possible
high-inclination disk effects (Crapsi et al., 2008),
and the contribution from the ambient material of the molecular cloud,
since similar bands are also observed in the background sources (like CK2).
Lahuis et al. (2007) report the detection of H2 S(2),(3), and [NeII]
emission lines in the Spitzer spectra of EC74, indicative of a 800 K gaseous disk
within 2 AU from the star and of high-energy photons to heat it,
such as from the stellar chromosphere or accretion shocks.
Indeed, EC74 is an X-ray source, unlike EC89 and EC129.
Kaas (1999) reported EC74 to be variable in the band on the time-scales
from 2 days to 1 year.
We classified this object using water bands only,
as our spectrum is too noisy for detection of atomic lines.
The low-resolution -band
spectrum of Eiroa et al. (2006) is mostly featureless,
with a weak Br in emission, which is expected from veiling
from a hot circumstellar material.
Whether the object is a CTTS or in a less evolved stage thus remains to be
further investigated.
It is intriguing that it might be situated
at the edge of the disk-like structure around SVS2 (Fig. 3),
though the size of the latter (10,000 AU) implies that it must be a shadow rather than
a physical structure (see discussion below).
EC114 is another example of a low-mass
flat class YSO without an estimate in the Spitzer
papers. When de-reddened (10), the SED fits that of the CTTSs,
but rises above the IC348 disk templates for M stars.
It is an X-ray source.
H232 was classified as a flat SED source
in Winston et al. (2007) without an estimate,
and as a CTTS (thick disk class II) in Harvey et al. (2007b)
with 8.6, which is close to our 7.3.
As seen from the diagram and from the SED,
the excess only starts at 3 m and experiences an upturn at 6 m.
It would still be consistent with a thick disk IC348 SED considering
its M type, except for the elevated excess at long wavelengths.
The contrast with the low NIR excess is remarkable,
reminiscent of transition objects, though to a lesser degree.
The source shows a prominent emission in Pa in our spectrum (EW10.51 Å ),
indicating an on-going gas accretion.
Using de-reddened -band magnitude to flux calibrate the spectrum,
we obtain the emission flux in the line
.
Using the empirically calibrated dependence of Muzerolle et al. (1998)
of the Pa luminosity on the accretion luminosity, we obtain
, which is a typical value
observed in class II objects in Taurus and Ophiucus (see histogram in Muzerolle et al. (1998)).
Winston et al. (2009) report also the presence of the CaII 0.8 m triplet in emission in this star.
It is an X-ray emitter.
Winston et al. (2009) obtained a slightly larger stellar luminosity (with our distance)
(vs. our -0.25 0.11), but also an earlier SpT=M0 1.5
(vs. our M3 0.6), which still makes it a 1-2 Myr old low-mass star.
Earlier SpT means less reddening (we calculate =6.0 mag vs. ours 7.3)
and a higher Teff for the model photosphere (3900 K vs 3400 K).
Both effects make the observed IR excess stronger,
but Lada et al’s K6-M0 SED has also stronger excess than the M2-M3 one.
The net effect on the SED is that the object can still be classified as a CTTS.
Interestingly, the up-turn in the SED remains with the SpT of Winston et al. (2009),
but it now manifests as the lack of the 3.5-5 m emission compared to the template,
which in principle can be interpreted due to a gap in the disk.
STGM1 was characterized as ”likely class II” in Kaas et al. (2004) with 6.7,
class flat in Winston et al. (2007) with no estimate, and
CTTS (thick disk class II) in Harvey et al. (2007b) with 8.9,
compared to our 6.8 1.
Similar to other discussed flat-class objects,
the excess deviates significantly from the thick disk
M-type templates and reaches levels of the solar-mass CTTS,
except perhaps at NIR wavelengths.
It is another object beside H232 that shows Pa in emission
with EW Å. It translates to
after de-reddening, resulting in ,
which also falls within a range of typical values
observed for class II objects in Taurus and Ophiuchus.
The accretion luminosities are comparable in H232 and STGM1
when considering them relative to their photospheric luminosities:
. Both objects have ages 1 – 2 Myr.
We note that emission in Pa of the same level can be present
in other late-M Serpens objects as well, but it cannot be detected due to lower S/N of their spectra.
X-ray information is not available for STGM1 because
it is outside the Chandra FOV.
H230 and W68 are the lowest mass
objects in our sample, young brown dwarfs with disks.
Unlike in flat objects, their SEDs are below that of the the CTTSs,
but fit nicely the thick disk late-M template in IC348.
W68 was classified as a class II object in Winston et al. (2007),
but with very uncertain 2MASS photometry it did not pass the YSOs criteria
of Harvey et al. (2007b).
Winston et al’s 2007 (as converted from using Cohen’s law)
is somewhat larger than our .
Winston’s et al. 2009 optical SpTM8.7 5.0 is
consistent with ours M7.75 0.75, while their (corrected to our distance) luminosity
is larger: vs. -1.94 0.09. The object is clearly substellar
and is younger than 1 Myr in both studies. Winston et al. (2009)
from their optical spectrum find that it has an outstandingly low gravity that could indicate that it is
a background giant instead, but that measurement can be
erroneous due to the low S/N, given the large errorbars on their SpT.
H230 was assigned class II in both Spitzer studies.
Winston et al. (2007) obtained ,
Harvey et al. (2007b) 7.7
and (for our distance),
and we obtained intermediate , .
To remind, Winston et al. (2007) de-reddened YSOs to the CTTS locus,
Harvey et al. (2007b) to the color of a normal K7 dwarf,
and we to the lowered CTTS locus (as appropriate
for M dwarfs).
Together with H232, [K99]40, and two more class II sources,
H230 appears to trace the southern edge of the dark lane that
branches eastward of the cloud core (Figure 2).
The non-detection in the X-rays of H230 and W68 can be due to the low luminosity
of these objects, as well as the location on the
periphery of the Chandra field.
[K99]40 and K407 present cases of disks with reduced emission,
usually called anemic or evolved and sometimes transition, though the latter
term is reserved for objects with thick outer disks.
In [K99]40 and K407 the excess starts at m
and stays below that of CTTSs. When comparing with IC348 M-types,
the excess in these YSOs is intermediate between the thick and the thin disk templates.
The ages (Myr) and the reddening values are comparable with the more “normal” class II objects;
for [K99]40 was obtained (Winston et al., 2007), 7.5 (Harvey et al., 2007b),
and (this work);
for K407 (Winston et al., 2007), 3.4 (Harvey et al., 2007b), 2.1 (Kaas et al., 2004),
and (this work).
The values for the stellar luminosity are consistent
between (corrected for distance) Harvey et al. (2007b) and us:
for [K99]40: and ;
for K407 and , respectively.
Winston et al. (2009) obtained a smaller luminosity for [K99]40:
-1.74, and a similar for K407: -0.74. But in combination with their later SpTs
(M9.0 5.0 vs. our M6.75 0.75 for [K99]40,
M5.0 1.0 vs. our M3 0.5 for K407),
the interpretation remains – [K99]40 is 1 Myr and may be substellar,
while K407 is older and more massive.
K407 is outside of the Chandra FOV but was detected by XMM-Newton;
[K99]40 was not detected in the X-rays, but it may be
due to its low luminosity and high extinction.
How do SpTs of Winston et al. (2009) fit the SEDs? For K407 the status
of evolved disk remains valid, as the difference in SpTs of 2 subtypes
results in the difference in reddening of only 0.3 mag. We only note that our
earlier SpT better describes its location on the diagram,
according to both FLAMINGOS and 2MASS photometry.
On the other hand, for [K99]40 later type and smaller de-reddening ( vs. ours 8.4)
resulted in a good match with the thick disk M6 template.
The comparison, however, is far less reliable than for K407 due to
the large uncertainty on Winston’s et al. SpT and the lack of
NextGen models with the required 2400 K.
Adopting this late SpT would also move [K99]40 above the birthline.
SVS2 is the second (after SVS20) brightest IR source in the Serpens main core;
it is optically visible and illuminates the SRN.
It is a single star according to Duchêne et al. (2007).
Despite the long history of study, however, there is no spectroscopic
estimate of the temperature and hence
the accurate estimate of the extinction, mass, and the evolutionary status.
These parameters have been constrained through various indirect methods,
such as: the visual brightness
(Worden & Grasdalen, 1974), the color (Harvey et al., 1984),
the temperature and the IR luminosity of the
gas (Ungerechts & Guesten, 1984) and dust (Nordh et al., 1982)
in the cloud, the SED (Wolfire & Churchwell, 1987),
the depth of the 3.07 m ice band (Eiroa & Hodapp, 1989),
and the brightness of the reflection nebula (Pontoppidan & Dullemond, 2005).
These considerations indicate SpT between B7 and F5,
, and , which translates
into a star of a 2 – 10 Myr age
using tracks of Siess et al. (2000).
The reason for the lack of a definitive
estimate of the spectroscopic temperature
is the optical faintness of the star ()
and a weakness of the absorption spectrum.
The optical spectrum by Cohen & Kuhi (1979) shows a rising continuum with
only a weak emission in H and possibly [OI] 6300Å , and
was assigned uncertain “M0:” type.
The -band spectrum of Doppmann et al. (2005)
only exhibits emission in H2 and a double-peak weak emission in Br.
Similarly, our NIR spectrum is devoid of strong absorption lines,
and so we did not attempt to classify it.
However, we detect, to our knowledge for the first time,
an emission line that can be
identified with the HeI line at 1.0830 m.
It is resolved with FWHM500 km/s,
comparable to the width of the structured H profile in Gomez de Castro (1997).
Unfortunately, the line falls outside of our standard calibration window,
therefore an accurate flux estimate is not available from our observations.
This line is frequently observed in CTTSs.
According to the models of Kwan et al. (2007),
a symmetric profile without a blue-shifted absorption
originates in a polar stellar wind
observed at inclinations (their Figure 7).
If strong wind is present in SVS2, it could be responsible
for the SRN cavity, indicating that
a single intermediate-mass star is capable of disrupting
its parental cloud and perhaps controlling
the rate of the low-mass star formation.
Kaas et al. (2004) classified SED of SVS2 as flat, Winston et al. (2007) as class 0/I, both without reddening estimate; Pontoppidan et al. (2003) and Lahuis et al. (2007) as a class II, and Harvey et al. (2007b) only marked it as YSO. It clearly has a NIR excess (Fig. 8), which may be responsible for line veiling. Kaas (1999) reported variability in the band on a yearly timescale. Indeed, comparing our photometry with Kaas (1999) (2MASS magnitudes are saturated), we observe that the difference is roughly along the reddening vector corresponding to decrease by mag. SVS2 shows signs of an outflow and a disk. Huard et al. (1997), among others, from polarimetric observations deduced that the star is surrounded by a cavity, and even identified few H2 knots that could be excited by the the active outflow of SVS2, though the association is quite uncertain given the crowdedness in the region. On the other hand, strong silicate emission features at 10 and 18 m observed in the SVS2 spectrum (Kessler-Silacci et al., 2006; Boogert et al., 2008) are thought to originate in the surface layer of dusty disks (e.g., Furlan et al. (2006)). Furthermore, Lahuis et al. (2007) reported the detection of the H2 S(2) emission line in the Spitzer spectrum, indicative of a 1000 K gas, while Pontoppidan et al. (2003) and Pontoppidan & Dullemond (2005) found evidence of hot CO gas in Keplerian disk within 1 AU from the star. It is an X-ray source as are most of the CTTSs. Finally, as seen in Figure 3, SVS2 is surrounded by a dark lane of diameter 1–1.5 (20,000–30,000 AU) with a wedge angle 20. Such structures have been modeled as shadows cast by disks with radius 100 AU inside the ISM cavities (e.g., Pontoppidan & Dullemond, 2005; Stark et al., 2007). To reconcile the strong silicate emission features characteristic of the face-on disk with the edge-on geometry inferred from the shadow model, the disk was proposed to be very tenuous, while the shadow would be produced by the puffed-up inner rim, which would be also responsible for the NIR excess. Further study is needed to pin down the inclination and understand the nature of this feeble disk (e.g. whether it is in the stage of dispersal or growing).
Most recently, Winston et al. (2009) obtained an optical
spectrum for this source, which they classified as K8 1.5.
From the HR diagram it appears a modest 0.9 , 2 Myr-old star,
which may be surprising considering the above properties.
The paradox can be resolved if the inferred luminosity
is strongly underestimated due to the edge-on viewing geometry.
Indeed, Pontoppidan & Dullemond (2005) report that they may have resolved the obscuring
central disk of SVS2(CK3) in their and -band images, and predict a 30 times larger
luminosity, though with a hotter than K assumed
by Winston’s et al. SpT.
SVS20 is the brightest IR source in the Serpens main core.
Casali et al. (1993) and Davis et al. (1999) detected it also in the sub-mm (source SMM6),
and Smith et al. (1999) and Eiroa et al. (2005) at 3.5 cm (VLA 16),
but it was not detected in
the 1.1 mm study of Enoch et al. (2007), perhaps due
to confusion in the larger beam.
However, as with SVS2, little is known about the star itself.
It is not observable in the optical, while the NIR spectrum is
almost featureless. The maximum value of was estimated by Harvey et al. (1984)
from the magnitude assuming a B8 ZAMS excess-free star.
Kaas (1999) reported variability of 0.14 magnitudes in the band within a 1 year
time span. While our band measurement is saturated,
the photometry from the literature (2MASS,
Sogawa et al. (1997), Kaas (1999)) indicates
that SVS20 is located on the diagram just outside of the
reddened CTTS locus.
Clearly, the object possesses a strong NIR excess.
Indeed, the depth of the 3.07 m ice feature indicates
considerably smaller (Eiroa & Hodapp, 1989) than is inferred
assuming excess-free colors.
Kaas et al. (2004) and Winston et al. (2007) classified SVS20 as a flat SED source, and Harvey et al. (2007b) as class I, all without an estimate. Mid-IR spectra revealed deep ice features of H2O, CO, and CO2 (Eiroa & Hodapp, 1989; Alexander et al., 2003; Pontoppidan et al., 2003, 2008). Spitzer spectrum overlaid on the SED is shown in Boogert et al. (2008). It shows silicate emission feature at 10 m characteristic of a disk, but much weaker than in SVS2 and double-peaked, which must be due to superposition with absorption. SVS20 is clearly more embedded than SVS2, but it is not clear whether it translates into an earlier evolutionary stage until the contribution from the cloud is subtracted.
The complication arises also from the fact that SVS20 is a binary (Eiroa et al., 1987). The companion SVS20B (SVS20N) is situated 1.7 (650 AU for pc) north-east from the primary. It is 1.5 mag fainter in the NIR than the primary, but becomes of comparable brightness by 13 m (Ciardi et al., 2005; Haisch et al., 2006). In the Spitzer beams the components are unresolved. Ciardi et al. (2005) modeled their ground-based resolved mid-IR observations with the following components: 1) a circumbinary envelope producing absorption bands and half of the visual extinction; 2) SVS20A: K, (for our distance), corresponding to an A – early-F YSO, with the SED slope , which places it at the Flat/class II boundary; 3) SVS20B: K, , corresponding to an M-type YSO, with characteristic of a flat-class SED. The -band spectrum of SVS20A in Doppmann et al. (2005) shows weak absorption features with a hint of emission in Br and CO; they deduced 5700 – 6100 K and , corresponding to an early-G star. The -band spectrum of SVS20B, on the other hand, reveals prominent emission in Br, NaI, and CO lines (Eiroa et al., 2006); the -band spectrum of Pontoppidan et al. (2003) in addition shows a blue-shifted emission component in CO, interpreted as an outflow. Furthermore, the cm emission matches the position of the secondary better, and Eiroa et al. (2005) speculate that it can be due to a thermal jet. Both components are X-ray emitters. The secondary thus appears in a less evolved stage than a more massive primary. Recently, Duchêne et al. (2007) detected a tertiary component in the system, with at 0.32 (120 AU) to the west of SVS20A. As seen in Fig. 3, SVS20 is surrounded by a spectacular clumpy ring of NIR emission, with a radius 10 (3800 AU). It has been speculated to represent either a circumbinary disk or walls of a bipolar cavity, but no detailed modeling has been performed yet.
Summarizing, SVS2 and SVS20 present examples of how auxiliary information
available for bright sources helps breaking degeneracies associated
with interpretation of the SEDs.
These most luminous YSOs in the cloud with class I/Flat SEDs
appear to be embedded intermediate-mass stars with disks
and perhaps circumstellar envelopes.
Lacking ionizing radiation of B stars,
they may still be capable of affecting star-formation in the cloud
through the outflows/winds, judging from
the spectroscopic signatures and the large cavities surrounding
these sources.
EC103 is another class 0/I object
with unknown stellar properties.
It is variable on the timescale of 2 days (Kaas, 1999),
is not detected in the X-rays despite being a relatively bright
IR source, and has the strongest NIR excess judging by
location on the diagram.
Figure 3 shows a chain of Herbig-Haro (HH) objects
south of EC103. Herbst et al. (1997) proposed that either class II YSO
CK8 or a deeply embedded sub-mm source SMM3 situated
10 south, are the driving sources
of jets that produce these knots of shocked gas.
An examination of our image, however, shows
an elongated blue structure emanating south from EC103
in the direction of the knots.
Our spectrum of EC103 shows a steeply rising continuum
indicating
with the Brackett series in emission,
similar to a class I object in Taurus IRAS 04239+2436 presented by Greene & Lada (1996).
It also resembles spectra of Flat / class II sources
with high accretion rates from the latter study,
like DG Tau, HL Tau, and WL 18, where one can additionally see emission
in Pa.
All three sources are known to drive jets
(Eislöffel & Mundt, 1998; Anglada et al., 2007; Gómez et al., 2003).
The high-resolution –band spectrum of EC103 in Doppmann et al. (2005)
is similar to that of SVS2 (mostly featureless with narrow H2 emission),
except for a much stronger Br emission.
On the other hand, the -band spectrum of CK8 (EC105)
from Eiroa et al. (2006) does not show any emission lines.
We therefore consider EC 103 as an interesting alternative
outflow candidate to CK8 and SMM3.
The slight apparent misalignment of the blue extension
of EC103 and the HH chain may result from the uneven illumination of the cavity,
similar to the HH92 object studied by Bally et al. (2002),
while the northern lobe can be too extincted to see.
EC117, together with EC86 and EC84,
presents a puzzling case of an apparently very young star (1 Myr)
without circumstellar material (SED class III).
It was proposed to be a YSO
based on the association with a faint cometary nebulosity
and later on the (variable) X-ray emission.
The low-resolution -band spectrum of Eiroa et al. (2006)
shows Na I, Ca I, and CO lines in absorption,
consistent with our early-M classification and with
the M0.5 1.5 type of Winston et al. (2009).
The reddening estimates in the literature are even higher than ours (13.8):
15.1 mag in Kaas et al. (2004),
18.7 mag in Winston et al. (2007),
which would make it only more luminous on the HR diagram
(indeed Winston et al. (2009) obtains (corrected to our distance) vs. ours 0.51 0.09).
Interesting, it is the third brightest
centimeter source in the central area
as revealed by VLA (Smith et al., 1999; Eiroa et al., 2005), outshining even SVS20.
Eiroa et al. (2005) speculate that the radio emission in EC117 can originate
from the stellar corona. It is unclear at present
whether strong magnetic activity and the elevated location
on the HR diagram have a common cause, such as
binarity or extreme youth.
W201 and EC77 are class III sources. W201 was selected as a YSO based purely on X-ray emission, while EC77 based on X-rays and in the earlier works on the weak NIR excess (which is not seen in FLAMINGOS or 2MASS photometry). They are likely diskless objects, as indicated by the lack of excess through Spitzer 3 – 8 m bands, and hence were not included in the YSO list of Harvey et al. (2007b). EC77 is adjacent to the SVS4 mini-cluster, while W201 is situated further south in the area of lower extinction. Indeed, we obtain for EC77 (which compares well to 3.2 mag of Winston et al. (2007)), while for W201 we obtain smaller .
Winston et al. (2009) obtained a similar SpT to ours for W201 (M5 1) and later, but much more uncertain, for EC77 (M8.5 5.0 vs. our M5.1 0.4). The distance-corrected of Winston et al. (2009) -1.27 for W201 and -1.54 for EC77 are comparable with ours: -1.12 0.07 and -1.35 0.07 respectively. What effect would the later SpT of EC77 have on its SED? Using SpT of Winston et al. (2009), we obtain and a 2600 K for the photospheric model, compared with ours 4.5 and 3100 K. We obtain an equally good SED fit with these new parameters as with ours. This is because the cooler photospheric model is compensated by a smaller de-reddening. According to our HR diagram, the two stars represent 0.2 stars 3 – 5 Myr old. The lack of the circumstellar material is therefore not surprising, as majority of stars dissipate their optically-thick disks by this age (e.g., Hernández et al., 2008). Less certain type of Winston et al. (2009), on the other hand, would make EC77 much younger, 1 Myr.
Stars 19 and 28 are the only M dwarfs in our spectroscopic sample that have not been previously reported as cloud members. They do not posses IR excess and are not detected in the X-rays, but the latter can be due to low luminosities. On the HR diagram they are markedly older than the other Serpens YSOs, source 28 would be 30 Myr-old, while source 19 would be 10 – 15 Myr-old according to the BCAH98 tracks. The two sources are located next to the candidate YSO W201 (and the massive class III binary HD 170545), therefore one can expect them to have similar reddening if they belong to the cloud. For W201 we obtained , and similar value for source 19: , while for source 28 it is only . Using theoretical luminosities of field dwarfs from BCAH98 and empirical from Leggett (1992); Leggett et al. (2000), and considering the diagram in Straižys et al. (2003) (except for “sub-area A” where distances may be underestimated), we conclude that star 28 could be easily explained as a forground dwarf at distances 250 – 300 pc. Star 19, on the other hand, is more difficult to explain as an interloper. Even if it is as far as 230 pc, corresponding to the luminosity of a “young disk” population, is quite rare there. We conclude that star 19 remains a valid candidate for a 10 – 20 Myr-old 0.1 cloud member, to be confirmed with more methods.
EC84 is a peculiar object in two respects. Together with EC86 its location on the diagram is too blue for its mid-M SpT, while IRAC fluxes fall below model SED. According to Pontoppidan et al. (2004), it could be a K5 dwarf (SVS4-4) with 19.0, or a K giant with 17.5 – 16. Both explanations would contradict our spectra as we do not see lines characteristic for K stars in the band, while the giant explanation in addition would be inconsistent with the X-ray emission from these sources (Haisch et al., 1992). We note that Eiroa et al. (2006) show a low-resolution band spectrum of EC84 with Na I and CO lines in absorption, with strengths consistent with an M-type classification.
It is also extremely bright/young on the HR diagram for a source with little to no IR excess. According to Flamingos, 2MASS, and photometry of Eiroa & Casali (1992), it does not have a NIR excess and was originally identified as a YSO based on polarization and association with the SVS4 group of YSOs (Sogawa et al., 1997). It appears to have a weak excess beyond 8 m. Kaas et al. (2004) and Winston et al. (2007) classified it as class II object, while Harvey et al. (2007b) did not identify it as a YSO at all. The long-wavelength fluxes are not reliable because of the proximity to the bright proto-stellar EC92/95 system. If excess is confirmed, it would be the thinnest disk in our survey, perhaps even of a debris nature. Other researches obtained similarly high values of and (distance-corrected) (Kaas et al., 2004; Winston et al., 2007, 2009). The membership in the cloud for this object is essentially based on the the fact that it is an X-ray emitter, and in addition a strong 3.5 cm source, similar to another “over-luminous” class III source EC117. Leggett et al. (2006) cites N. Cross and M. Connelley (private communication) that EC84 is a possible binary, although decreasing luminosity by 0.30 dex would still make it appear exceptionally young on the HR diagram.
The best explanation for the SED discrepancy would be an intermediate M3 1.5 type of Winston et al. (2009), that provides a good fit to fluxes up to 6 m with a purely photospheric emission reddened by . The new SpT also moves EC84 below the birthline on the HR diagram, but it still appears very young. It remains a puzzle why it lost its optically-thick disk at an age 0.1 Myr.
EC86 is another example of a 1 Myr-old star without circumstellar material. It was selected as a YSO based on proximity to SVS2, the ice feature (, Eiroa & Casali (1992)), and X-rays. Similar to EC84, our SpT-based is too large to be compatible with the SED, and so is of Winston et al. (2007). We are convinced that the star is of M type even though the spectrum was observed at the edge of the array and continuum in the J band is affected by a cross-talk depression. If it were a K-type star we should have seen absorption lines in the band, since veiling is excluded due to lack of the NIR excess (as seen from the location on the diagram).
Winston et al. (2009) classified it as M2 1.5 from the NIR spectrum (their late-M optical type should be discarded due to low S/N, according to the private communication with E. Winston). This early-M type with provides a very good fit for the observed SED. The object remains 1 Myr on the HR diagram. It maybe that the wind from the nearby SVS2 played a role in the early dispersion of disk around EC86.
Star 26 is a potential intermediate mass cluster member, since on the HR diagram the errorbars allow it to be younger than 3 Myr. However, the Spitzer fluxes could not be fit with the and inferred from our SpT and the assumption of dwarf colors. The G dwarf classification is based on the enhanced Si I 1.59 line compared to the neighboring Mg I. By looking at Figure 5 of Ivanov et al. (2004), however, we see that similar spectra are observed in the metal-poor K giants. If this star is a background giant, it will explain the smaller required to fit the SED and the lack of X-rays. Thus in the present study we do not consider it a cluster member. The example of source 26 and the lack of definite G – K members in our sample shows how challenging is the identification of the intermediate-mass members in young clusters near the galactic plane.
References
- Alexander et al. (2003) Alexander, R. D. et al. 2003, A&A, 401, 613
- Allen et al. (2007) Allen, L., et al. 2007, in “Protostars and Planets V”, B. Reipurth, D. Jewitt, and K. Keil (eds.), University of Arizona Press, Tucson, p.361
- Allers et al. (2007) Allers, K. N., et al. 2007, ApJ, 657, 511
- Andersen et al. (2008) Andersen, M., Meyer, M. R., Greissl, J., & Aversa, A. 2008, ApJ, 683, L183
- Anglada et al. (2007) Anglada, G., et al. 2007, AJ, 133, 2799
- Aspin et al. (1994) Aspin, C., Reipurth, B., & Lehmann, T. 1994, A&A, 288, 165
- Bally & Lada (1983) Bally, J. & Lada, C. 1983, ApJ, 265, 824
- Bally et al. (2002) Bally, J., Reipurth, B., & Aspin, C. 2002, ApJ, 574, L79
- Balog et al. (2006) Balog, Z., Rieke, G. H., Su, Kate Y. L., Muzerolle, J., & Young, E. T. 2006, ApJ, 650, L83
- Baraffe et al. (1998) Baraffe, I., Chabrier, G., Allard, F.,& Hauschildt, P. H. 1998, A&A, 337, 403
- Bate et al. (2003) Bate, M. R., Bonnell, I. A., & Bromm, V. 2003, MNRAS, 339, 577
- Beck (2007) Beck, T. L. 2007, AJ, 133, 1673
- Bertout et al. (2007) Bertout, C., Siess, L., & Cabrit, S. 2007, A&A, 473, L21
- Bessell & Brett (1988) Bessell, M. S. & Brett, J. M. 1988, PASP, 100, 1134
- Brooke et al. (19990) Brooke, T. Y., Sellgren, K., & Geballe, T. R. 1999, ApJ, 517, 883
- Boogert et al. (2008) Boogert, A. C. A., et al. 2008, ApJ, 678, 985
- Bowman et al. (2006) Bouwman, J. et al. 2006, ApJ, 653, L57
- Cambrésy (1999) Cambrésy, L. 1999, A&A, 345, 965
- Carpenter (2006) Carpenter, J. M., Mamajek, E. E., Hillenbrand, L. A., & Meyer, M. R. 2006, ApJ, 651, L49
- Casali & Eiroa (1996) Casali, M. M. & Eiroa, C. 1996, A&A, 306, 427
- Casali et al. (1993) Casali, M. M., Eiroa, C., & Duncan, W. D. 1993, A&A, 275, 195
- Chabrier et al. (2000) Chabrier, G., Baraffe, I., Allard, F., & Hauschildt, P. 2000, ApJ, 542, 464
- Chavarria-K et al. (1988) Chavarria-K., C., et al. 1988, A&A, 197, 151
- Chiar et al. (1994) Chiar, J. E., Adamson, A. J., Kerr, T. H., & Whittet, D. C. B. 1994, ApJ, 426, 240
- Chiar (1997) Chiar, J. 1997, “The Nature and Evolution of Interstellar Ices: Studies of Methanol and Carbon Monoxide”, PhD thesis, Rensselaer Polytechnic Institute, NY
- Churchwell & Koornneef (1986) Churchwell, E., & Koornneef, J. 1986, ApJ, 300, 729
- Ciardi et al. (2005) Ciardi, D. R., et al. 2005, ApJ, 629, 897
- Cieza et al. (2005) Cieza, L., et al. 2005, ApJ, 635, 422
- Cieza et al. (2007) Cieza, L., et al. 2007, ApJ, 667, 308
- Cohen & Kuhi (1979) Cohen, M. & Kuhi, L. V. 1979, ApJS, 41, 743
- Cohen et al. (1981) Cohen, J. G., Persson, S. E., Elias, J. H., & Frogel, J. A. 1981, ApJ, 249, 481
- Crapsi et al. (2008) Crapsi, A., et al. 2008, A&A, 486, 245
- Crawford (1978) Crawford, D. L. 1978, AJ, 83, 48
- Cushing et al. (2005) Cushing, M. C., Rayner, J. T., & Vacca, W. D. 2005, ApJ, 623, 1115
- D’Alessio et al. (1999) D’Alessio, P., Calvet, N., Hartmann, L., Lizano, S., & Cantó, J. 1999, ApJ, 527, 893
- Dame et al. (2001) Dame, T. M., Hartmann, D., & Thaddeus, P. 2001, ApJ, 547, 792
- D’Antona & Mazzitelli (1997) D’Antona, F. and Mazzitelli, I. 1997, ‘Evolution of low mass stars’ in “Cool stars in Clusters and Associations”, eds. R. Pallavicini & G. Micela, Mem.S.A.It., 68, 807
- Davis et al. (1999) Davis, C. J., et al. 1999, MNRAS, 309, 141
- de Lara et al. (1991) de Lara, E., Chavarria-K, C., & López-Molina, G. 1991, A&A, 243, 139
- Djupvik et al. (2006) Djupvik, A. A., et al. 2006, A&A, 458, 789
- Doppmann et al. (2005) Doppmann, G. W., Greene, T. P., Covey, K. R., & Lada, C. J. 2005, AJ, 130, 1145
- Doppmann et al. (2008) Doppmann, G. W., Najita, J. R., & Carr, J. S. 2008, ApJ, 685, 298
- Duchêne et al. (2007) Duchêne, G., Bontemps, S., Bouvier, J., André, P., Djupvik, A. A., & Ghez, A. M. 2007, A&A, 476, 229
- Eiroa et al. (1987) Eiroa, C., Lenzen, R., Leinert, Ch., & Hodapp, K.-W. 1987, A&A, 179, 171
- Eiroa & Hodapp (1989) Eiroa, C. & Hodapp, K.-W. 1989, A&A, 210, 345
- Eiroa & Casali (1992) Eiroa, C. & Casali, M. M. 1992, A&A, 262, 468
- Eiroa et al. (2005) Eiroa, C., Torrelles, J. M., Curiel, S., & Djupvik, A. A. 2005, AJ, 130, 643
- Eiroa et al. (2006) Eiroa, C., Djukvip, A. A., & Casali, M. M. 2006, Astron. Nachr., 327, 14
- Eislöffel & Mundt (1998) Eislöffel, J. & Mundt, R. 1998, AJ, 115, 1554
- Elston et al. (2003) Elston, R., et al. 2003, SPIE, 4841, 1611
- Enoch et al. (2007) Enoch, M. L., et al. 2007, ApJ, 666, 982
- Enoch et al. (2008) Enoch, M. L., et al. 2008, ApJ, 684, 1240
- Flaherty & Muzerolle (2008) Flaherty, K. M. & Muzerolle, J. 2008, AJ, 135, 966
- Furlan et al. (2006) Furlan, E., et al. 2006, ApJS, 165, 568
- Gaalfalk & Olofsson (2008) Gaalfalk, M. & Olofsson, G. 2008, A&A, 489, 1409
- Giardino et al. (2007) Giardino, G., Favata, F., Micela, G., Sciortino, S., & Winston, E. 2007, A&A, 463, 275
- Giovannetti et al. (1998) Giovannetti, P., Caux, E., Nadeau, D., & Monin, J.-L. 1998, A&A, 330, 990
- Gomez de Castro (1997) Gomez de Castro, A. I. 1997, A&A, 323, 541
- Gómez et al. (2003) Gómez, M., Stark, D. P., Whitney, B. A., & Churchwell, E. 2003, AJ, 126, 863
- Gorlova et al. (2003) Gorlova, N. I., Meyer, M. R., Rieke, G. H., & Liebert, J. 2003, ApJ, 593, 1074
- Greene & Lada (1996) Greene, T. P. & Lada, C. J. 1996, AJ, 112, 2184
- Gutermuth et al. (2008) Gutermuth, R. A., et al. 2008, ApJ, 673, L151
- Haisch et al. (1992) Haisch, B., Schmitt, J. H. M. M., & Fabian, A. C. 1992, Nature, 360, 239
- Haisch et al. (2001a) Haisch, K. E., Lada, E. A., & Lada, C. J. 2001, AJ, 121, 2065
- Haisch et al. (2001b) Haisch, K. E., Lada, E. A., & Lada, C. J. 2001, ApJ, 553, L153
- Haisch at al. (2002) Haisch, K. E., Barsony, M., Greene, T. P., & Ressler, M. E. 2002, AJ, 124, 2841
- Haisch at al. (2004) Haisch, K. E., Greene, T. P., Barsony, M., & Stahler, S. W. 2004, AJ, 127, 1747
- Haisch et al. (2006) Haisch, K. E., Barsony, M., Ressler, M. E., & Greene, T. P. 2006, AJ, 132, 2675
- Harvey et al. (2007a) Harvey, P., et al. 2007a, ApJ, 663, 1139
- Harvey et al. (2007b) Harvey, P., et al. 2007b, ApJ, 663, 1149
- Harvey et al. (1984) Harvey, P. M., Wilking, B. A., & Joy, M. 1984, ApJ, 278, 156
- Harvey et al. (2006) Harvey, P. M., et al. 2006, ApJ, 644, 307
- Hauschildt et al. (1999a) Hauschildt, P. H., Allard, F., & Baron, E. 1999, ApJ, 512, 377
- Hauschildt al. (1999b) Hauschildt, P. H., et al. 1999, ApJ, 525, 871
- Herbst et al. (1997) Herbst, T. M., Beckwith, S. V. W., & Robberto, M. 1997, ApJ, 486, L59
- Hernández et al. (2005) Hernandez, J. et al. 2005, AJ, 129, 856
- Hernández et al. (2008) Hernandez, J. et al. 2008, ApJ, 686, 1195
- Hillenbrand et al. (1992) Hillenbrand, L. A., Strom, S. E., Vrba, F. J., & Keene, J. 1992, ApJ, 397, 613
- Hillenbrand (2005) Hillenbrand, L. A. 2005, in ”A Decade of Discovery: Planets Around Other Stars”, STScI Symposium Series 19, ed. M. Livio (Baltimore, MD: STScI), astro-ph/0511083
- Hillenbrand et al. (2008) Hillenbrand, L. A., Bauermeister, A., & White, R. J. 2008, in “14th Cambridge Workshop on Cool Stars, Stellar Systems, and the Sun”, ASP Conference Series, ed. G. van Belle, Vol. 384, p. 200 (astro-ph/0703642)
- Hogerheijde et al. (1999) Hogerheijde, M. R., van Dishoeck, E. F., Salverda, J. M., & Blake, G. A. 1999, ApJ, 513, 350
- Hollenbach et al. (1994) Hollenbach, D., Johnstone, D., Lizano, S., & Shu, F. 1994, ApJ, 428, 654
- Houk & Swift (1999) Houk N., & Swift C. 1999, Michigan Catalogue of Two-Dimensional Spectral Types for the HD stars, Vol. 5 (Vizier on-line catalog III/214; Ann Arbor, MI: Dept. of Astronomy, Univ. Michigan)
- Huard et al. (1997) Huard, T. L., Weintraub, D. A., & Kastner, J. H. 1997, MNRAS, 290, 598
- Ikeda et al. (2008) Ikeda, H. et al., 2008, AJ, 135, 2323
- Ivanov et al. (2004) Ivanov, V. D., et al. 2004, ApJS, 151, 387
- Kaas (1999) Kaas, A. A. 1999, AJ, 118, 558
- Kaas et al. (2004) Kaas, A. A., et al. 2004, A&A, 421, 623
- Kenyon & Hartmann (1995) Kenyon, S. J. & Hartmann, L. 1995, ApJS, 101, 117
- Kessler-Silacci et al. (2006) Kessler-Silacci, J., et al. 2006, ApJ, 639, 275
- Koenig et al. (2008) Koenig, X. P., 2008, ApJ, 688, 1142
- Kurucz (1979) Kurucz, R. L. 1979, ApJS, 40, 1
- Kwan et al. (2007) Kwan, J., Edwards, S., & Fischer, W. 2007, ApJ, 657, 897
- Lada & Lada (2003) Lada, C. J. & Lada, E. A. 2003, ARA&A, 41, 57
- Lada et al. (2006) Lada, C. J. et al. 2006, AJ, 131, 1574
- Lahuis et al. (2007) Lahuis, F. et al. 2007, ApJ, 665, 492
- Lancon & Wood (2000) Lancon, A. & Wood, P. R. 2000, A&AS, 146, 217
- Lee & Chen (2007) Lee, H.-T. & Chen, W. P. 2007, ApJ, 657, 884
- Leggett (1992) Leggett, S. K. 1992, ApJS, 82, 351
- Leggett et al. (1996) Leggett, S. K., et al. 1996, ApJS, 104, 117
- Leggett et al. (2001) Leggett, S. K., et al. 2001, ApJ, 548, 908
- Leggett et al. (2000) Leggett, S. K., et al. 2000, 535, 965
- Leggett et al. (2006) Leggett, S. K., et al. 2006, MNRAS, 373, 781
- Levine (2006) Levine, J. L. 2006, PhD thesis, Univ. Florida
- Levine et al. (2006) Levine, J. L., Steinhauer, A., Elston, R. J., & Lada, E. A. 2006, ApJ, 646, 1215
- Little et al. (1980) Little, L. T., Brown, A. T., MacDonald, G. H., Riley, P. W., & Matheson, D. N. 1980, MNRAS, 193, 115
- Liu et al. (2003) Liu, M. C., Najita, J., & Tokunaga, A. T. 2003, ApJ, 585, 372
- Lodieu et al. (2002) Lodieu, N., Caux, E., Monin, J.-L., & Klotz, A. 2002, A&A, 383, L15
- Lucas et al. (2001) Lucas, P. W., Roche, P. F., Allard, F., & Hauschildt, P. H. 2001, MNRAS, 326, 695
- Luhman (1999) Luhman, K. L. 1999, ApJ, 525, 466
- Luhman (2007) Luhman, K. L. 2007, ApJS, 173, 104
- Luhman et al. (2003) Luhman, K. L., et al. 2003, ApJ, 593, 1093
- Luhman et al. (2005) Luhman, K. L., Lada, E. A., Muench, A. A., & Elston, R. J. 2005, ApJ, 618, 810
- Luhman et al. (2007) Luhman, K. L. et al. 2007, ApJ, 659, 1629
- Mathis (1990) Mathis, J. S. 1990, ARA&A, 28, 37
- McGovern et al. (2004) McGovern, M. R., et al. 2004, ApJ, 600, 1020
- Meyer et al. (1997) Meyer, M. R., Calvet, N., & Hillenbrand, L. A. 1997, AJ, 114, 288
- Meyer et al. (1998) Meyer, M. R., Edwards, S., Hinkle, K. H., & Strom, S. E. 1998, ApJ, 508, 397
- Muench et al. (2003) Muench, A. A., et al. 2003, AJ, 125, 2029
- Muench et al. (2007) Muench, A. A., Lada, C. J., Luhman, K. L., Muzerolle, J.,& Young, E. 2007, AJ, 134, 411
- Muzerolle et al. (1998) Muzerolle, J., Hartmann, L., & Calvet, N. 1998, AJ, 116, 2965
- Muzerolle et al. (2006) Muzerolle, J., et al. 2006, ApJ, 643, 1003
- Nordh et al. (1982) Nordh, H. L., et al. 1982, A&A, 115, 308
- Olczak et al. (2006) Olczak, C., Pfalzner, S., & Spurzem, R. 2006, ApJ, 642, 1140
- Oliveira et al. (2009) Oliveira, I., et al. 2009, ApJ, 691, 672
- Origlia et al. (1993) Origlia, L., Moorwood, A. F. M., & Oliva, E. 1993, A&A, 280, 536
- Perrin et al. (1998) Perrin, G., et al. 1998, A&A, 331, 619
- Pontoppidan et al. (2003) Pontoppidan, K. M., et al. 2003, A&A, 408, 981
- Pontoppidan et al. (2004) Pontoppidan, K. M., van Dishoeck, E. F., & Dartois, E. 2004, A&A, 426, 925
- Pontoppidan & Dullemond (2005) Pontoppidan, K. M. & Dullemond, C. P. 2005, A&A, 435, 595
- Pontoppidan et al. (2007a) Pontoppidan, K. M., et al. 2007a, ApJ, 656, 991
- Pontoppidan et al. (2007b) Pontoppidan, K. M., et al. 2007b, ApJ, 656, 980
- Pontoppidan et al. (2008) Pontoppidan, K. M., et al. 2008, ApJ, 678, 1005
- Preibisch (2004) Preibisch, T. 2004, A&A, 428, 569
- Preibisch et al. (2005) Preibisch, T., et al. 2005, ApJS, 160, 401
- Quillen et al. (2004) Quillen, A. C., Blackman, E. G., Frank, A., & Varniére, P. 2004, ApJ, 612, L137
- Reach et al. (2009) Reach, W. T., et al. 2009, ApJ, 690, 683
- C. Román-Zúñiga (2006) Román-Zúñiga, C. G. 2006, Ph.D. thesis, Univ. Florida
- Román-Zúñiga et al. (2008) Román-Zúñiga, C., Elston, R., Ferreira, B., & Lada, E. 2008, ApJ, 672, 861
- Sandell & Knee (2001) Sandell, G., & Knee, L. B. G. 2001, ApJ, 546, L49
- Shimajiri et al. (2008) Shimajiri, Y. et al. 2008, ApJ, 683, 255
- Schmidt-Kaler (1982) Schmidt-Kaler, Th. 1982, in Landolt-Bornstein: Numerical Data and Functional Relationships in Science and Technology, eds Schaifers, K., Voigt, H.-H. (Springer: Berlin), Vol. 2b,
- Siess et al. (2000) Siess L., Dufour E., Forestini M. 2000, A&A, 358, 593
- Smith et al. (1999) Smith, K., Güdel, M., & Benz, A. O. 1999, A&A, 349, 475
- Sogawa et al. (1997) Sogawa, H., Tamura, M., Gatley, I., & Merrill, K. M. 1997, AJ, 113, 1057
- Stark et al. (2007) Stark, D. P., Whitney, B. A., Stassun, K., & Wood, K. 2006, ApJ, 649, 900
- Straižys et al. (1982) Straižys, V., Kuriliene, G., & Jodinskiene, E. 1982, Vilnius Astronomijos Observatorijos Biuletenis, 60, 3
- Straižys et al. (1996) Straižys, V., Černis, K., & Bartašiũtė, S. 1996, Baltic Astronomy, 5, 125
- Straižys et al. (2002) Straižys, V., Bartašiũtė, S., & Černis, K. 2002, Baltic Astronomy, 11, 417
- Straižys et al. (2003) Straižys, V., Černis, K., & Bartašiũtė, S. 2003, A&A, 405, 585
- Strom et al. (1974) Strom, S. E., Grasdalen, G. L., & Strom, K. M. 1974, ApJ, 191, 111
- Strom et al. (1976) Strom, S. E., Vrba, F. J., & Strom, K. M. 1976, AJ, 81, 638
- Ungerechts & Guesten (1984) Ungerechts, H. & Guesten, R. 1984, A&A, 131, 177
- Warren-Smith et al. (1987) Warren-Smith, R. F., Draper, P. W., & Scarrott, S. M. 1987, MNRAS, 227, 749
- White et al. (1995) White, G. J., Casali, M. M., & Eiroa, C. 1995, A&A, 298, 594
- White & Hillenbrand (2004) White, R. J. & Hillenbrand, L. A. 2004, ApJ, 616, 998
- Wilking et al. (1999) Wilking, B. A., Greene, T. P., & Meyer, M. R. 1999, AJ, 117, 469
- Wilking et al. (2008) Wilking, B. A. et al. 2008, BAAS, 212, 801
- Winston et al. (2007) Winston, E. et al. 2007, ApJ, 669, 493
- Winston et al. (2009) Winston, E. et al. 2009, AJ, 137, 4777
- Wolfire & Churchwell (1987) Wolfire, M. G. & Churchwell, E. 1987, ApJ, 315, 315
- Worden & Grasdalen (1974) Worden, S. P. & Grasdalen, G. L. 1974, A&A, 34, 37
- Zhang et al. (1988b) Zhang, C. Y., Laureijs, R. J., & Clark, F. O. 1988b, A&A, 196, 236
- Zhang et al. (1988a) Zhang, C. Y., Laureijs, R. J., Wesselius, P. R., & Clark, F. O., 1988a, A&A, 199, 170
- Ziener & Eislöffel (1999) Ziener R. & Eislöffel, J. 1999, A&A, 347, 565
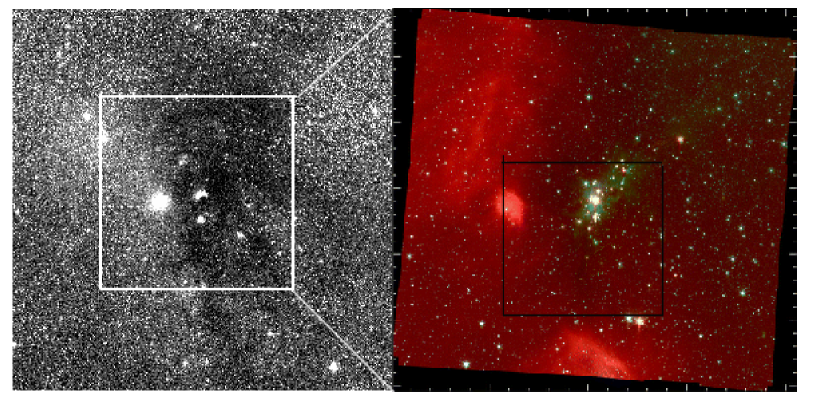
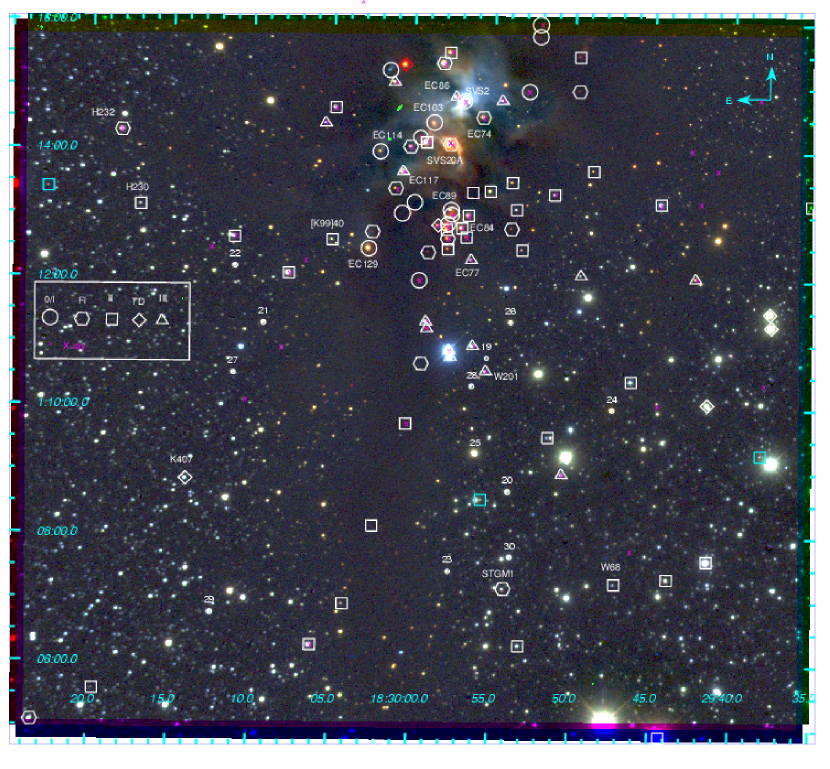
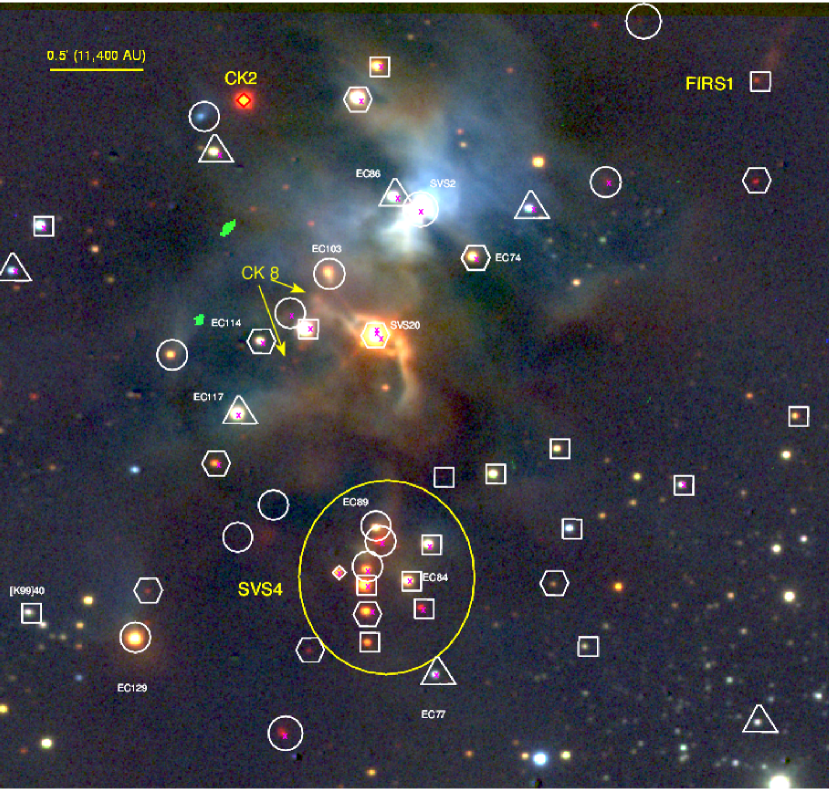
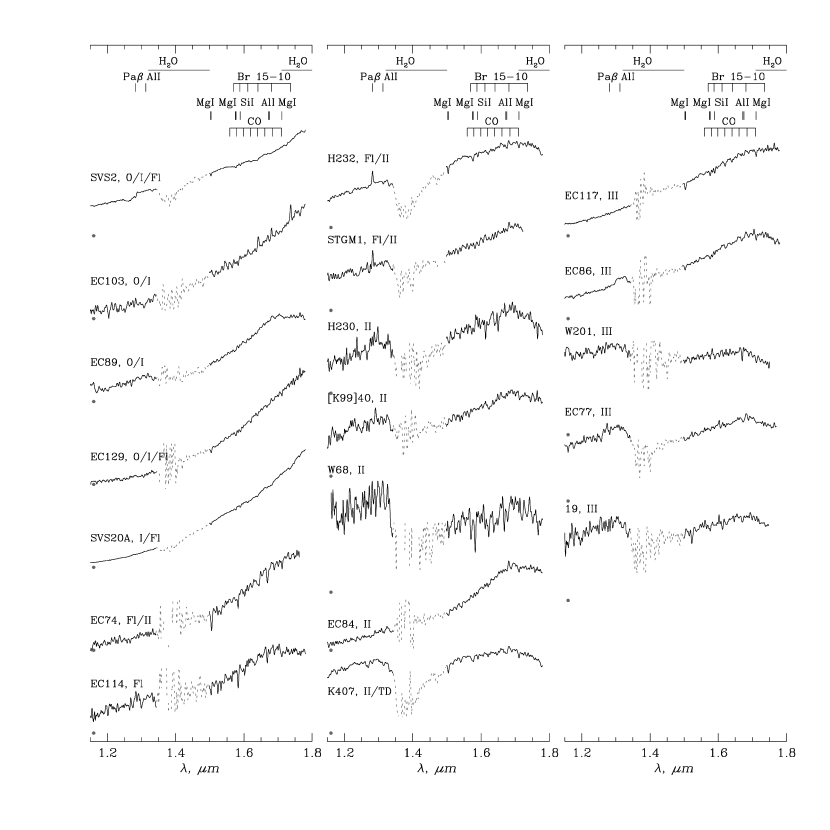
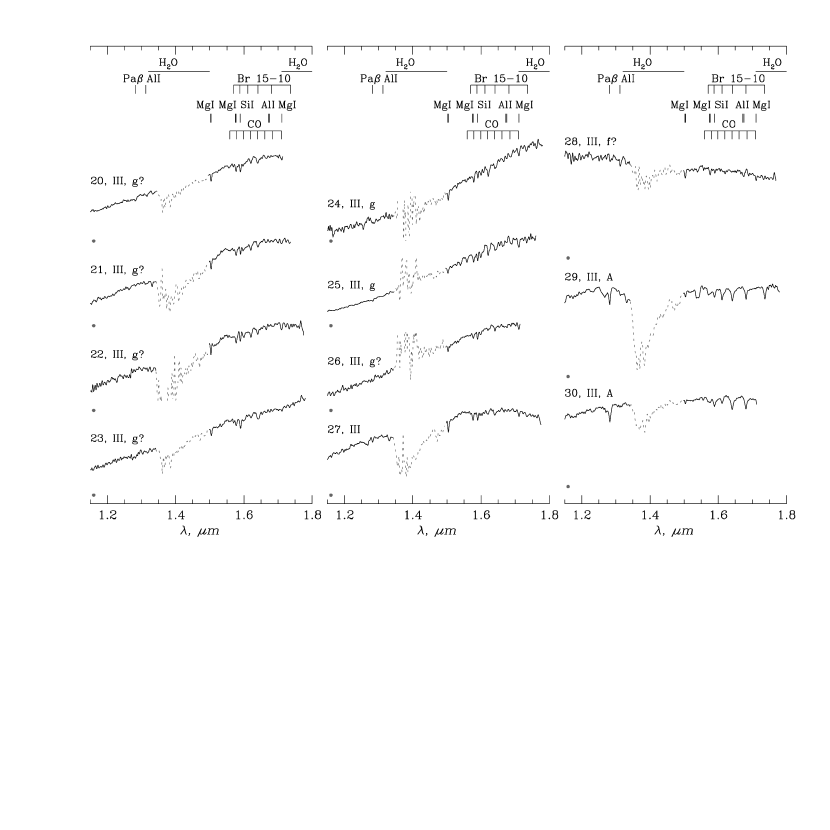


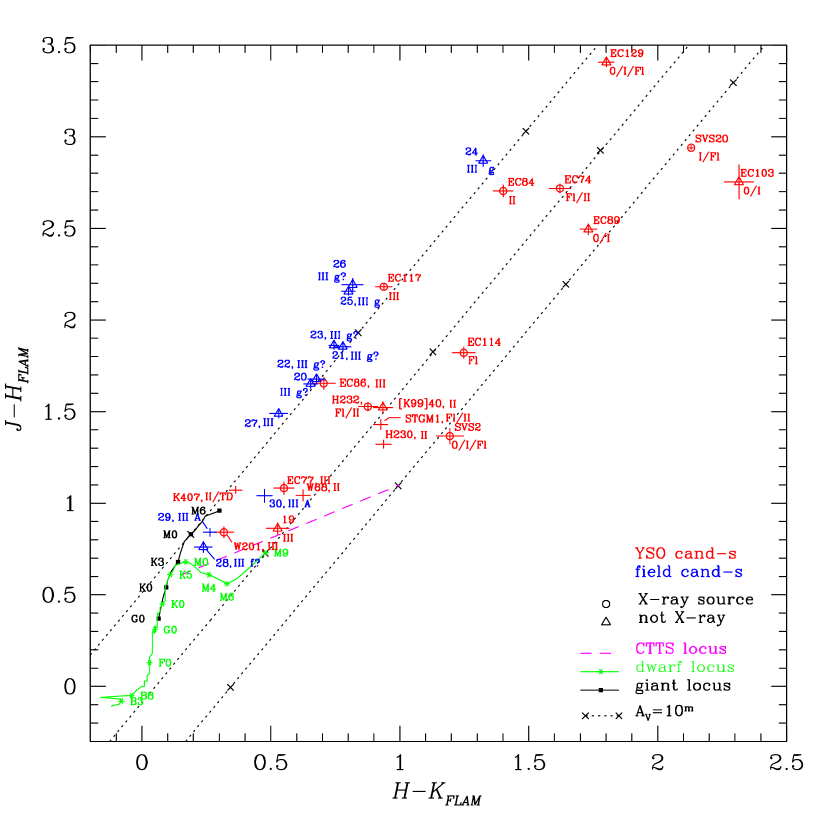
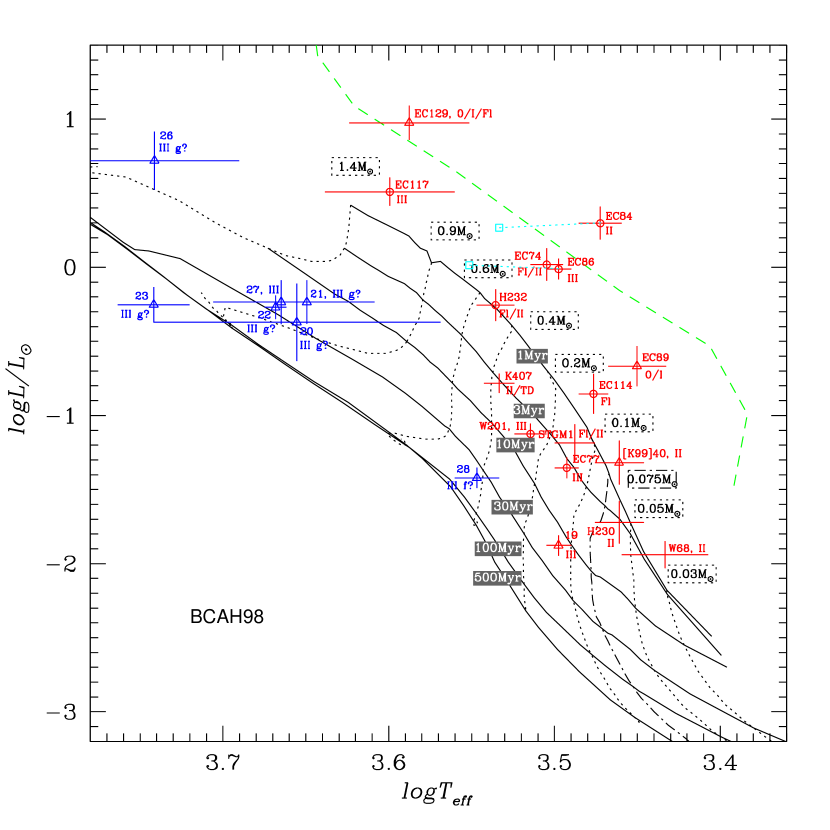
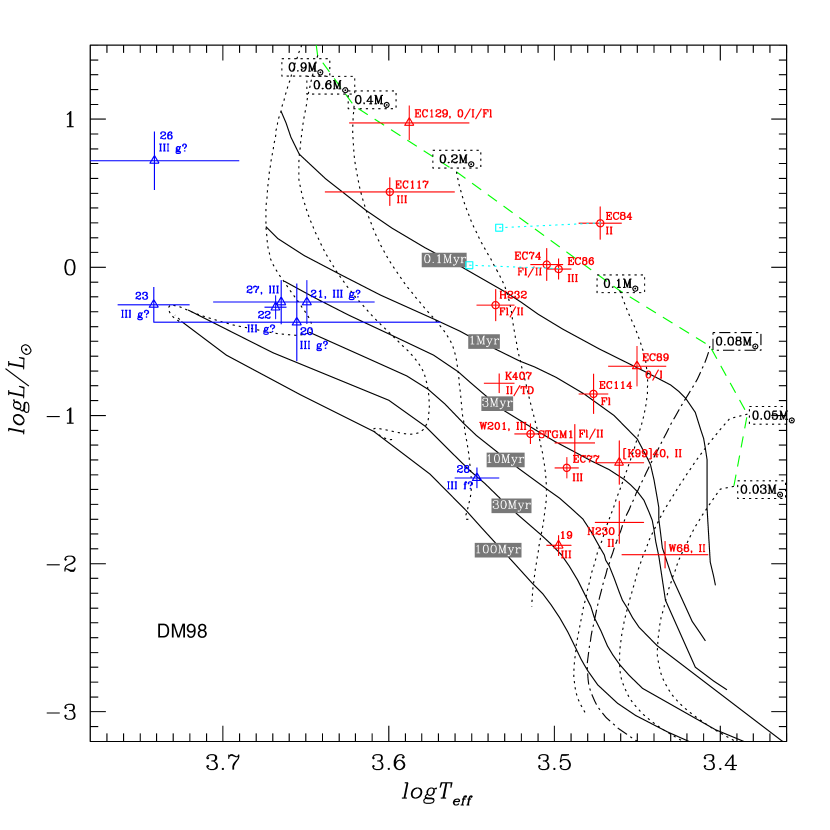
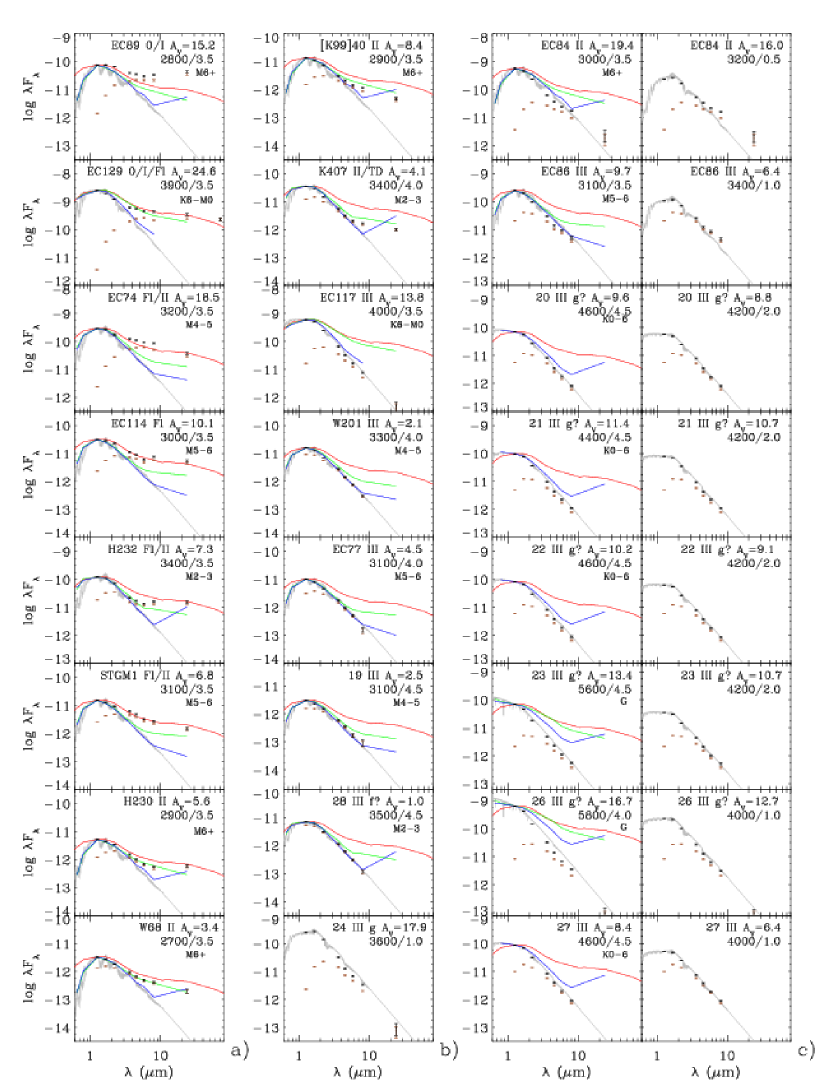
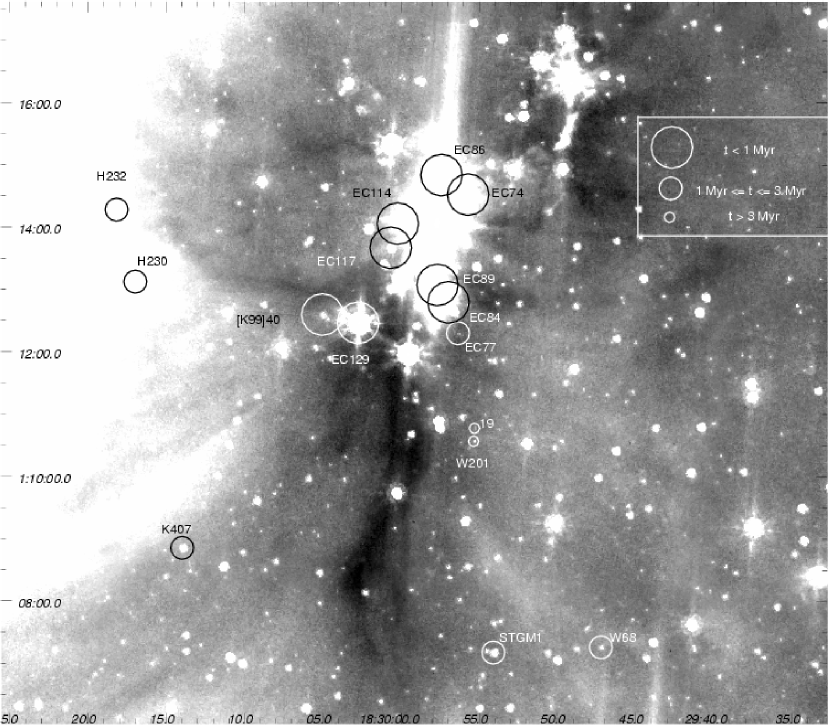
| ID | SED | Namea,ba,bfootnotemark: | SpTccThis work. | RA(2000) | DEC(2000) | JccThis work. | HccThis work. | KccThis work. |
|---|---|---|---|---|---|---|---|---|
| hr:min:s | mag | mag | mag | |||||
| 1 | 0/I/Fl | SVS2 | 18:29:56.89 | +01:14:46.46 | 11.93 0.02 | 10.57 0.04 | 9.37 0.04 | |
| 2 | 0/I | EC103 | 18:29:58.78 | +01:14:26.09 | 16.75 0.08 | 14.00 0.05 | 11.68 0.03 | |
| 3 | 0/I | EC89 | M7.25 0.75 | 18:29:57.67 | +01:13:04.57 | 16.16 0.02 | 13.67 0.02 | 11.93 0.03 |
| 4 | 0/I/Fl | EC129 | K9 3 | 18:30:02.75 | +01:12:27.94 | 15.14 0.02 | 11.73 0.02 | 9.93 0.02 |
| 5 | I/Fl | SVS20A | 18:29:57.73 | +01:14:05.51 | 12.51 0.02 | 10.05 0.06 | ||
| 6 | Fl/II | EC74 | M4.5 0.5 | 18:29:55.71 | +01:14:31.56 | 15.56 0.02 | 12.84 0.02 | 11.22 0.04 |
| 7 | Fl | EC114 | M6 0.5 | 18:30:00.21 | +01:14:03.57 | 15.59 0.02 | 13.77 0.02 | 12.53 0.04 |
| 8 | Fl/II | H232 | M2.9 0.6 | 18:30:18.18 | +01:14:16.79 | 13.34 0.01 | 11.81 0.02 | 10.94 0.03 |
| 9 | Fl/II | STGM1 | M5.4 0.6 | 18:29:54.10 | +01:07:10.66 | 15.48 0.02 | 14.05 0.02 | 13.13 0.02 |
| 10 | II | H230 | M6.75 0.75 | 18:30:16.99 | +01:13:07.44 | 16.33 0.02 | 15.01 0.02 | 14.07 0.03 |
| 11 | II | K9940 | M6.75 0.75 | 18:30:05.03 | +01:12:35.95 | 16.06 0.02 | 14.54 0.02 | 13.60 0.03 |
| 12 | II | W68 | M7.75 0.75 | 18:29:47.22 | +01:07:15.75 | 16.21 0.03 | 15.16 0.02 | 14.54 0.02 |
| 13 | II | EC84 | M6.25 0.75 | 18:29:56.97 | +01:12:47.76 | 15.11 0.03 | 12.41 0.02 | 11.00 0.03 |
| 14 | II/TD | K407 | M3 0.5 | 18:30:13.99 | +01:08:51.16 | 13.80 0.01 | 12.73 0.01 | 12.37 0.02 |
| 15 | III | EC117 | K8.25 3.25 | 18:30:00.66 | +01:13:40.35 | 13.44 0.01 | 11.26 0.02 | 10.32 0.03 |
| 16 | III | EC86 | M4.9 0.4 | 18:29:57.41 | +01:14:50.34 | 13.26 0.02 | 11.61 0.03 | 10.91 0.04 |
| 17 | III | W201 | M4 0.5 | 18:29:55.36 | +01:10:33.92 | 14.11 0.02 | 13.27 0.02 | 12.95 0.03 |
| 18 | III | EC77 | M5.1 0.4 | 18:29:56.36 | +01:12:18.08 | 15.26 0.03 | 14.17 0.02 | 13.62 0.03 |
| 19 | III | 19 | M4.9 0.4 | 18:29:55.31 | +01:10:46.57 | 16.02 0.02 | 15.16 0.02 | 14.63 0.04 |
| ID | Namea,ba,bfootnotemark: | Other NamesbbCoKu: Cohen & Kuhi (1979); EC: Eiroa & Casali (1992); G: Chandra ID of Giardino et al. (2007); GCNM: Giovannetti et al. (1998); H: Spitzer ID of Harvey et al. (2007b); [K99]: Kaas (1999) (Table 5); K: ISO ID of Kaas et al. (2004); NIRS, STGM: Sogawa et al. (1997) (Tables 1 and 2 respectively); SVS: Strom et al. (1976); W: Spitzer ID of Winston et al. (2007). | c2d NameddCores to Disks Spitzer Legacy catalogue. | Mask-Slit |
|---|---|---|---|---|
| 1 | SVS2 | EC82 NIRS4 STGM22 CoKu-Ser/G7 | J182956.9+011447 | m2-02 |
| GCNM87 K307 H176 W9 G43 | ||||
| 2 | EC103 | STGM20 GCNM112 K326 H190 W4 | J182958.8+011426 | m2-03 |
| 3 | EC89 | STGM13 GCNM97 H181 W12 | J182957.7+011306 | m2-08 |
| 4 | EC129 | NIRS10 STGM10 GCNM160 K347 | J183002.7+011228 | m3-10 |
| H208 W10 | ||||
| 5 | SVS20A | EC90 NIRS5 STGM18 GCNM98 | J182957.7+011406 | m2-04 |
| K314 H182 W35 G48 | ||||
| 6 | EC74 | STGM21 GCNM76 K298 H171 | J182955.7+011432 | m3-03 |
| W38 G37 | ||||
| 7 | EC114 | STGM17 GCNM131 H200 W28 G62 | J183000.2+011404 | m3-05 |
| 8 | H232 | W40 G83 | J183018.2+011417 | m1-05 |
| 9 | STGM1 | K287 H164 W39 | J182954.1+010711 | m2-34 |
| 10 | H230 | W76 | J183017.0+011308 | m1-07 |
| 11 | K9940 | EC152 H216 W54 | J183005.0+011236 | m2-10 |
| 12 | W68 | - | J182947.2+010716 | m4-33 |
| 13 | EC84 | NIRS3 STGM11 GCNM90 K309 | J182957.0+011248 | m3-09 |
| W85 G44 | ||||
| 14 | K407 | H229 W166 | J183014.0+010852 | m1-25 |
| 15 | EC117 | NIRS9 GCNM135 K338 W216 G65 | J183000.6+011340 | m3-06 |
| 16 | EC86 | GCNM93 W190 G45 | J182957.4+011450 | m3-02 |
| 17 | W201 | G36 | J182955.4+011034 | m3-17 |
| 18 | EC77 | STGM9 GCNM80 W204 G39 | J182956.4+011218 | m2-11 |
| 19 | 19 | - | J182955.3+011047 | m2-18 |
Note. — This table lists FLAMINGOS spectroscopic targets that are likely YSOs in the cloud.
| ID | SED | SpTaaAdopted for this paper | RA(2000) | DEC(2000) | JbbThis work. | HbbThis work. | KbbThis work. | c2d NameccCores to Disks Spitzer Legacy catalogue. | Mask- |
|---|---|---|---|---|---|---|---|---|---|
| hr:min:s | mag | mag | mag | Slit # | |||||
| 20 | III | K4.5 6.5 / g? | 18:29:53.89 | +01:08:42.01 | 14.62 0.02 | 12.96 0.02 | 12.31 0.02 | J182953.9+010842 | m2-27 |
| 21 | III | K4.5 2.5 / g? | 18:30:09.24 | +01:11:17.66 | 14.76 0.02 | 12.91 0.02 | 12.13 0.03 | J183009.2+011118 | m1-14 |
| 22 | III | K3.5 0.5 / g? | 18:30:11.04 | +01:12:10.95 | 14.57 0.02 | 12.89 0.02 | 12.22 0.03 | J183011.0+011211 | m1-10 |
| 23 | III | G7 3 / g? | 18:29:57.54 | +01:07:26.97 | 15.69 0.02 | 13.82 0.01 | 13.08 0.02 | J182957.5+010727 | m2-33 |
| 24 | III | K-M g | 18:29:47.44 | +01:09:59.16 | 15.60 0.02 | 12.73 0.02 | 11.40 0.02 | J182947.4+010959 | m4-23 |
| 25 | III | M g | 18:29:55.94 | +01:09:17.49 | 12.96 0.01 | 10.80 0.02 | 10.00 0.02 | J182955.9+010918 | m3-21 |
| 26 | III | G5 7 / g? | 18:29:53.83 | +01:11:20.13 | 14.21 0.03 | 12.02 0.03 | 11.20 0.03 | J182953.8+011120 | m3-14 |
| 27 | III | K3.5 2.5 | 18:30:11.07 | +01:10:30.78 | 14.03 0.02 | 12.54 0.01 | 12.01 0.03 | J183011.1+011031 | m1-17 |
| 28 | III | M2.25 f? | 18:29:56.21 | +01:10:20.13 | 14.69 0.02 | 13.93 0.02 | 13.69 0.03 | J182956.2+011020 | m2-20 |
| 29 | III | A | 18:30:12.33 | +01:06:46.68 | 12.59 0.01 | 11.75 0.02 | 11.49 0.02 | J183012.3+010647 | m1-33 |
| 30 | III | A | 18:29:53.70 | +01:07:40.76 | 13.81 0.03 | 12.77 0.03 | 12.30 0.01 | J182953.7+010741 | m2-32 |
Note. — This table lists FLAMINGOS spectroscopic targets that are likely field stars.
| Name | SED | SpT | aaThis work. Sources marked as g? are likely field giants; the spectral classification is given for them assuming alternative YSO nature. Source 28 marked as f? is likely a foreground dwarf. | bbAssuming distance 380 pc. | ||||
|---|---|---|---|---|---|---|---|---|
| BCAH98 | DM98 | BCAH98 | ||||||
| EC89 | 0/I | M7.25 0.75 | 3.450 0.017 | 15.24 1.4 | -0.67 0.14 | 0.08 | 0.11 | 2.8 |
| EC129 | 0/I/Fl | K9 3 | 3.588 0.036 | 24.62 1.1 | 0.98 0.12 | 1.08 | 0.29 | 2.8 |
| EC74 | Fl/II | M4.5 0.5 | 3.505 0.010 | 18.50 1.0 | 0.02 0.11 | 0.35 | 0.16 | 2.9 |
| EC114 | Fl | M6 0.5 | 3.476 0.009 | 10.08 1.1 | -0.85 0.13 | 0.13 | 0.14 | 3.3 |
| H232 | Fl/II | M2.9 0.6 | 3.536 0.011 | 7.27 1.0 | -0.25 0.11 | 0.50 | 0.23 | 3.5 |
| STGM1 | Fl/II | M5.4 0.6 | 3.488 0.012 | 6.80 1.0 | -1.19 0.13 | 0.15 | 0.16 | 3.7 |
| H230 | II | M6.75 0.75 | 3.461 0.015 | 5.60 1.2 | -1.72 0.14 | 0.06 | 0.09 | 3.7 |
| K9940 | II | M6.75 0.75 | 3.461 0.015 | 8.40 1.2 | -1.32 0.15 | 0.07 | 0.11 | 3.4 |
| W68 | II | M7.75 0.75 | 3.433 0.026 | 3.44 0.8 | -1.94 0.09 | 0.03 | 0.04 | 3.6 |
| EC84 | II | M6.25 0.75 | 3.472 0.013 | 19.42 0.6 | 0.30 0.11 | 0.23 | 0.10 | 2.3 |
| K407 | II/TD | M3 0.5 | 3.533 0.009 | 4.11 0.5 | -0.78 0.06 | 0.38 | 0.29 | 3.9 |
| EC117 | III | K8.25 3.25 | 3.599 0.039 | 13.75 0.6 | 0.51 0.09 | 1.20 | 0.35 | 3.3 |
| EC86 | III | M4.9 0.4 | 3.497 0.007 | 9.65 0.6 | -0.01 0.07 | 0.30 | 0.15 | 2.9 |
| W201 | III | M4 0.5 | 3.514 0.010 | 2.10 0.5 | -1.12 0.07 | 0.25 | 0.23 | 4.0 |
| EC77 | III | M5.1 0.4 | 3.493 0.007 | 4.50 0.6 | -1.35 0.07 | 0.15 | 0.18 | 3.9 |
| 19ccYSO status is only suggested based on the location on the BCAH98 HR diagram. | III | M4.9 0.4 | 3.497 0.007 | 2.45 0.5 | -1.88 0.07 | 0.13 | 0.17 | 4.3 |