Puzzling thermonuclear burst behaviour from the transient low-mass X-ray binary IGR J17473-2721
Abstract
We investigate the thermonuclear bursting behaviour of IGR J17473-2721, an X-ray transient that in 2008 underwent a six month long outburst, starting (unusually) with an X-ray burst. We detected a total of 57 thermonuclear bursts throughout the outburst with AGILE, Swift, RXTE, and INTEGRAL. The wide range of inferred accretion rates (between and of the Eddington accretion rate ) spanned during the outburst allows us to study changes in the nuclear burning processes and to identify up to seven different phases. The burst rate increased gradually with the accretion rate until it dropped (at a persistent flux corresponding to of ) a few days before the outburst peak, after which bursts were not detected for a month. As the persistent emission subsequently decreased, the bursting activity resumed at a much lower rate than during the outburst rise. This hysteresis may arise from the thermal effect of the accretion on the surface nuclear burning processes, and the timescale is roughly consistent with that expected for the neutron star crust thermal response. On the other hand, an undetected “superburst”, occurring within a data gap near the outburst peak, could have produced a similar quenching of burst activity.
keywords:
binaries: close – stars: individual: IGR J17473-2721 = XTE J1747-274 – stars: neutron – X-rays: bursts1 Introduction
X-ray bursters are accreting neutron stars (NS) in low-mass X-ray binary (LMXB) systems, in which hydrogen (H) and helium (He) accumulates on the surface, periodically exploding in thermonuclear runaways. These thermonuclear flashes, observed as type I X-ray bursts (e.g., Lewin, van Paradijs & Taam, 1993, and hereafter simply called X-ray bursts), are caused by the high temperatures and densities reached at the base of the fuel layer. Such X-ray bursts are characterised by black-body emission with peak temperature keV and a light curve showing a fast rise and exponential decay (for reviews see Lewin, van Paradijs & Taam, 1993; Strohmayer & Bildsten, 2006). To date, a total of 92 X-ray bursters have been identified in the Milky Way (e.g., in ’t Zand et al., 2004; Liu et al., 2007) 111http://www.sron.nl/jeanz/bursterlist.html. Many burst sources exhibit “photospheric radius expansion” (PRE) bursts, attributed to radiation pressure exceeding the gravitational attraction in the photosphere. Strong variations of the black-body radius are then observed simultaneously with inverse variations of the colour temperature at a constant luminosity, roughly equal to the Eddington limit (). Such bursts may thus be used to estimate the distance to the burst sources (e.g. Basinska et al., 1984).
The unstable thermonuclear burning is a recurrent phenomenon for which ignition conditions depend primarily on the (local) mass accretion rate. Early theoretical studies (Fujimoto et al., 1981; Fushiki & Lamb, 1987) predict three distinct nuclear burning regimes as a function of increasing accretion rate per unit area of H/He-rich material with solar metallicity (see also Strohmayer & Bildsten, 2006): unstable H ignition triggers He flashes for g cm-2 s-1; pure He flashes occur below a shell of H steadily burning in the hot CNO cycle for g cm-2 s-1; and mixed He/H bursts are triggered by unstable He ignition for g cm-2 s-1. Still, the detailed physics of the nuclear burning are not completely understood. The above-mentioned thresholds depend on nuclear reactions rates, sedimentation and mixing processes in the burning layers, as well as anisotropy effects. Thus, some phenomenological issues still have to be solved, such as the drop in burst activity at high accretion rate (e.g. Cornelisse et al. 2003), as well as the precise burst mechanism at low accretion rates .
Due to nuclear reaction waiting points related to a series of decays during the burning of H in the rp-process, H-dominated bursts burn slower than He-dominated bursts, that burn instead through the fast triple- reactions. The lengths of the rise times and exponential decays are therefore related to the relative amounts of H to He burnt during the bursts. However, bursts lasting several tens of minutes have also been recorded, that are now interpreted as the long burning of a thick pure He layer, accumulated over a long interval at very low accretion rate and/or from an He donor (see, e.g., Cumming et al., 2006; in ’t Zand et al., 2005; Chenevez et al., 2007; Falanga et al., 2008). Even longer and more energetic nuclear bursts have been reported in rare occasions (see, e.g., Keek & in ’t Zand, 2008) as superbursts that last up to several hours. They are thought to arise from carbon (C) burning in a thick layer below the surface of the NS (Cumming & Bildsten, 2001; Strohmayer & Brown, 2002). Although H/He burning is likely required to produce the C for these bursts, interestingly the occurrence of a superburst has the effect of ’quenching’ normal bursting activity for weeks to months (Kuulkers, 2004).
X-ray transients are ideal sources for studies of burst behaviour because they frequently experience a large range of accretion rates (and spectral states) in a short time frame. The X-ray transient source IGR J17473-2721 was discovered with the INTErnational Gamma-Ray Astrophysics Laboratory (INTEGRAL) in the Galactic Centre region during an outburst in April 2005 (Grebenev et al., 2005). The source XTE J1747-274, detected by RXTE in May 2005 (Markwardt & Swank, 2005), was rapidly identified with IGR J17473-2721 by Kennea et al. (2005) using Swift/XRT. The source exhibited a second episode of activity between March and September 2008, which began with a type I X-ray burst on MJD 54552 (Del Monte et al., 2008a), thus identifying the source as a neutron star in a LMXB system (though the first bursts ever observed from this source are reported in Galloway et al., 2008, hereafter G08). Only a few observations of thermonuclear flashes occurring before the start of an outburst have been recorded (e.g., Cornelisse et al., 2007; Kuulkers et al., 2009a).
The 2008 outburst of IGR J17473-2721 was well followed from its beginning by most of the high energy satellite fleet operating at that time. Swift/XRT (Altamirano et al., 2008a) and RXTE/PCA (Markwardt et al., 2008) confirmed renewed accretion activity from IGR J17473-2721 at a position consistent with the burst detection by SuperAGILE (Del Monte et al., 2008a). Hard X-ray persistent emission was almost simultaneously detected by INTEGRAL (Kuulkers et al., 2008; Baldovin Saavedra et al., 2008). Later on during the outburst episode, kilohertz QPOs at frequencies up to Hz were detected by Altamirano et al. (2008b), after a spectral switch from a hard to a soft state. The same authors thus identified the source to belong to the class of atoll NS, and, from the observation of two PRE bursts, estimated its distance to be in the range 4.9–5.7 kpc. A detailed comparison of the IGR J17473-2721 outbursts in 2005 and 2008 is described by Zhang et al. (2009), and a study of some bursts observed in 2008 is presented by the same authors in Chen et al. (2010) that we discuss in section 4.1.
In the present paper, we investigate the bursting behaviour of IGR J17473-2721 during its outburst in 2008, so all calendar dates refer to that year. This study is based on all the bursts observed by instruments aboard AGILE, Swift, RXTE, and INTEGRAL.
2 Observations and data analysis
2.1 AGILE
The AGILE satellite mission (Tavani et al., 2008), launched on 23 April 2007, includes a hard X-ray (18–60 keV) monitor, SuperAGILE (see Feroci et al., 2007, 2010, for details), that consists of two pairs of 1-D coded aperture imagers of field of view (full width zero response), and pointed to the same target. Two are oriented along one direction in the sky and the other two in the orthogonal direction. In the overlapping region, of , both coordinates are encoded, thus giving twice a 1-D imaging, and the sensitivity on axis is of the order of 15 mCrab at in one day.
SuperAGILE is equipped with ground trigger software (see Del Monte et al., 2008b, for details), dedicated to the detection of -ray and X-ray bursts, as well as other transients, occurring on time scales from 512 to 8192 ms. The trigger sensitivity in 10 s at 5 sigma corresponds to about 1.3 Crab assuming a Crab-like spectrum, or to erg cm-2 s-1, assuming a 3 keV black-body spectrum. In case of a trigger, an image is extracted and the burst position can be reconstructed with an uncertainty of 3 arcmin radius.
2.2 Swift
The NASA mission Swift (Gehrels et al., 2004) provides 15–50 keV light curves using the Burst Alert Telescope222http://swift.gsfc.nasa.gov/docsd/swift/results/transients (BAT; Barthelmy et al., 2005), with which we followed the long-term hard X-ray evolution of the outburst of IGR J17473-2721.
Following the burst detection by SuperAGILE (see section 3.2), Altamirano et al. (2008a) obtained a Swift observation to conclusively identify the burst source with IGR J17473-2721 on March 31 (MJD 54556). We analysed data from the X-Ray Telescope (XRT; 0.2–10 keV, Burrows et al., 2005) in both Photon Counting (PC) and Windowed Timing (WT) modes, resulting in exposure times of 4.1 and 0.7 ksec respectively. The raw data were processed with the XRT pipeline using standard quality cuts (event grades 0-2 and 0-12 for the WT and PC mode respectively). The PC spectrum was fit with XSpec version 12 (Arnaud, 1996) to a simple absorbed power-law model of index 1.85 with a reduced for 187 dof.
During the portion of the observation for which WT data was available, a type I X-ray burst was detected with a peak count rate above 400 counts s-1. We carried out time-resolved spectroscopy by extracting source events from a rectangular box of 40 pixels along the image strip and 20 pixels wide. According to Romano et al. (2006), WT data at such high count rates are expected to be affected by pile-up, so we excluded a box of the central 4 by 20 pixels for intervals in which the count rate exceeded 400 counts s-1, 2 by 20 pixels for rates of 300–400 counts s-1, and a band of 1 by 20 pixels for count rates between 100–300 counts s-1. The burst time resolved spectral analysis was performed dividing up the burst in seven intervals from 2 s to 100 s. These data were fit using XSpec with a black-body model subject to interstellar absorption, fixing the hydrogen column density to the value found from fitting the PC spectral data ( cm-2).
2.3 INTEGRAL
The hard X-ray and -ray observatory INTEGRAL (Winkler et al., 2003) provides three coded-mask instruments operating simultaneously. For our study we used the X-ray monitor JEM-X (3–25 keV, Lund et al., 2003) and IBIS/ISGRI (18 keV–10 MeV, Lebrun et al., 2003) data, reduced with the standard Off-line Science Analysis (OSA; Courvoisier et al., 2003) software version 8.0. Data were corrected for vignetting effects of the JEM-X collimator. A systematic error of 3% per channel was applied to JEM-X and ISGRI spectra, corresponding to the current estimated uncertainties in their response. Due to the partly incomplete coded-mask pattern of JEM-X, its signal deconvolution can be affected by some crosstalk between sources inside the same field of view. We have verified that the source-extracted signal for the analysis of IGR J17473-2721 burst events was not contaminated by neighbouring sources333In particular GX 3+1, located 0.8∘ away from IGR J17473-2721 and which at that time was in a high-soft, not bursting state..
The outburst of IGR J17473-2721 was monitored as part of INTEGRAL regular observations of the Galactic Bulge performed each spring and fall, approximately every three days for about 3.5 h (Kuulkers et al., 2007). In 2008, this monitoring programme covered IGR J17473-2721 between February 11 (MJD 54507) and April 20 (MJD 54516), and again between August 18 (MJD 54696) and October 22 (MJD 54761). More INTEGRAL data originate from long observations of the Galactic Centre region performed on April 6 (MJD 54562). We searched for X-ray bursts by scrutinizing the light curves obtained from every pointing within (JEM-X) and (ISGRI) of the source position, for a total effective exposure of about 500 ks and 940 ks, respectively.
2.4 RXTE
We used data taken by the three instruments on board NASA’s Rossi X-ray Timing Explorer (RXTE). The densest coverage of the outburst at 2.5–12 keV is provided by the All Sky Monitor (ASM; Levine et al., 1996) publicly available light curves.
The Proportional Counter Array (PCA; Jahoda et al., 2006) consists of five large area Proportional Counter Units (PCUs). We used data from PCU2 as it was always on during the relevant observations. The PCA data set is composed of two independent series of observations between April 4 (MJD 54560) and May 22 (MJD 54608), as well as regular public observations from May 23 (MJD 54609) to October 2 (MJD 54741). The pointing was offset by in order to avoid GX 3+1 falling inside the PCA field of view, and no other nearby burst sources were active during that period. The RXTE/PCA observations were performed about every day during the outburst, with typically ks non-interrupted exposure each time. The total source exposure is ks.
We followed the evolution of the persistent emission during the outburst by comparing, for each PCA observation, its intensity, defined as the count rate in the 2–16 keV energy band, with its hardness, defined as the ratio of the intensity in the 9.7–16 keV band to that in the 6–9.7 keV band. We thus drew a hardness-intensity diagram (HID) where these quantities are normalised to the corresponding values obtained with the Crab (see Altamirano et al., 2008c, for a full description of the procedure). We fitted the vignetting-corrected PCU2 spectra of the 2.5–25 keV persistent emission of IGR J17473-2721 with a model consisting of a black-body radiation plus a power-law and a gaussian emission line at 6.4 keV (consistent with FeI K fluorescence) all absorbed by interstellar matter. The High-Energy X-ray Timing Experiment (HEXTE; Rothschild et al., 1998) was used to extend the bandpass with 30–200 keV. This allowed us to acquire bolometric correction factors (see G08) on the PCU2 spectra for six distinct epochs (see also Zhang et al., 2009), in order to estimate the bolometric persistent fluxes between 0.1–200 keV.
We searched for, and analysed the bursts detected by the PCA following G08. We computed 1-s light curves on the full PCA energy range (2–60 keV) using ’Standard-1’ mode data and searched for significant deviations from the mean level. For each candidate event we identified, we computed burst spectra using (typically) 64-channel ’Event mode’ data from before the burst start, through to late in the burst tail (typically s following the burst start). The integration time for each spectrum was 0.25 s at the start of the burst, increasing through the tail as the burst flux decreased to maintain approximately the same signal to noise level. We used a 16-s persistent spectrum (including the instrumental background) extracted from before the burst start as background for the burst spectral analysis. We fit each spectrum initially with an absorbed black-body, with the neutral column density free to vary, and calculated its mean value over the burst. Subsequently we re-fit the burst data with frozen at the mean level and computed the bolometric flux and uncertainties based on the measured black-body temperature and radius. Fluxes were eventually corrected for the off-axis pointing by scaling the measured flux with the ratio of the response of the collimator at the aimpoint to its response at the source position.
2.5 Burst properties
We apply the definitions by G08 for burst start and rise times, as the time when the burst flux first exceeds of the peak flux, and the following interval until the burst exceeds of the peak flux, respectively. We define the burst duration as the interval from the start time to the time when the burst flux has decayed to 25% of the peak flux. All uncertainties are given at a 1 confidence level.
We compute the burst fluence by integrating the measured flux over the burst duration; the burst timescale as the ratio of the fluence to the peak flux; and is the energy ratio between persistent emission and bursts (e.g. Lewin & Joss, 1983), where is the recurrence time between two consecutive bursts, is the persistent flux at the time of the burst, and is the fluence of this burst.
3 Results
3.1 Persistent emission
We follow the changes of the broad-band persistent emission from IGR J17473-2721 by combining BAT daily averaged data with all available RXTE data between MJDs 54500 and 54750 (MJDs 54560–54740 for PCA and HEXTE).
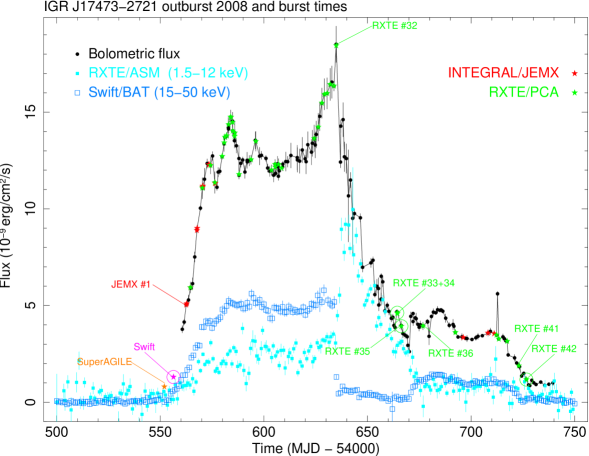
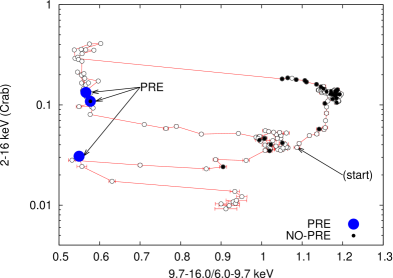
Fig. 1 depicts the evolution of the bolometric flux of IGR J17473-2721 together with ASM and BAT daily averaged light curves for the soft and hard persistent intensities, respectively. The outburst started at the end of March, around MJD 54556 (see also Altamirano et al., 2008a; Markwardt et al., 2008; Kuulkers et al., 2008), with a rapid rise in intensity, particularly in hard ( keV) X-rays, and reached a bolometric flux erg cm-2 s-1 in less than 20 days. The source remained close to this flux level during the following one and an half month (from around MJD 54580 to 54625). The flux then rose for another ten days, reaching a peak about erg cm-2 s-1 on June 17 (MJD 54634). At the same time the persistent spectrum dramatically switched from hard (i.e. with more flux in the 15–50 keV band than in the keV band) to soft in less than 3 days, as witnessed by ASM and BAT light curves (Fig. 1). These two states are also obvious in the HID plotted in Fig. 2 that shows the transition with the 9.7–16/6–9.7 keV hardness falling abruptly from above 1 down to below 0.6 at a 2–16 keV flux slightly increasing above 0.2 Crab. The bolometric flux subsequently decreased almost continuously for about one month (from MJD 54635 to 54670), down to erg cm-2 s-1. From MJD 54670.5 the source spectral state returned from soft to hard at relatively low level (corresponding to the group near the middle of the HID at the hardness around 1), remaining there for a month at a bolometric flux level about erg cm-2 s-1, and finally decreased, with a hardness zigzag path, back to its pre-outburst level after another month (see also Zhang et al., 2009).
We note that the HID shows some similarities with corresponding diagrams for black-hole X-ray binaries (BHXRB; see, e.g., Fender et al. 2004), and similarities in this sense have already been reported (e.g. Fender & Kuulkers 2001; Fender et al. 2003; Tudose et al.,2009).
3.2 Burst analysis
We found a total of 57 individual X-ray bursts from IGR J17473-2721 in 2008. One of these bursts, on April 8 (MJD 54564.567), was simultaneously detected by INTEGRAL/JEM-X and RXTE/PCA. We have performed separate light curve and spectral analyses of each burst data set from the different instruments: SuperAGILE: 1 burst, XRT: 1 burst, JEM-X: 14 bursts (of which 6 were also weakly detected by ISGRI), and PCA: 42 bursts.
3.2.1 Burst light curves
The first X-ray burst from IGR J17473-2721 in 2008 was detected by SuperAGILE on March 26 (MJD 54551.972) at a time when the source was in relative quiescence at a 2-10 keV flux below erg cm-2 s-1(Del Monte et al., 2008a; Markwardt et al., 2008; Kuulkers et al., 2008). The event was visible only in the SuperAGILE 17–25 keV band light curve (see Fig. 7) for a duration of 44 s. The broad single peak, showing some hints of internal structure, was not preceded by a precursor. From the SuperAGILE image in the same energy band, the average flux is derived to erg cm-2 s-1 and the burst fluence is erg cm-2. The hardness ratio (counts between 20 and 25 keV divided by the counts between 17 and 20 keV) does not show any evolution during the burst. We did not find other bursts from the same source in SuperAGILE data during the whole AGILE observation from 20.7 days before to 3.5 days after the burst.
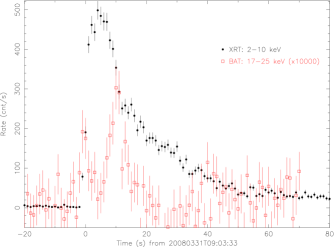
A few days later, on March 31 (MJD 54556.377), the XRT and BAT instruments detected a second X-ray burst (see Fig. 3) when the 2–10 keV source persistent flux was still low at erg cm-2 s-1(Altamirano et al., 2008a). The 2–10 keV burst rise time is 4.5 s and the bolometric peak flux is erg cm-2 s-1. The decay consists of a first prompt decrease with an e-folding decay time of 12 s, followed 14 s after the burst peak by a longer tail decreasing with an e-folding decay time of 25 s; the single exponential decay time for the whole light curve is 21 s. The 17–25 keV BAT light curve (see Fig. 3) allows us to compare this burst with the SuperAGILE one in the same energy band, and indicates a burst duration s, about a factor of two shorter than the burst observed by SuperAGILE. In this energy band the average BAT burst flux is erg cm-2 s-1 and the fluence is about erg cm-2. Moreover, we note that the hard X-ray light curve shows a double peaked structure, which is often related to a PRE event (see section 3.2.2).


INTEGRAL detected 14 X-ray bursts near the beginning and the end of the outburst of IGR J17473-2721 (see Fig. 8 and Table 1). Thanks to the long uninterrupted INTEGRAL observations on the source, we recorded five pairs of bursts from which we can unambiguously measure the wait times between the bursts, which decreased from 6.5 h on MJD 54562 down to 2.1 h on MJD 54576. The first 11 bursts, observed during the outburst rise, have relatively long rise times of between 3 s and 9 s ( s on average) and long exponential decay times of between 10 s and 33 s ( s on average). The remaining three bursts, observed during the outburst tail, evolved more rapidly, with rise times of between 1 s and 5 s (average s), and decays of between 9 s and 14 s (average s). Among the bursts also detected by the IBIS/ISGRI instrument, two were significant up to 40 keV. As a comparison with the two first bursts observed by SuperAGILE and Swift, the 17-25 keV light curve of the first burst observed by INTEGRAL on April 6 (MJD 54562.508) indicates a duration of only s.
The richest data set is provided by PCA, covering most of the outburst. The bolometric flux light curves of the 42 bursts detected by PCA have been compiled in Fig. 4 (see also Table 1). Burst #1 is the event simultaneously detected by JEM-X on MJD 54564.567, though their light curves are not easy to compare because the JEM-X and PCA instruments have different responses. Bursts #8 and #9 form a doublet only separated by 510 s. Observations of a few burst pairs indicate a steadily decreasing wait time to a minimum of 1.6 h at MJD 54585. We notice a prolonged pause of burst activity after the outburst emission reached its bolometric peak flux, also corresponding to the sudden change in spectral hardness (Figs. 1 and 2). The last recorded burst before the peak of the outburst is #32, and the next recorded burst, #33, was observed one month later. The difference between the light curves of these two bursts is clear and indicates a major change in the general shape of the burst light curves before and after the outburst peak. Thanks to the good time resolution of the PCA, the light curves can be fit with dual exponential decays. On average, the 32 PCA bursts that occurred before the peak of the outburst have rise times of s, and exponential decays of s and s. The 10 remaining bursts after the resumption of the burst activity during the decay of the outburst are characterised by much shorter rise times of s on average, and exponential decay times of s and s on average. This is consistent with the bursts reported by JEM-X at corresponding epochs. Among the PCA bursts, #33, which is the first burst observed after the one-month intermission, has the highest peak flux at erg cm-2 s-1, as well as the shortest rise time of s and shortest exponential decay time of s.
3.2.2 X-ray burst spectral analysis
We present results of time-resolved spectral analyses performed for the bursts observed with Swift (see Fig. 5) and with RXTE/PCA (see Figs. 9 and 10).
The time-resolved spectroscopy of the Swift burst reveals anti-correlated black-body temperature and radius variations at roughly constant bolometric flux during the first 20 seconds. The PCA bursts #33, #35, and #42 exhibit the same properties, characteristic of PRE events. The average bolometric peak flux of these four bursts is erg cm-2 s-1, and the highest peak flux is reached by the Swift burst at erg cm-2 s-1. Assuming that the highest peak flux corresponds to the Eddington luminosity limit for helium bursts, erg s-1, as empirically derived by Kuulkers et al. 2003 (but see also section 4.1), we derive a source distance of kpc (see also Altamirano et al., 2008a, b). In Figs. 5 and 10 the black-body radius is presented at a distance of 5.5 kpc (see section 4.1). It is worth noting that all these PRE flashes occurred at times when the 15–50 keV intensity measured by the BAT was at its lowest level (see Fig. 1) during the soft spectral state. This can also be seen in the HID of the outburst Fig. 2, placing the PRE bursts in the softest states.
We further notice that bursts #38 to #41, whose temperatures peak above 3 keV, show slightly anti-correlated variations of the black-body radius with the colour temperature, in the opposite way as PRE events. These bursts have also in common to all occur at low persistent bolometric flux erg cm-2 s-1.
Time-resolved spectral analysis results of the bursts observed by the other instruments do not provide additional information. The complete analysis results for every burst are compiled in Table 1.

3.3 Burst behaviour as a function of the bolometric flux
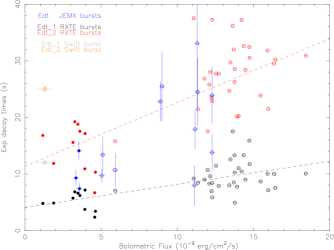
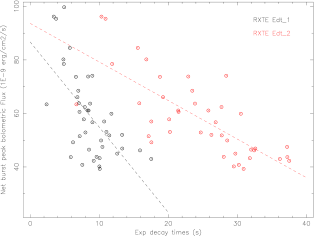
During the rise phase of the outburst bolometric flux the burst recurrence time became progressively shorter, down to less than 2 h, as derived from uninterrupted observations of the source between pairs of consecutive bursts. The light curves of the bursts observed in that phase of the outburst showed slow rise and relatively long decay times (Figs. 4 and 8). After the persistent flux reached its maximum, corresponding to of the Eddington limit (see Fig. 1), no bursts were detected during a prolonged period of low flux in a soft spectral state. The burst activity resumed after an interruption of one month, with shorter and more intense bursts than before the peak of the outburst. Figure 11 shows a likely correlation (Pearson’s coefficient r=0.62) between increasing exponential decay times and increasing persistent flux. On the other hand, we also notice that the bursts with the highest peak fluxes tend to have the shortest decay times (see Fig. 12).
Apart from the PRE bursts only occurring in the soft state as already mentioned, we also notice in the HID Fig. 2, that there are more bursts in the hard state than in the soft state, all above a 2–16 keV intensity of 0.25 Crab. The bursting activity seems thus also related to the source spectral state.
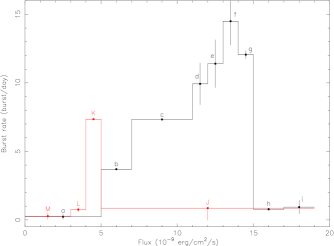
We adopt here the bolometric (0.1–200 keV) flux as a tracer of the accretion rate, but acknowledge that there may be uncertainties of order 40% due to undetected soft components (see Thompson et al., 2008), and several per cents due to jet activity, though it is not yet clear how much it can be (Russell et al., 2010). The burst rate as a function of persistent emission (or accretion rate) plotted in Fig. 6 indicates a steady increase until a maximum of 14.5 bursts per day is reached at a bolometric flux of erg cm-2 s-1(the short doublet is not included in Fig. 6). The bursting activity drops rapidly above a bolometric persistent flux of erg cm-2 s-1, corresponding to of the Eddington accretion rate (see section 3.2.2). The red histogram (labeled with uppercase letters) of Fig. 6 displays the burst rate during the decrease of the persistent emission. Indeed, no bursts at all were detected in the 30 days following the bolometric peak flux of the outburst, even though observations totalling approximately 80 ks were made with RXTE. Before the burst interruption, JEM-X and PCA detected 42 bursts in a total of about 280 ks exposure time, corresponding to an average burst rate of almost 13 bursts per day. Assuming the same burst rate, and that Poisson statistics describe the number of bursts observed in any given observation, the probability of detecting no bursts during the interruption is . Even at a burst rate four times lower, this probability remains below 5%. Twenty eight RXTE observations, of 4.2 ks mean duration (with a standard deviation of 2.9 ks), were performed randomly during one month and separated on average by 1 day (15 hours standard deviation). Therefore, we conclude the chance probability of having missed every burst in that period, to be negligible. In other words, the burst rate must have dropped considerably below an upper limit that, from the available observations, we assess at burst per day (at ), which corresponds to the label ”J” in Fig. 6. The burst activity thus resumed (”K”) about one month after the outburst peak and decreased later on with the decreasing persistent emission (”L” and ”M”). So, for the same range of bolometric flux, the bursting activity in IGR J17473-2721 strongly depends on whether the persistent emission is increasing or decreasing. Moreover, we note from Figs. 11 and 6 that, apart from the two bursts observed by SuperAGILE and Swift at the beginning of the outburst, the bursts observed during the rise phase of the outburst occurred at a persistent bolometric flux above erg cm-2 s-1, while all the bursts observed during the outburst decrease phase occurred below this threshold.
4 Discussion
4.1 Summary of main results
Thanks to the wide coverage by RXTE, INTEGRAL, Swift and AGILE and their 58 burst detections, the 6-month long outburst from the transient IGR J17473-2721 provides a comprehensive record of burst activity on a neutron star over a wide range of accretion rates. The most interesting aspect of this record is the hysteresis shown in Fig. 6, particularly the 1-month long intermission in burst activity that commences with the peak of the accretion outburst and at the same time of a spectral state change in the accretion radiation. Similar burst intermissions also seem to have been exhibited by the bursting transients EXO 1745-248 (G08) and 4U 1608-52 (Keek et al. 2008).
From the observation of PRE bursts we derive the distance to the source at kpc by assuming the highest burst peak flux equal to the Eddington limit for a H-poor photosphere: erg s-1(Kuulkers et al., 2003). It is however not possible a priori to know exactly the composition of the NS photosphere. The accreted material is most likely H-rich, based on the - values (see below), but the NS photosphere during radius expansion may be H-poor once the outermost, H-rich layers are ejected. Such a scenario is suggested from observations of bimodal radius-expansion burst peak fluxes in 4U 1636-536 (Sugimoto et al., 1984; Galloway et al., 2006), although the details of this mechanism remain uncertain. Though the peak fluxes of the four PRE bursts are not exactly the same, we assume that they all intrinsically reach the same Eddington luminosity (see Galloway et al., 2003, 2006). Their characteristics (fast rise and short decay) being consistent with the burning of H-poor material, we interpret their peak flux as actually reaching the Eddington limit for He, and the source distance thus derived being comprised between 5.4 and 6.3 kpc. If one assumes the theoretical value of erg s-1for He bursts on a canonical 1.4 solar mass and 10 km radius NS (see, e.g., Galloway & Cumming, 2006), the distance is reduced to between 4.7 and 5.5 kpc. In conclusion, we find the distance to IGR J17473-2721 at kpc.
A rare observation of an X-ray burst prior to the beginning of the outburst (Del Monte et al., 2008a) is the signature of some accretion activity at a particularly low rate (Kuulkers et al., 2009a). We estimate the 17–25 keV fluence of the SuperAGILE burst to about erg cm-2, which is twice higher than the Swift burst fluence in the same energy band. For a 3 keV black-body model, this leads to a bolometric fluence of about erg cm-2, which is similar to the fluence of the confirmed PRE bursts observed later in the outburst. This fluence implies that accretion started at least 3 days prior to the burst observed by SuperAGILE, or a week before the onset of the outburst. Alternatively, it means that some fuel was left over from the previous outburst in 2005.
We found a burst doublet with less than 10 min. recurrence time. While the first of these two bursts shows a relatively long rise (6.5 0.3 s) and decay (10 s) times, the second one has much shorter rise (3.5 0.3 s) and decay (5 0.5 s) times. The fluence of this latter burst, equal to erg cm-2, is 3 to 4 times lower than the previous and the other neighbour bursts. Moreover, assuming complete and isotropic burning of the fuel accreted between these two bursts, the ignition column for the one is: g cm-2. This small ignition column, about one order of magnitude lower than for typical bursts, is insufficient to ignite freshly accreted nuclear fuel. It may therefore indicate that the second burst is related to the first one, and produced by some residue of unburnt fuel as suggested by Fujimoto et al. (1987). However, other examples of burst doublets have already been observed from other sources with even shorter intervals (see, e.g., G08, Linares et al., 2009) and their explanation may be related to the mixing of the unburnt fuel in deeper layers (Boirin et al., 2007; Keek et al., 2010).
One convenient way to investigate the burst energetics is to compare the amount of energy radiated by the persistent emission between the bursts with the energy released by the thermonuclear bursts. Their ratio is the parameter, determined observationally as the ratio of the integrated persistent (bolometric) flux over the burst interval to the burst fluence (see section 2.5). Assuming that all the accreted fuel is burnt during the bursts, the nuclear energy release per nucleon (see, e.g., Galloway & Cumming, 2006) is: erg/g)-1, where is the appropriate gravitational redshift at the surface of a 1.4 M⊙ and 10 km radius NS. For a given average mass fraction of H at ignition, one has: MeV nucleon-1. During the plateau prior to the peak of the outburst of IGR J17473-2721, is about 75 – 80, increasing to when the bursting activity resumes after the peak of the outburst. These values correspond to H fractions in the burst fuel of and , respectively. This difference in fuel composition, and thus in burning regime, may explain why the burst rate shown in Fig. 6 is higher after the outburst peak than compared to when it was at the same flux level at the beginning of the outburst.
Eventually, the originality with IGR J17473-2721 is that seven phases of burst behaviour can be distinguished in Figs. 1 and 4:
-
1.
Very early in the outburst, a first burst detected with SuperAGILE, followed a few days later by the Swift observation of a PRE burst. Both bursts occur at a low accretion rate 1% of the Eddington limit;
-
2.
During the rise of the outburst and the subsequent plateau phase in hard state (from the first JEM-X burst to RXTE #24), bursts arrive faster with increasing accretion rates. The slope of the linear rise in the burst rate versus persistent flux histogram (Fig. 6) is equivalent to , which is consistent with the direct (burst-to-burst) measurements in Table 1. Together with this value, the relatively long burst rises and decays point to He-ignited H/He bursts in which the H is burnt through the rp process (compare with burst profiles of GS 1826-24, Heger et al., 2007);
-
3.
During the final 15 days leading to the outburst peak (RXTE bursts #25 to #32), when the bolometric flux is in excess of erg s-1cm-2, the recurrence time drops by an order of magnitude (Fig. 6). This leads to an increase of alpha about 1500, consistent with simultaneous stable and unstable He burning (in ’t Zand et al., 2003);
-
4.
At the time of the outburst peak, a 1-month intermission in burst activity starts. The outburst peak also coincides with a sharp spectral transition into a soft state;
-
5.
After the intermission, when the outburst is still in the soft state, but when the persistent flux is at similar levels as during the first few bursts early in the outburst, the brightest and shortest X-ray bursts occur (RXTE bursts #33–35, two with PRE). Most likely these are pure He flashes;
-
6.
After the persistent spectrum switches back to a hard state within 10 d, the X-ray bursts become longer again, but not as long as earlier in the outburst, and are probably again due to mixed He/H burning (JEM-X bursts #11–14 and RXTE bursts #36–41);
-
7.
the last observed burst (RXTE #42) occurs after yet another transition of the accretion radiation from a hard to a soft state at low accretion rate. This burst also shows limited PRE.
A study of the burst activity in IGR J17473-2721 was recently published in Chen et al. (2010). As a main result, these authors find two parallel evolution groups of the burst durations as function of the persistent luminosity. However, we note that they only employ 16 bursts during the outburst of IGR J17473-2721 in 2008, all after MJD 54624, against 57 in our data set, which spans the whole outburst. We mean that the findings of Chen et al. (2010) derive from a selection effect, for no such parallel groups are visible in Fig. 11, which corresponds to Figure 5 of Chen et al. (2010). Moreover, we note a discrepancy between our bolometric fluxes and those of Chen et al. (2010), which is most probably due to the limited energy range (1.5–30 keV) these authors adopt to define the bolometric luminosity based only on PCA measurements. Such a limited bolometric range does not adequately represent the persistent luminosity of IGR J17473-2721, and hence its mass accretion rate during the different phases of the outburst. Therefore, we do not come to the same conclusions as Chen et al. (2010), but rather suggest the following interpretations of our observation results.
4.2 Possible interpretations
There is considerable variability in burst peak fluxes and time scales. The rise and decay times tend to be somewhat longer before the intermission than after, particularly the rise times. The shortest rise times combine with the highest peak fluxes. These trends indicate a varying He to H abundance ratio in the burning layer. This is not unexpected considering the varying accretion rate. The shortest bursts (RXTE bursts #33–35) are consistent with pure He burning. All other bursts are longer and fainter and must have larger H fractions in the fuel. Therefore, the mass donor must be H-rich. The fact that pure He bursts occur implies that stable H burning (through the hot CNO cycle) must simultaneously be present during RXTE bursts #33–35, particularly since bursts at similar persistent fluxes early in the outburst (for instance RXTE burst #1) have roughly twice longer times scales and half the peak flux. Thus, we identify four burst regimes. First, mixed H/He flashes during burst phases i,ii, iii and vi. Second, pure He flashes concurrent with stable H burning in burst phase v. Thirdly, rich He flashes at the lowest persistent fluxes. Lastly, no bursts at all and, therefore, stable H and He burning during the intermission. Thus, all burst regimes for H/He burning (Fujimoto et al., 1981; Bildsten, 1998) are exhibited by IGR J17473-2721, but at accretion rates about one magnitude order higher. Such a discrepancy between observed and theoretical accretion rates has already been noted for other sources (see, e.g., the discussion by Cornelisse et al., 2003).
The most intriguing question is what actually caused the 1-month interruption of burst activity after the peak of the outburst. If the He and H are not burnt in an unstable fashion through flashes, they must be burnt in a stable fashion. The drop in burst rate (Fig. 6) just before the peak thus suggests the onset of stable H and He burning, at a threshold persistent luminosity that is similar (i.e., within a factor of two) to what is seen in other bursters (cf., Cornelisse et al. 2003), although the burst profiles in IGR J17473-2721 do not show as strong a change. Hence, stable He burning, which should occur at higher accretion rates than stable H burning, apparently starts for IGR J17473-2721 at lower accretion rates than normally expected. We discuss two scenarios.
One possibility is that the intermission is the result of thermal relaxation of the crust. The crust becomes hotter during the outburst due to electron capture reactions (Gupta et al. 2007). The thermal time scale of the crust is of order a few months (Brown & Cumming 2009). It is likely that the temperature is still rising after the outburst peak. Above certain temperatures the H and He burning will become stable ( and K, respectively; e.g., Cumming & Macbeth, 2004). The intermission of bursts at the time of the peak of the outburst may be explained if the temperature rises above the threshold temperature for stable He burning just at that time. The thermal relaxation of the crust may sustain that temperature for the duration of the intermission after which it would drop below the threshold due to the decay in accretion rate that started at the peak of the outburst. Calculations for the transient 4U 1608-52, which had a similar outburst duration and peak accretion rate as IGR J17473-2721, indicate that the temperature may reach high enough values (Keek et al. 2008). A problem of this scenario is that the heating time scale appears short if the burning depth is the same for stable H and stable He burning. Indeed, it takes for IGR J17473-2721 less than 15 days from the onset of stable H burning (drop of burst rate) to reach stable-only He burning (burst interruption), corresponding to a difference factor of 5–6 in temperature. The rapidity of this heating may be explained by the onset of stable H burning, but verifying this requires solving the heat balance of the upper layers. As with the calculation of the thermal relaxation of the crust, this is outside the scope of this observational paper.
An alternative and perhaps more likely explanation for the intermission is that a superburst occurred during a data gap, and provided the sudden heating to initiate stable He burning. There is a data gap of more than 10 hours between the last detected burst and the first available observation (by RXTE/ASM) of the soft state. Though the probability that a superburst just occurred during the data gap is rather small — for a typical superburst recurrence time of per year (Keek & in ’t Zand, 2008) — this is, in principle, enough time for a superburst to ignite and cool off. Cessation of burst activity after a superburst is commonly observed (e.g., Kuulkers 2004). This ’quenching’ of normal bursts is explained by the additional heat flux coming from the underlying cooling ashes of the superburst that stabilizes the H/He burning layers (Cumming & Bildsten 2001). Cumming & Macbeth (2004) predicts timescales for quenching of weeks. In the cases of Ser X-1 (Cornelisse et al. 2002) and KS 1731-260 (Kuulkers et al. 2002), no bursts were detected after a superburst during a period of about one month. Another example, more similar to the present case, is a superburst from the transient and H-rich burster 4U 1608-52 (Keek et al. 2008), 55 days after the onset of an outburst in 2005. The first normal burst was detected 100 days after the superburst, although long data gaps may have prevented earlier burst detections. Considering that the sudden burst intermission of IGR J17473-2721 began after the outburst peak at MJD 54635, a superburst would thus possibly have taken place more than 75 days after the outburst onset. The fluence of the outburst until the peak is 0.08 erg cm-2, which at the distance to the source translates to an energy of erg. This is similar to the value reported by Keek et al. (2008) before the superburst of 4U 1608-522. The average bolometric flux of the outburst prior to the maximum is erg cm-2 s-1 or about 12% of the Eddington limit, which corresponds to the level of accretion rate typically measured for superbursts (see, e.g. Keek & in ’t Zand, 2008). For t = 75 days, this corresponds to an accumulated column depth g cm-2 . This is one order of magnitude below the typical column depth for superbursts whose energy release is erg, but a part of the necessary C fuel may have been accumulated on a much longer timescale at low accretion rate. Still, this value is only half the value inferred from the superburst light-curve of 4U 0614+091 (see Kuulkers et al. 2009), and as discussed by these authors, such a shallow column depth would require for ignition that the temperature of the NS crust is above K. As previously mentioned, both stable and unstable He burning likely occured during the 15 days prior to the outburst peak of IGR J17473-2721, thus increasing considerably the C production. It is also worth noting that Cornelisse et al. (2002) find that the low energy flux increased significantly after the superburst of Ser X-1 as well as after the superburst from 4U 1735-44 (Cornelisse et al. 2000), like in IGR J17473-2721.
Burst regimes appear to be tightly connected to positions in the HID, see Fig. 2. The last five phases of burst behaviour (see above) correspond to five distinct regions in the HID. A straightforward explanation is that both have a common driver: the accretion rate. Changes of burst regimes could be connected to threshold values in the (local) accretion rate and likewise could changes in spectral states of the persistent radiation be. What is remarkable for IGR J17473-2721 is that one change in burst regime occurs at the same time and/or at same accretion rate as one change in the spectral state, and this is more clear than for other sources (see also G08). If one refuses this as a coincidence, one could change the logic: the spectral state change may be due to the missed superburst or the onset of stable He fusion process. Again, it is interesting to compare with 4U 1608-52, for which Yu & van der Klis (2002) suggest that nuclear burning on the NS surface leads to the radiative truncation of the inner accretion disk.
In conclusion, the burst properties of IGR J17473-2721 are consistent with a NS accreting H-rich material at varying rates all along the outburst episode. The bursting rate as a function of the accretion rate displays an hysteresis on either side of the peak of the outburst, coincident with the interruption of the burst activity. This hysteresis may be explained by the thermal response of the NS crust, or the occurrence of a superburst. Though the odds of having missed a superburst inside a data gap of only 10 hours are not high, we consider that explanation as more likely than thermal relaxation of the crust. The question is whether the occurrence of this undetected superburst is related to the abrupt spectral transition the source underwent short after the peak of the outburst.
Acknowledgements
We are grateful to Andrew Cumming and Rudy Wijnands for fruitful discussions. JC acknowledges financial support from the Instrument centre for Danish Astronomy and ESA/PRODEX Nr. 90057. Swift/BAT transient monitor results are provided by the Swift/BAT team and RXTE/ASM results are provided by ASM/RXTE teams at MIT and at the RXTE SOF and GOF at NASA’s GSFC. This work is partly based on observations with INTEGRAL, an ESA project with instruments and science data centre funded by ESA member states (especially the PI countries: Denmark, France, Germany, Italy, Switzerland, Spain), Czech Republic and Poland, and with the participation of Russia and the USA.
References
- Arnaud (1996) Arnaud K. A., 1996, in Jacoby G.H., & Barnes J., eds, Astronomical Data Analysis Software and Systems V. ASP Conf. Series 101, p. 17
- Altamirano et al. (2008a) Altamirano D., Degenaar N., in ’t Zand J., et al., 2008a, ATel 1459
- Altamirano et al. (2008b) Altamirano D., Galloway D., Chenevez J., et al., 2008b, ATel 1651
- Altamirano et al. (2008c) Altamirano, D., van der Klis M., Méndez M., et al., 2008c, ApJ, 685, 436
- Baldovin Saavedra et al. (2008) Baldovin Saavedra C., Chenevez J., Kuulkers E., et al., 2008, ATel 1468
- Barthelmy et al. (2005) Barthelmy S.D., et al., 2005, Space Sci. Rev., 120., 143
- Basinska et al. (1984) Basinska E.M., Lewin W.H.G., Sztajno M., et al., 1984, ApJ, 281, 337
- Bildsten (1998) Bildsten L., 1998, in Buccheri R., van Paradjis J., & Alpar M.A., eds, The Many Faces of Neutron Stars. Kluwer, p. 419
- Boirin et al. (2007) Boirin L, Keek L, Méndez M., et al., 2007, A&A, 465, 559
- Brown & Cumming (2009) Brown E.F. & Cumming A., 2009, ApJ, 698, 1020
- Burrows et al. (2005) Burrows D.N., et al., 2005, Space Sci. Rev., 120., 165
- Chen et al. (2010) Chen Y., Zhang S, Torres D.F., et al., 2010, A&A, in press (arXiv:astro-ph/1002.1044)
- Chenevez et al. (2007) Chenevez J., Falanga M., Brandt S., et al., 2007, A&A, 469, L27
- Cornelisse et al. (2000) Cornelisse R., Heise J., Kuulkers E., et al., 2000, A&A, 357, L21
- Cornelisse et al. (2003) Cornelisse R., in ’t Zand J., Verbunt F. et al., 2003, A&A, 405, 1033
- Cornelisse et al. (2002) Cornelisse R., Kuulkers E., in ’t Zand J., et al., 2002, A&A, 382, 174
- Cornelisse et al. (2007) Cornelisse R., Wijnands R., Homan J., 2007, MNRAS, 380, 1637
- Courvoisier et al. (2003) Courvoisier T. J.-L., Walter R., et al., 2003, A&A, 411, L53
- Cumming & Bildsten (2001) Cumming A., & Bildsten L., 2001, ApJ, 559, L127
- Cumming & Macbeth (2004) Cumming A., & Macbeth J., 2004, ApJ, 603, L37
- Cumming et al. (2006) Cumming A., Macbeth J., in ’t Zand J., Page D., 2006, ApJ, 646, 429
- Del Monte et al. (2008a) Del Monte E., Evangelista Y., Feroci E. et al., 2008, ATel 1445
- Del Monte et al. (2008b) Del Monte E., Feroci M., Pacciani L., et al., 2008, A&A, 478, L5
- Falanga et al. (2008) Falanga M., Chenevez J., Cumming A., et al., 2008, A&A, 484, 43
- Fender et al. (2004) Fender R.P., Belloni T.M., Gallo E., 2004, MNRAS, 355, 1105
- Fender et al. (2003) Fender R.P., Gallo E., Jonker P.G., 2003, MNRAS, 343, L99
- Fender & Kuulkers (2004) Fender R.P., Kuulkers E., 2001, MNRAS, 324, 923
- Feroci et al. (2010) Feroci M., Costa E., Del Monte E., et al., 2007, A&A 510, id. A9 (arXiv:0910.4895)
- Feroci et al. (2007) Feroci M., Costa E., Soffitta P., et al., 2007, Nuclear Instruments and Methods in Physics Research A, 581, 728
- Fujimoto et al. (1981) Fujimoto M.Y., Hanawa T., and Miyaji S., 1981, ApJ, 247, 267
- Fujimoto et al. (1987) Fujimoto M.Y., Sztajno M., Lewin W.H.G., van Paradijs J., 1987, ApJ, 319, 902
- Fushiki & Lamb (1987) Fushiki I. & Lamb D.Q., 1987, ApJ, 323, L55
- Galloway & Cumming (2006) Galloway D., Cumming A., 2006, ApJ, 652, 559
- Galloway et al. (2008) Galloway D. K., Muno M.P., Hartman J.M, et al., 2008, ApJS, 179, 360
- Galloway et al. (2003) Galloway D., Psaltis D., Chakrabarty D., Muno M.P., 2003, ApJ, 590, 999
- Galloway et al. (2006) Galloway D., Psaltis D., Muno M.P., Chakrabarty D., 2006, ApJ, 639, 1033
- Gehrels et al. (2004) Gehrels N., et al., 2004, ApJ, 611, 1005
- Grebenev et al. (2005) Grebenev S.A., Molkov S.V., and Sunyaev R.A., 2005, ATel 467
- Gupta et al. (2007) Gupta S., Brown E.F., Schatz H., et al., 2007, ApJ, 662, 1188
- Heger et al. (2007) Heger A., Cumming A., Galloway D., and Woosley S.E., 2007, ApJ 671, L141
- in ’t Zand et al. (2005) in ’t Zand J., Cumming A., et al. 2005, A&A, 441, 675
- in ’t Zand et al. (2003) in ’t Zand J, Kuulkers E., Verbunt F., et al., 2003, A&A, 411, L487
- in ’t Zand et al. (2004) in ’t Zand J., Verbunt F., Heise J., et al., 2004, (arXiv:astro-ph/0403120)
- Jahoda et al. (2006) Jahoda K. et al., 2006, ApJS, 163, 401
- Keek & in ’t Zand (2008) Keek L. & in ’t Zand J., 2008, (arXiv:astro-ph/0811.4574)
- Keek et al. (2008) Keek L., in ’t Zand J., Kuulkers E., et al., 2008, A&A, 479, 177
- Keek et al. (2010) Keek L., Galloway D., in ’t Zand J., et al., 2010, (arXiv:astro-ph/1005.3302)
- Kennea et al. (2005) Kennea J.A., Burrows, D.N., Markwardt, C., Gehrels, N., 2005, ATel 500
- Kuulkers (2004) Kuulkers E. 2004, Nucl. Phys. B, 132, 466
- Kuulkers et al. (2003) Kuulkers E., et al., 2003, A&A, 399, 663
- Kuulkers et al. (2007) Kuulkers E., et al., 2007, A&A, 466, 595
- Kuulkers et al. (2002) Kuulkers E., in ’t Zand J., van Kerkwijk M., et al., 2002, A&A, 382, 503
- Kuulkers et al. (2009b) Kuulkers E., in ’t Zand J., Atteia J.L., et al., 2009, (arXiv:astro-ph/0909.3391)
- Kuulkers et al. (2009a) Kuulkers E., in ’t Zand J., Lasota J.P., 2009, A&A 503, 889
- Kuulkers et al. (2008) Kuulkers E., Shaw, S., Beckmann, V., et al., 2008, ATel 1461
- Lebrun et al. (2003) Lebrun F., Leray, J.-P., Lavocate, Ph., et al., 2003, A&A, 411, L141
- Levine et al. (1996) Levine A. M., Bradt H., & Cui W., 1996, ApJ, 469, L33
- Lewin & Joss (1983) Lewin W.H.G. & Joss P.C., in Accretion-Driven Stellar X-ray Sources, eds. W. H. G. Lewin &E. P., J., van den Heuvel, 1983, (Cambridge Univ. Press)
- Lewin, van Paradijs & Taam (1993) Lewin W.H.G., van Paradijs J. & Taam R., 1993, Space Science Reviews, 62, 223
- Linares et al. (2009) Linares M., Watts A., Altamirano D., et al., 2009, ATel 1979
- Liu et al. (2007) Liu Q.Z., van Paradijs J., and van den Heuvel E.P.J. 2007, A&A, 469, 807
- Lund et al. (2003) Lund N., et al., 2003, A&A, 411, L231
- Markwardt et al. (2008) Markwardt C.B., Altamirano D., Swank J.H., in ’t Zand J., 2008, Atel 1460
- Markwardt & Swank (2005) Markwardt C.B., & Swank J.H., 2005, ATel 498
- Romano et al. (2006) Romano P., Campana S., Chincarini G., et al., 2006, A&A, 456, 917R
- Rothschild et al. (1998) Rothschild R.E., Blanco P.R., Gruber D.E., et al., 1998, ApJ, 496, 538
- Russell et al. (2010) Russell D.M., Maitra D., Dunn R.J.H, Markov S., 2010, (arXiv:1002.3729)
- Strohmayer & Bildsten (2006) Strohmayer T.E.,& Bildsten L., 2006, in Compact stellar X-ray sources, ed. W.H.G. Lewin & M. van der Klis, (Cambridge: Cambridge University Press), (arXiv:astro-ph/0301544)
- Strohmayer & Brown (2002) Strohmayer T.E. & Brown E.F., 2002, ApJ 566, 1045
- Sugimoto et al. (1984) Sugimoto D., Ebisuzaki T., & Hanawa T., 1984, PASJ, 36, 839
- Tavani et al. (2008) Tavani M., Barbiellini G., Argan A., et al., 2008, Nuclear Instruments and Methods in Physics Research A, 588, 52
- Thompson et al. (2008) Thompson T., Galloway D., Rothschild R., Homer L., 2008, ApJ, 681, 506
- Tudose et al. (2009) Tudose V., Fender R.P., Linares M., et al., 2009, MNRAS, 400, 2111
- Winkler et al. (2003) Winkler C., Courvoisier T. J.-L., et al., 2003, A&A, 411, L1
- Yu & van der Klis (2002) Yu W. & van der Klis M., 2002, ApJ, 567, L67
- Zhang et al. (2009) Zhang S., Chen Y., Wang J., et al., 2009, A&A, 502, 231
Appendix A Online-only figures and table


| Date | MJD | PRE | a | Edt1b | Edt2b | Duration | Fluence | ||||||
|---|---|---|---|---|---|---|---|---|---|---|---|---|---|
| s | s | s | s | s | erg/cm2/s | erg/cm2 | erg/cm2/s | ||||||
| AGILE | 20080326T23:19:40 | 54551.972 | ? | 44 | (14030) | ? | |||||||
| (17-25 keV) | |||||||||||||
| Swift | 20080331T09:03:33 | 54556.377 | Y | 4.5 | 12 | 25 | 16.8 | 30 | ( | (182870) | |||
| (2-10 keV) | |||||||||||||
| RXTE | |||||||||||||
| (Bolometric) | .25 | 0.2 | 0.2 | 0.5 | |||||||||
| 1* | 20080408T13:36:27 | 54564.567 | N | 7.00 | 7.0 | 15.8 | 17.4 1.2 | 21.5 | 6.4 0.4 | 1111 7 | 5.9 0.6 | – | 5.4 0.6 |
| 2 | 20080414T07:38:24 | 54570.318 | N | 6.00 | 9.2 | 37.5 | 30.6 7.2 | 37.0 | 4.2 0.4 | 1284 179 | 11.1 1.1 | – | 10.2 1.1 |
| 3 | 20080418T05:51:38 | 54574.244 | N | 6.25 | 7.0 | 23.5 | 18.4 1.7 | 23.8 | 6.8 0.5 | 1251 24 | 12.2 1.2 | – | 11.2 1.2 |
| 4 | 20080420T08:24:32 | 54576.350 | N | 6.00 | 8.4 | 21.4 | 20.2 1.9 | 26.0 | 6.1 0.4 | 1235 33 | 11.3 1.1 | – | 10.4 1.1 |
| 5 | 20080423T21:00:59 | 54579.876 | N | 4.50 | 7.9 | 27.7 | 22.1 2.3 | 28.8 | 6.2 0.4 | 1372 53 | 12.7 1.2 | – | 11.7 1.2 |
| 6 | 20080424T20:22:18 | 54580.849 | N | 6.25 | 8.0 | 24.7 | 23.8 2.6 | 33.8 | 5.3 0.4 | 1260 43 | 13.4 1.3 | – | 12.3 1.3 |
| 7 | 20080425T04:37:51 | 54581.193 | N | 6.50 | 8.5 | 32.0 | 25.3 3.7 | 32.5 | 4.6 0.4 | 1164 69 | 13.7 1.4 | – | 12.6 1.4 |
| 8 | 20080426T00:50:50 | 54582.035 | N | 6.75 | 10.3 | 28.5 | 24.0 2.8 | 30.5 | 5.0 0.4 | 1198 46 | 13.8 1.4 | – | 12.7 1.4 |
| 9 | 20080426T00:59:20 | 54582.041 | N | 3.50 | 4.9 | 0.0 | 10.3 1.5 | 11.5 | 3.4 0.3 | 349 20 | 13.8 1.4 | 20.5 1.0 | 12.7 1.4 |
| 10 | 20080426T23:59:39 | 54583.000 | N | 6.00 | 13.3 | 32.6 | 27.6 4.8 | 40.0 | 4.7 0.4 | 1296 116 | 14.4 1.4 | – | 13.2 1.4 |
| 11 | 20080427T23:35:40 | 54583.983 | N | 7.20 | 11.8 | 30.5 | 20.5 2.8 | 26.2 | 6.0 0.4 | 1228 84 | 14.7 1.5 | – | 13.5 1.5 |
| 12 | 20080428T01:37:29 | 54584.068 | N | 7.50 | 15.9 | 32.4 | 32.1 5.9 | 49.5 | 4.6 0.4 | 1478 143 | 14.7 1.5 | 73.2 8.2 | 13.5 1.5 |
| 13 | 20080428T21:35:06 | 54584.899 | N | 6.00 | 9.0 | 28.4 | 20.9 2.3 | 29.2 | 7.4 0.5 | 1544 65 | 14.5 1.4 | – | 13.3 1.4 |
| 14 | 20080428T23:30:10 | 54584.980 | N | 7.20 | 11.0 | 20.2 | 18.5 2.1 | 22.0 | 5.3 0.4 | 982 38 | 14.0 1.4 | 100.0 4.3 | 12.8 1.4 |
| 15 | 20080429T21:07:54 | 54585.881 | N | 5.70 | 13.3 | 26.2 | 21.2 2.4 | 26.0 | 5.2 0.4 | 1104 39 | 13.8 1.4 | – | 12.7 1.4 |
| 16 | 20080429T22:46:16 | 54585.950 | N | 6.70 | 7.8 | 20.1 | 18.4 1.5 | 23.2 | 5.8 0.4 | 1069 13 | 13.9 1.4 | 77.6 1.8 | 12.8 1.4 |
| 17 | 20080501T23:45:27 | 54587.999 | N | 6.50 | 9.0 | 26.9 | 23.2 2.6 | 25.5 | 5.7 0.4 | 1324 56 | 11.8 1.2 | – | 10.8 1.2 |
| 18 | 20080507T19:12:39 | 54593.800 | N | 6.75 | 11.5 | 27.7 | 24.6 2.9 | 40.5 | 5.2 0.4 | 1277 51 | 12.5 1.3 | – | 11.5 1.3 |
| 19 | 20080510T02:45:24 | 54596.115 | N | 9.00 | 12.6 | 29.7 | 26.1 4.0 | 37.8 | 4.5 0.4 | 1173 74 | 13.5 1.3 | – | 12.4 1.3 |
| 20 | 20080517T16:37:04 | 54603.692 | N | 5.25 | 10.7 | 17.5 | 17.4 1.6 | 26.2 | 5.7 0.4 | 990 21 | 12.0 1.2 | – | 11.0 1.2 |
| 21 | 20080519T10:36:34 | 54605.442 | N | 6.25 | 5.9 | 37.2 | 29.2 6.0 | 43.5 | 4.4 0.4 | 1286 149 | 12.3 1.2 | – | 11.3 1.2 |
| 22 | 20080519T12:25:58 | 54605.518 | N | 7.50 | 9.6 | 28.0 | 22.6 3.0 | 29.0 | 4.4 0.4 | 993 42 | 12.2 1.2 | 80.4 4.6 | 11.2 1.2 |
| 23 | 20080521T02:32:06 | 54607.106 | N | 6.50 | 8.4 | 22.9 | 18.9 1.8 | 24.5 | 7.4 0.5 | 1398 39 | 12.3 1.2 | – | 11.3 1.2 |
| 24 | 20080522T13:55:32 | 54608.580 | N | 6.50 | 8.3 | 25.8 | 21.5 2.1 | 26.0 | 6.1 0.4 | 1310 43 | 12.1 1.2 | – | 11.1 1.2 |
| 25 | 20080607T07:02:53 | 54624.294 | N | 7.00 | 17.5 | 36.2 | 31.5 6.1 | 40.0 | 4.3 0.4 | 1355 135 | 13.6 1.4 | – | 12.5 1.4 |
| 26 | 20080609T05:50:35 | 54626.243 | N | 7.00 | 10.5 | 37.2 | 35.3 6.7 | 47.0 | 4.7 0.4 | 1660 174 | 14.2 1.4 | – | 13.0 1.4 |
| 27 | 20080611T00:38:29 | 54628.027 | N | 5.50 | 8.7 | 23.9 | 21.5 1.9 | 24.5 | 6.4 0.4 | 1374 36 | 15.5 1.5 | – | 14.2 1.5 |
| 28 | 20080612T05:06:52 | 54629.213 | N | 8.00 | 10.0 | 31.8 | 27.5 5.0 | 36.0 | 4.3 0.4 | 1184 107 | 15.9 1.6 | – | 14.6 1.6 |
| 29 | 20080613T12:33:43 | 54630.523 | N | 7.50 | 7.1 | 21.5 | 20.7 2.0 | 26.5 | 6.0 0.4 | 1241 36 | 16.0 1.6 | – | 14.7 1.6 |
| 30 | 20080615T00:12:29 | 54632.009 | N | 7.00 | 7.5 | 30.2 | 27.3 4.3 | 38.0 | 4.1 0.3 | 1118 94 | 16.4 1.6 | – | 15.0 1.6 |
| 31 | 20080616T20:03:02 | 54633.836 | N | 9.00 | 10.0 | 29.5 | 25.5 3.4 | 39.0 | 4.0 0.3 | 1021 60 | 16.4 1.6 | – | 15.0 1.6 |
| 32 | 20080617T21:48:55 | 54634.909 | N | 8.00 | 10.1 | 30.9 | 27.1 3.6 | 38.5 | 3.9 0.3 | 1055 61 | 18.4 1.8 | – | 16.9 1.8 |
| 33 | 20080717T08:25:41 | 54664.351 | Y | 2.25 | 3.4 | 10.3 | 8.9 0.6 | 8.5 | 9.6 0.6 | 853 8 | 4.6 0.5 | – | 4.2 0.5 |
| 34 | 20080717T11:41:00 | 54664.487 | N | 3.75 | 2.4 | 6.7 | 7.7 0.6 | 8.5 | 6.3 0.4 | 486 7 | 4.6 0.4 | 110.7 3.6 | 4.2 0.4 |
| 35 | 20080719T08:38:07 | 54666.360 | Y | 3.00 | 3.7 | 10.9 | 9.6 0.7 | 9.5 | 9.5 0.6 | 911 9 | 3.9 0.4 | – | 3.6 0.4 |
| 36 | 20080729T18:49:21 | 54676.784 | N | 4.00 | 7.2 | 17.1 | 17.7 1.6 | 17.0 | 5.1 0.4 | 902 11 | 3.9 0.4 | – | 3.6 0.4 |
| 37 | 20080814T10:13:10 | 54692.426 | N | 5.00 | 6.2 | 17.5 | 16.7 1.5 | 16.5 | 4.9 0.4 | 817 5 | 3.6 0.4 | – | 3.3 0.4 |
| 38 | 20080903T06:50:42 | 54712.254 | N | 3.25 | 6.6 | 18.8 | 13.1 1.0 | 16.0 | 7.4 0.5 | 972 6 | 3.5 0.3 | – | 3.2 0.3 |
| 39 | 20080904T08:37:38 | 54713.359 | N | 4.00 | 6.8 | 19.2 | 13.6 0.9 | 17.2 | 6.6 0.4 | 895 5 | 3.3 0.3 | – | 3.0 0.3 |
| 40 | 20080908T09:27:36 | 54717.394 | N | 4.25 | 5.7 | 15.6 | 11.2 0.7 | 15.2 | 8.4 0.5 | 940 5 | 3.1 0.3 | – | 2.8 0.3 |
| 41 | 20080914T00:28:23 | 54723.020 | N | 4.75 | 4.9 | 11.9 | 9.8 0.7 | 12.2 | 7.8 0.5 | 768 5 | 1.9 0.2 | – | 1.7 0.2 |
| 42 | 20080917T16:54:30 | 54726.704 | Y | 5.5 | 4.8 | 16.8 | 11.2 0.8 | 13.5 | 8.0 0.5 | 898 7 | 1.2 0.1 | – | 1.1 0.1 |
| INTEGRAL | |||||||||||||
| (JEM-X: 3-25 keV) | 1 | 5 | |||||||||||
| 1 | 20080406T12:11:12 | 54562.50778 | 3 | 9.7 1.2 | 9.3 1.9 | 20 | 9.2 1.8 | 851 170 | 5.0 0.6 | – | 4.6 0.6 | ||
| 2 | 20080406T18:40:43 | 54562.77827 | 4 | 13.4 3.2 | 13.4 2.7 | 60 | 5.9 1.2 | 788 160 | 5.1 0.6 | 151 30 | 4.7 0.6 | ||
| 3* | 20080408T13:36:28 | 54564.56699 | 7 | 10.7 3.0 | 10.4 5.0 | 25 | 3.8 1.9 | 396 150 | 5.9 0.7 | – | 5.4 0.7 | ||
| 4 | 20080411T16:29:09 | 54567.68691 | 5 | 22.8 3.5 | 21.9 4.4 | 75 | 4.2 0.8 | 921 190 | 8.9 1.0 | – | 8.2 1.0 | ||
| 5 | 20080411T19:45:40 | 54567.82338 | 5 | 25.5 6.1 | 25.0 5.1 | 100 | 5.1 1.0 | 1274 260 | 9.0 1.0 | 83 20 | 8.3 1.0 | ||
| 6 | 20080414T10:13:31 | 54570.42605 | 4 | 8.0? 3.3+ | 4.4 0.8 | 11.1 1.2 | – | 10.2 1.2 | |||||
| 7 | 20080414T13:04:58 | 54570.54512 | 6 | 17.9 3.5 | 17.8 3.6 | 90 | 5.0 1.0 | 889 180 | 11.2 1.2 | 130 30 | 10.3 1.2 | ||
| 8 | 20080417T10:52:07 | 54573.45286 | 3 | 13.8 3.2 | 40+ | 4.2 0.8 | 12.3 1.3 | – | 11.3 1.3 | ||||
| 9 | 20080417T13:21:24 | 54573.55653 | 7 | 23.9 5.0 | 23.0 4.6 | 80 | 4.2 0.8 | 968 200 | 12.3 1.3 | 114 25 | 11.3 1.3 | ||
| 10 | 20080420T10:40:58 | 54576.44512 | 9 | 24.5 5.9 | 24.1 4.8 | 100 | 5.1 1.0 | 1228 260 | 11.3 1.2 | (76 20) | 10.4 1.2 | ||
| 11 | 20080420T12:46:37 | 54576.53237 | 4.5 | 33.1 11.3 | 29.7 5.9 | 75 | 4.0 0.8 | 1186 240 | 11.3 1.2 | 72 15 | 10.4 1.2 | ||
| 12 | 20080818T04:59:14 | 54696.20780 | 5 | 9.3 1.4 | 9.3 1.9 | 50 | 7.9 1.6 | 731 150 | 3.3 0.4 | – | 3.0 0.4 | ||
| 13 | 20080830T03:39:54 | 54708.15201 | 2 | 7.4 1.0 | 9.2 1.8 | 3.6 0.5 | – | 3.3 0.5 | |||||
| 14 | 20080902T03:33:43 | 54711.14841 | 1 | 14.1 1.7 | 13.7 2.8 | 50 | 5.5 1.1 | 753 150 | 3.5 0.5 | – | 3.2 0.5 |
All fluxes and , as well as fluences are bolometric (0.1–200 keV), but for the SuperAGILE burst and Fluence are between 17–25 keV.
a Rise time. b Exponential decay time. c . d : see text section 2.5. e ; is the highest burst peak flux, here erg cm-2 s-1of the Swift burst.
∗ indicates the same burst simultaneously observed by JEM-X (#3) and RXTE (#1).