CHARLES UNIVERSITY IN PRAGUE
Faculty of Mathematics and Physics
ACADEMY OF SCIENCES OF THE CZECH REPUBLIC
Astronomical Institute
![[Uncaptioned image]](/html/1007.5196/assets/x1.png)
Looking into the inner black hole accretion disc
with relativistic models of iron line
Thesis submitted for the degree of Doctor Philosophiae
Mgr. Jiří Svoboda
Supervisor: doc. RNDr. Vladimír Karas, DrSc.
Prague, April 2010
This doctoral thesis was done at the Astronomical Institute of the Academy of Sciences of the Czech Republic during doctoral studies at the Faculty of Mathematics and Physics, Charles University in Prague, in the years 2006-2010.
| Phd student: | Mgr. Jiří Svoboda |
| Study branch: | 4F1 Theoretical physics, astronomy and astrophysics |
| Supervisor: | doc. RNDr. Vladimír Karas, DrSc. |
| Address: | Astronomical Institute |
| Academy of Sciences of the Czech Republic | |
| Boční II/1401a, 141 31 Praha 4 | |
| Czech Republic | |
| Referees: | Prof. Giorgio Matt |
| Roma Tre University | |
| Faculty of Mathematics, Physics and Natural Sciences | |
| Department of Physics | |
| Italy | |
| Prof. RNDr. Zdeněk Stuchlík, CSc. | |
| Silesian University in Opava | |
| Faculty of Philosophy and Science | |
| Department of Physics | |
| Czech Republic |
The defence was held on 23rd June 2010 in front of the committee of the study branch 4F1 Theoretical physics, astronomy and astrophysics at MFF UK, Ke Karlovu 3, 121 16 Praha 2, Czech Republic.
Abstract
X-ray observations of active galactic nuclei and black hole binaries offer a unique laboratory for testing the general relativity in strong gravity regime, for studying accretion physics around black holes, and for constraining properties of accreting black holes. In this Thesis, we discuss black hole spin measurements employing the relativistic iron line profiles in the X-ray domain.
We investigate the iron line band for two representative sources – MCG -6-30-15 (active galaxy) and GX 339-4 (X-ray binary). We compare two relativistic models of the broad iron line, laor and kyrline. In contrast to laor, the kyrline model has the spin value as a variable parameter. However, the laor model can still be used for evaluation of the spin if one identifies the inner edge of the disc with the marginally stable orbit. We realise that the discrepancies in the results obtained with the two models are within general uncertainties of the spin determination using the skewed line profile when applied to the current data. This implies that the spin is currently determined entirely from the position of the marginally stable orbit while the effect of the spin on the overall line shape would be resolvable with higher resolution X-ray missions like IXO (International X-ray Observatory).
We show that the precision of the spin measurements depends on an unknown angular distribution of the disc emission. Often a unique profile is assumed, invariable over the entire range of radii in the disc and energy in the spectral band. However, an improper prescription for the directionality profile affects the parameters inferred for the relativistic broad line model. We study how sensitive the spin determination is to the assumptions about the intrinsic angular distribution of the emitted photons. We find that the uncertainty of the directional emission distribution translates to 20% uncertainty in the determination of the radius of marginally stable orbit.
By assuming a rotating black hole in the centre of an accretion disc, we perform radiation transfer computations of an X-ray irradiated disc atmosphere (NOAR code) to determine the directionality of outgoing X-rays in the 2-10 keV energy band. Based on these computations, we find that from the simple formulae for the directionality, the isotropic case reproduces the simulated data with the best accuracy. The most frequently used limb darkening law favours higher values of spin and, in addition, a steeper radial emissivity profile. We demonstrate our results on the case of XMM-Newton observation of MCG -6-30-15, for which we construct confidence levels of chi-squared statistics, and on the simulated data for the future X-ray IXO mission.
Furthermore, we present a spectral analysis of an XMM-Newton observation of a Seyfert 1.5 galaxy IRAS 05078+1626 being the first X-ray spectroscopic study of this source. The lack of the significant relativistic blurring of the reflection model component suggests the accretion disc to be truncated at a farther radius (inner disc radius ).
As a by-product of our reduction of the XMM-Newton data, we find that a careful treatment of the raw instrumental data is necessary to obtain the highest quality data. As a crucial step, we consider the correct re-binning of the data reflecting the energy resolution of the used instrument. Photon pile-up is another problem which may occur in the data of very bright sources, and it may significantly affect the spectral shape.
In summary, we found relativistic iron line
models to be a feasible method for measuring the
spin of black holes at all scales – from solar-mass
microquasars to giant black holes of billions solar masses
in distant quasars. Some useful constraints on spin are achievable
already from X-ray spectra of currently operating instruments.
However, our simulations with the tentative
IXO response show a significant improvement
in the accuracy of spin measurements in the future.
Keywords: black holes - accretion disc - active galaxies - Galactic X-ray binaries
Acknowledgements
This Thesis would not be completed without a big help from my colleagues, friends and family to whom I would like to express my hearted thanks.
First of all, I would like thank to my Supervisor, doc. Vladimír Karas, for giving me many ideas for the work presented in this Thesis, and for introducing me to an international scientific community. I owe very much to my collaborators of our two articles in the Astronomy and Astrophysics journal. Hence, after Vladimír Karas, I would also like to thank Michal Dovčiak (from the Astronomical Institute of the Academy of Sciences), Matteo Guainazzi (from the European Space Astronomy Centre of ESA in Madrid), and René Walter Goosmann (currently at Strasbourg University but sharing the office with me in Prague 2006-2008) for their scientific ideas.
I am indebted to my parents who supported me in the education from my childhood and helped me to establish my new settlement in Prague. I owe very much to my mother Jana who regrettably deceased two years ago. I dedicate this work to memory of her. I am grateful to my father Antonín to encourage me to have astronomy as my hobby and to study it at the University. I would also like to thank my brother Antonín and all my friends who have shared my enthusiasm for astronomy with me. I am grateful for all the discussions which we had about astronomy, black holes or theory of relativity, because the genuine interest of my friends and relatives encouraged me in this work very much.
My warmest thanks belong to Lucie, my future wife, for her tireless psychological support and for her patient listening to me when I was bothered about any problem. She helped me significantly to overcome the most difficult moments of my life. Without her support, I would perhaps never finish my Thesis. In a similar way, I would like to thank my recently found new family.
I appreciate discussions with my colleagues at the Prague’s department of the Astronomical Institute of the Academy of Sciences, especially the members of the Prague Relativistic Astrophysical Group and “pidi”-seminar group. I owe a lot to Michal Dovčiak and Mirek Křížek for helping me with the technical computational stuff. I am very grateful to Michal Dovčiak, Ivana Stoklasová – Orlitová, Jirka Horák and Ondřej Kopáček for careful reading of some parts of the Thesis.
I acknowledge the Astronomical Institute of the Academy of Sciences of Czech Republic for providing me a stimulating work environment and appropriate computational equipment. Further, I acknowledge the financial support of the student research grant of the Charles University (ref. 33308), the doctoral student program of the Czech Science Foundation (ref. 205/09/H033), the ESA Plan for European Cooperating States (project No. 98040), the Centre for Theoretical Astrophysics (project No. LC06014), and the grant of the Czech Ministry of Education, Youth and Sports (project No. ME09036).
Preface
In questions of science the authority of a thousand is not worth the humble reasoning of a single individual.
Galileo Galilei, 1632
Black holes are objects which were first created in minds of theoretical astrophysicists, and for a long time, they were not supposed to exist in the real Universe, in the endless world of stars and planets. Even Albert Einstein who developed the theory, which allowed the existence of black holes, did not believe that the nature would be so crazy to give permission to such objects to form. However, theoretical astrophysicists calculating the details of the stellar collapse, such as Chandrasekhar, Oppenheimer, Snyder etc., predicted that the collapse of too massive stars could not be stopped by any means and that it must go on to create space-time singularities, which were later named by Wheeler as black holes. Meanwhile, with no idea of connection, astronomers classified radio bright galaxies as a peculiar group distinguished from the standard galaxies by extremely strong radio power. Presently, we generally believe that accretion on a rapidly rotating super-massive black hole is the process behind such an enormous power.
The first suggestions of black holes as real celestial objects came with the development of X-ray astronomy in 1960s. Riccardo Giaconni, one of the pioneers of X-ray astronomy, won the Nobel prise in physics in 2002 for opening the X-ray window to the Universe. The discoveries of pulsars, quasars and X-ray binaries started a fruitful life of a new branch of astronomy, astronomy of ultra-compact objects. Since that time, black holes have fascinated many people around the world, not only scientists. Studying these objects brings light to the physics of stellar collapse, galaxy formation, accretion physics and behaviour of matter in the strong gravitational field.
Astrophysical black holes are actually very simple objects being characterised only by their mass and angular momentum (spin). In the current knowledge, it seems that there are two populations of black holes according to their mass – stellar black holes of mass of several solar masses and super-massive black holes of mass of millions to billions solar masses. The distribution of their spin is still unknown. Measuring the spin is difficult because the effect of the spin quickly decreases with the growing distance from the black hole. Matter feels the black hole spin only within several gravitational radii. However, the black hole spin plays an important role in black hole energetics and evolution. The spin is assumed to be responsible for generation and up-keeping of the powerful relativistic jets. The information about the spin value on a statistically significant sample of black holes is important in the understanding of formation and growth of black holes. It can significantly help to answer the question if the observed spin value is natal or if the rotating black holes are spun-up via accretion.
The innermost parts of black hole accretion discs can be uncovered in high energetic radiation, such as X-rays or -rays. This is for two reasons. First, such an energetic radiation can originate only under the extreme conditions close to a black hole. Second, any weaker radiation is often efficiently absorbed by surrounding matter and cannot reach a distant observer. Fast development of X-ray detectors in the last two decades has allowed astronomers to provide spectra with an unprecedented sensitivity, and so constrain accretion flows within a few gravitational radii and measure the black hole spin. There are currently several methods of spin measurements. Modelling of relativistic iron line represents one of them, and it is particularly suitable because it is applicable to black holes at all mass scales.
In this Thesis, we will look into the inner black hole accretion disc with relativistic models of iron line. In Section 2, we summarise the basic concepts of this method, and compare two models which employ different ways to determine the spin value. In Section 3, we study in detail the role of the angular emissivity on the spin value measurement. Both analyses are provided on the current XMM-Newton data whose reduction is described in Section 4, and on the simulated data of a next generation X-ray mission with a significantly higher energy resolution. In Section 4, we also present the results of our X-ray spectroscopic study of the Seyfert 1.5 galaxy IRAS 05078+1626, which represents the first X-ray spectroscopy measurement of this source. The achieved results are discussed at the end of each Chapter. Main conclusions of the Thesis are summarised in Section 5. Future perspectives are pronounced in Section 6.
Most of the results presented in the Thesis were published in two papers in Astronomy and Astrophysics journal (Svoboda et al. 2009; Svoboda, Guainazzi & Karas 2010), and several proceedings (Svoboda et al. 2008a, b; Svoboda 2009).
In Prague, April 2010
Jiří Svoboda
Chapter 1 Introduction
1.1 Black holes
Black holes are regions of space-time in which the gravitational well is so deep that no particle or even light can escape. First ideas of existence of such objects from which a distant observer cannot get any signal due to the escape velocity greater than speed of light were formulated by Michell (1784) and Laplace (1799) (recent English translation can be found in Stephani 2003). However, real foundations for black hole theory were laid by discovery of general theory of relativity by Einstein (1916). The first exact solution of Einstein’s equations describing a black hole was found by Schwarzschild (1916) for a point mass assuming spherical symmetry. The radius of the event horizon is accordingly called Schwarzschild radius:
| (1.1) |
where is the gravitational radius which is equivalent to the mass if the geometrised units with are used. The Schwarzschild metric in Schwarzschild coordinates is:
| (1.2) |
where , is the time measured by an observer at infinity at rest, is the radial coordinate, is latitude, and is the azimuthal angle.
The solution for rotating black holes was found almost half a century later by Kerr (1963). The Kerr’s metric in the Boyer-Lindquist spheroidal coordinates () and geometrised units is (e.g. Misner, Thorne & Wheeler 1973, chap. 33):
| (1.3) |
where the metric functions are: , , , and ; denotes the specific rotational angular momentum (spin) of the central body.
The conversion factor from the angular momentum (in physical units) to the angular momentum (in geometrical units) reads: . The geometrised dimension of is the square of the length [cm2]. It is convenient to make all geometrised quantities dimensionless by scaling them with the appropriate power of mass . The dimensionless specific angular momentum, , spans the range , where the positive/negative value refers to the motion co/counter-rotating with respect to the -coordinate. We will further assume co-rotational motion only (). The magnitude of is thought to be less than unity in order to have a regular horizon and avoid the case of naked singularity. The value of the outer horizon is:
| (1.4) |
For the Keplerian angular velocity of the orbital motion, we obtain (Bardeen, Press & Teukolsky 1972):
| (1.5) |
For the linear velocity with respect to a locally non-rotating observer, we have:
| (1.6) |
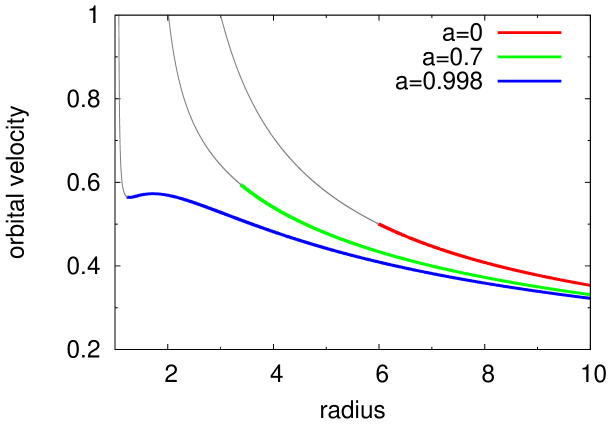
The velocity at the marginally stable orbit reaches a considerable fraction of the speed of light (=1) and has a similar value for any value of the angular momentum, see Figure 1.1. For large spin, a small dip develops in the velocity profile near the horizon. Although it is an interesting feature (see Stuchlík et al. 2005), its magnitude is far too small to be recognised with current observational facilities.
The Schwarzschild and Kerr metric represent solutions of Einstein’s equations relevant for astrophysical black holes which are assumed to be electrically neutral. Nevertheless, they can be further generalised by taking of the electric charge into the consideration. The corresponding solutions are Reissner-Nordström metric for a non-rotating charged black hole, and Kerr-Newman metric for a rotating charged black hole, respectively. Besides the mass, angular momentum and electric charge, black holes do not have any other parameters, which is often called “no-hair theorem” (this statement gets its name from a comment by the famous astrophysicist John A. Wheeler 1968, see also Misner, Thorne & Wheeler (1973)).
1.2 Marginally stable orbit
The marginally stable orbit (), sometimes also called innermost stable circular orbit (ISCO), is the closest orbit to the centre of a black hole where the orbit of a test particle is stable. Below this orbit, only unstable or unbound orbits coming from infinity may occur.
The position of ISCO depends on the value of the spin (Bardeen, Press & Teukolsky 1972):
| (1.7) |
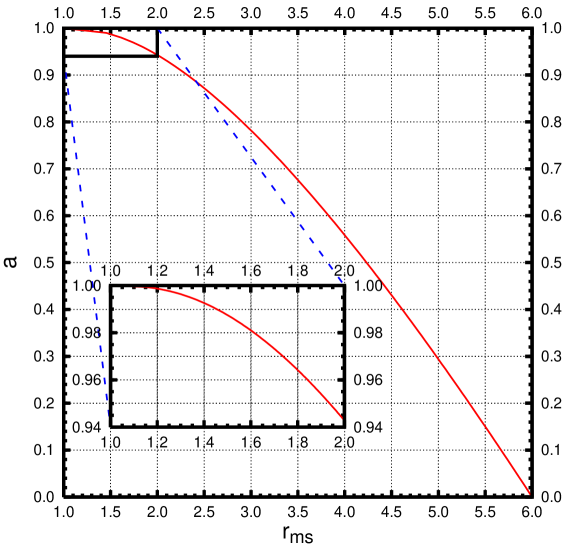
and . Notice that spans the range of radii from for (the case of a maximally co-rotating black hole) to for (static black hole). Figure 1.2 illustrates the relation (1.7) graphically. It is generally supposed that the rotation of the astrophysical black holes is limited by an equilibrium value, , because of capture of photons from the disc (Thorne 1974). This translates to . For a hypothetically higher value of the spin than , the radius of the marginally stable orbit decreases to and then increases again (Stuchlík 1980).
The ISCO is an important quantity in the standard accretion disc theory because the inner edge of the accretion disc is assumed to coincide with it. However, this may not be satisfied precisely under realistic circumstances (Beckwith, Hawley & Krolik 2008). The magnitude of the resulting error on spin measurements (see Section 1.5.2) was constrained recently by Reynolds & Fabian (2008) who applied physical arguments about the emission properties of the inner flow. It is very likely that this discussion will have to continue for some time until the emission properties of the general relativistic MHD flows are fully understood.
1.3 Black hole accretion
1.3.1 Accretion power
Black holes are interesting objects for the theoreticians since they represent a natural laboratory for testing the theory of general relativity, but they are also important objects for astronomers due to their interaction with the surrounding matter. Nowadays, black holes cannot be observed directly as the sensitivity of gravitational wave detectors is still insufficient. However, there is an increasing amount of observations of the electromagnetic radiation of the matter accreting on black holes. These observations can constrain the black hole parameters as well as the accretion physics.
The accretion power is due to conversion of the gravitational potential energy into radiation. For a body of mass M and radius we can estimate the energy released by the accretion of a particle with mass as:
| (1.8) |
We can compare the power of the accretion process with the energy output by nuclear fusions. In the case of hydrogen burning, we obtain . For a neutron star with and km, the energy output by accretion on the stellar surface is . This means that more energy per a mass unit is released by the accretion on a compact object than from the nuclear synthesis. Accretion onto super-massive black holes in quasars powers the most luminous sources in the Universe.
The maximal luminosity produced by the spherical accretion on a star is restricted by the Eddington limit:
| (1.9) |
where is the mass of a proton (i.e. a nucleus of hydrogen) and is Thomson cross section. The Eddington luminosity represents the highest possible luminosity on the conditions of spherically symmetric accretion and totally ionised accreting material. In this case, the opacity is dominated by electron scattering and we suffice only with Thomson cross section. 111The radiation influences mostly electrons which are of the less mass than protons, vice-versa the gravity more attracts the massive particles. Electrons and protons hold together due to electromagnetic interaction. For accretion powered objects the Eddington limit implies a limit on the steady accretion rate.
If all the kinetic energy of infalling matter is conversed to radiation at the surface of the central body, then the accretion luminosity is given by:
| (1.10) |
In the case of black hole accretion, the radius does not refer to the surface but a natural choice is a Schwarzschild radius. The uncertainty of the value of the luminosity can be parametrised by a dimensionless efficiency (Shakura & Sunyaev 1973; Soltan 1982), which measures how efficiently the rest mass energy of the accreted material is converted to radiation:
| (1.11) |
Comparing eq. (1.11) with energy released by the burning of hydrogen we get for nuclear synthesis. Shakura & Sunyaev (1973) mentioned in the case of Schwarzschild’s metric, and in Kerr’s metric can achieve . The estimation of realistic value for in black hole accretion is an important problem, a reasonable guess for it would appear to be (Yu & Tremaine 2002; Elvis, Risaliti & Zamorani 2002; Marconi et al. 2004).
1.3.2 Accretion discs
The dominant accretion process for compact objects involves disc accretion. Most of the accreting matter, which is gas supplied by a donor star in binary systems or the host galaxy in quasars, possesses sufficient angular momentum to go into the orbit around the black hole, forming an accretion disc. The previous relations calculated for spherically symmetric case will serve as convenient approximations and estimations. Accretion disc physics includes many processes, including gravity, hydrodynamics, viscosity, radiation and magnetic fields. The angular momentum of matter in an accretion disc is gradually transported outwards by stresses (turbulent, magnetic, etc.). The time scale for redistributing angular momentum is long compared with either the orbital or radiative time scales, which allows matter to gradually spiral inwards.
Steady thin accretion discs (Shakura-Sunyaev)
Steady thin accretion discs represent the standard disc solution found by Shakura & Sunyaev (1973). The model is applicable when the characteristic values of luminosities are sub-Eddington, , i.e. when the vertical component of the thermal disc radiation alone cannot support the matter against gravity at substantial altitudes above the disc plane. This condition may be violated if the thermal motion is predominant. The thermal criterion for the Shakura-Sunyaev thin disc is:
| (1.12) |
where J K-1 is the Boltzmann constant, is the gas temperature, and is the mean mass per particle. When the condition (1.12) is not fulfilled, luminosities may reach Eddington values, , and the radiation-pressure force becomes comparable to that of the gravity. The height of the disc ceases to be small and the thick-disc solution needs to be considered.
When the assumption of geometrical thinness is justified, only radial advection is dominant and the equations for the conservation of mass and angular momentum can be written as:
| (1.13) |
and
| (1.14) |
where
| (1.15) |
defines the torque, is the surface density, is the velocity in the radial direction, and is the kinematic viscosity. Combining eqs. (1.13) - (1.15) and using eq. (1.5) we obtain the equation governing time evolution of surface density in the Keplerian disc:
| (1.16) |
The kinematic viscosity may be a function of local variables in the disc. The eq. (1.16) has the form of non-linear diffusion equation governing the behaviour of . Given a solution for the radial velocity is:
| (1.17) |
Finally, we need some prescription for to close the system of equations and to fully determine the radial structure of the accretion disc. All of the qualities currently ignored, such a detailed micro-physics, enter into the problem via . After radial integration of the equations (1.13) and (1.14) and assuming time-steady discs (), we get:
| (1.18) |
and
| (1.19) |
At , the viscous torque vanishes. It is generally assumed that this radius coincides with the marginally stable orbit because below it the matter losses the centrifugal support.
The essential idea of the accretion process is dissipation of energy. The dissipation is caused by viscous torques and is given by:
| (1.20) |
Using eq. (1.15) we obtain:
| (1.21) |
For the Keplerian steady disc, we get the relationship for independent of :
| (1.22) |
The luminosity produced by the disc between radii and is given by:
| (1.23) |
and using eq. (1.22):
| (1.24) |
Setting and , we obtain the luminosity for the whole disc:
| (1.25) |
The thin disc is characterised by no motions or accelerations in the -direction and the relevant Euler’s equation has the form:
| (1.26) |
where is the pressure. For a thin disc we can write:
| (1.27) |
where is the typical vertical scale height of the disc. From eq. (1.27) we can estimate the thickness of the disc as:
| (1.28) |
where is the local Keplerian velocity and is the sound speed. Hence, we can write the criterion for the thin disc as:
| (1.29) |
It means that the accretion disc is geometrically thin when the Keplerian velocity is highly supersonic.
The total pressure of the disc is the sum of gas and radiation pressure. The equation of state has the form:
| (1.30) |
The relationship for the central temperature can be derived from evaluating the heat loss per unit area by the radiative transport with the thermal energy by viscous dissipation given by eq. (1.22):
| (1.31) |
where is the optical depth of the disc, which can be defined as:
| (1.32) |
where is the total Rosseland mean opacity. For hot discs around compact objects, free-free transitions and Thomson scattering contribute mostly to the opacity. The above estimation of the central temperature value is valid only for the case of an optically thick disc with .
Up to now, we have considered equations of the mass conservation, the angular momentum conservation, energy conservation, hydrostatic equilibrium, equation of state, and equation of radiative transport for the thin steady disc. In order to study the detailed physical structure of such a disc, or any aspect of its time-variability, as well as stability, the knowledge of the viscosity is required. A simple and very useful model of the viscosity is -model (Shakura & Sunyaev 1973):
| (1.33) |
where is a dimensionless parameter, which can take the value from to . In the first approximation, is a constant for a given accretion disc.
The viscous stress exerted in the -direction can be defined for a Keplerian disc as:
| (1.34) |
where is the coefficient of dynamic viscosity. For turbulent motion, it can be expressed as:
| (1.35) |
where is the matter density, is the velocity of turbulent cells relative to the mean gas motion and is the size of the largest turbulent cells (Landau & Lifshitz 1959; Shapiro & Teukolsky 1983). Using eq. (1.28) we can estimate the value of viscosity stress as:
| (1.36) |
In general, we may write:
| (1.37) |
where is the same parameter as in eq. (1.33). From eq. (1.17), the radial velocity can be expressed by this model as:
| (1.38) |
Thus, the radial inflow is very subsonic.
The steady thin disc solution (or also called Shakura-Sunyaev’s solution) allows to express the central density , the surface density , the central pressure , the disc height , the radial drift , the central temperature , and the optical depth as functions of the parameters , and .
Accretion flows in sub- and super-Eddington regime
The condition for the steady thin disc accretion is not always accomplished. The accretion rate is the main factor which constrains the shape of the accretion flow. In the low (sub-Eddington) accretion regime, the cooling mechanism via radiation ceases to be sufficiently efficient and advection mechanism takes place instead (Ichimaru 1977; Narayan & Yi 1994; Abramowicz et al. 1995; Narayan & McClintock 2008, and references therein). In the super-Eddington regime, the gas pressure is strong enough to expand significantly the disc vertically and the height of the disc needs to be taken into account (Abramowicz et al. 1988; Yuan 2001; Sa̧dowski 2009).
Generally, we may write the energy conservation equation per unit volume as:
| (1.39) |
where is the density, is the temperature, is the entropy per unit mass, is the time, and and are the heating and cooling rates per unit volume. Since all the entropy stored in the gas is advected with the flow, the left-hand of eq. (1.39) may be replaced by a quantity which represents cooling rate via advection. The heat energy released by viscous dissipation is partially lost by radiative cooling and partially by advective cooling :
| (1.40) |
For the Shakura-Sunyaev thin disc is . If, oppositely, , the gas is radiatively inefficient and the accretion flow is under-luminous (). Such an accretion flow is known as ADAF (advection-dominated accretion flow), or RIAF (radiatively inefficient accretion flow).
There are two distinct regimes of advection-dominated accretion flow. The first one occurs when the cooling time scale is much larger than the accretion time scale, . It is the standard case of the ADAF, a self-similar solution of which is described by Narayan & Yi (1994). The second regime corresponds to very high scattering optical depth when the radiation is unable to diffuse out of the system, i.e. the photon diffusion time is much larger than the accretion time scale, . This radiation-trapped regime was briefly discussed by Begelman (1979) and then developed in detail by Abramowicz et al. (1988) as the “slim disc” model.
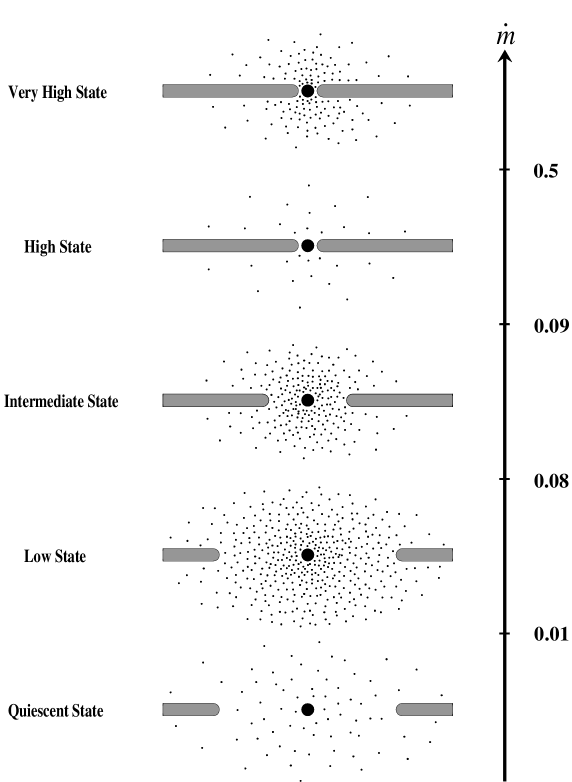
Accretion state of an accretion disc evolves in time because the accretion rate varies and the accretion flow regimes interchange accordingly. We know from the observations that the black hole binaries change the spectral properties rapidly and several different X-ray states were defined (for review see Remillard & McClintock 2006, and references therein). A close connection between the states and accretion flow regimes was discussed by Esin, McClintock & Narayan (1997). The value of the accretion rate is the main criterion for appearance of a certain X-ray state. Their schematic sketch is shown in Figure 1.3, which illustrates the link between the accretion states and the mass accretion rate. However, this simple picture is rather far from the complete description of the spectral states behaviour, not taking into account dynamic properties of the corona including strong flares, hysteresis of the states when interchanging etc.
The main conclusion of the unification scheme is that below some critical value of the accretion rate, such as (Esin, McClintock & Narayan 1997), the accretion disc does not extend to the innermost stable orbit, but, instead, it is truncated at some further radius whose position is inversely proportional to the accretion rate. The standard thin (Shakura-Sunyaev) accretion disc occurs only in the high state. In the very high state, the radiation pressure inflates the disc in the close neighbourhood to the black hole, and consequently, the advection plays again an important role in the inner flows (slim disc solution).
Thermal radiation of accretion discs
The radiation temperature follows from thermodynamical considerations:
| (1.41) |
where is the Planck constant and is the mean frequency. The value of this temperature can be estimated by comparing it with the black-body temperature and the thermal temperature :
| (1.42) |
| (1.43) |
where is the Stefan-Boltzmann constant. These temperatures are two extreme cases for . If the accretion flow is optically thick, the radiation reaches thermal equilibrium before escaping and . On the other hand, if the conversion to radiation is direct (from optically thin material), then . It gives the limits for the radiation temperature:
| (1.44) |
For a solar-mass neutron star we will give the range for photon energy:
| (1.45) |
Thus, we can expect accreting neutron stars and black holes to appear as X-ray emitters, or possibly -ray sources.
If we suppose that the viscously dissipated energy (eq. 1.22) is radiated as a black-body spectrum (Shakura-Sunyaev disc), using eq. (1.42) we get the relationship for the surface temperature of the disc:
| (1.46) |
For a fixed ratio between the source luminosity and Eddington limit and a scaled radius the temperature of the disc depends on the mass as:
| (1.47) |
The temperature of the innermost region of an accretion disc surrounding a solar-mass black hole is K. Using eq. (1.41), the corresponding spectral energy is keV. Thus, the thermal component of the black hole accretion disc in an X-ray binary occurs in the soft X-rays. For a super-massive black hole, the accretion disc temperature is K for the mass range . The thermal disc component has its maximum in the ultraviolet energy band and the spectral energy is keV for , and keV for .
Time dependent discs
Accretion discs are fueled by a variable amount of the accreting matter, and thus, the time variability of accretion discs is a natural consequence. Let us estimate different time scales: dynamical, thermal and viscous. The dynamical (or orbital) time scale can be defined as:
| (1.48) |
The thermal time scale, on which the dissipated energy is radiated from the accretion disc, is given by:
| (1.49) |
The viscous time scale which is linked with the redistribution of the angular momentum is defined as:
| (1.50) |
Comparing the time scales we get for a thin disc:
| (1.51) |
On dynamical time scales we can well consider the temperature and parameter independent of time. Although the -prescription is very successful in many applications, there are some limitations of this approach. Especially, the presence of the magnetic field plays an important role in the accretion disc stability. The present-day theoretical models assume that the turbulence, which is responsible for the angular momentum transport, may be due to a magneto-rotational instability (Balbus & Hawley 1991).
1.3.3 Accretion disc atmosphere and disc reflection
X-ray emission of both, black hole binaries and active galaxies, is characterised by a power-law component with an exponential cutoff at high energy ( keV). Its origin is suggested to be due to multiple inverse Compton scatterings of the “seed photons” from the accretion disc (UV photons in the case of AGN, soft X-ray photons in the case of black hole binary) in the optically thin accretion disc atmosphere, so called “corona” (Thorne & Price 1975; Haardt & Maraschi 1991). The corona is believed to consist of hot relativistic electrons which are possibly heated up by the magnetic dissipation processes. These processes may be caused by amplification of the magnetic field due to convective motions and differential rotation within a hot inner region of the accretion disc, resulting into flaring events in the places of magnetic re-connections (Galeev, Rosner & Vaiana 1979; Haardt, Maraschi & Ghisellini 1994; Czerny & Goosmann 2004).
Geometrical properties of the corona are still uncertain, as well as the distribution of the Comptonising electrons (thermal, non-thermal, or mixed). The corona might be “sandwiching” the accretion disc (Haardt & Maraschi 1991), or rather be locally centralised with a typical size of a few of . In this geometry (“sphere + disc”), the corona is irradiated by soft photons from the cooler outer parts of the accretion disc (Shapiro, Lightman & Eardley 1976; Haardt, Maraschi & Ghisellini 1994; Stern et al. 1995; Dove et al. 1997).
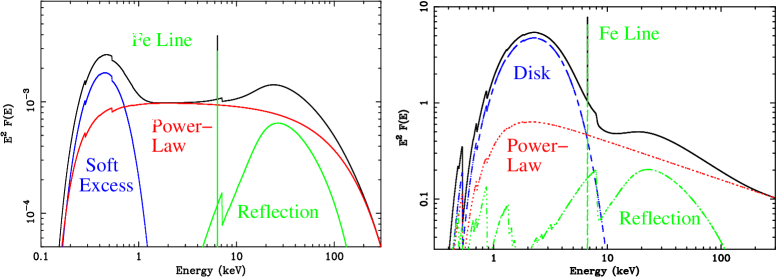
Some X-ray photons produced in the corona may escape directly to the observer and then be detected as the primary power-law radiation, but some of them may illuminate the disc and be reflected from its surface before reaching the observer (Basko, Sunyaev & Titarchuk 1974). The illuminating radiation is partly absorbed in the disc medium and partly re-radiated from the accretion disc. The reprocessed spectrum is characterised mainly by the Compton hump at keV and the fluorescent iron line at keV, as seen in Figure 1.5 or Figure 1.9.
The Compton hump is the result of the increased importance of Compton scattering compared to the bound-free absorption. The cross-section of the bound-free absorption decreases namely with increasing energy (Morrison & McCammon 1983), except for absorption edges, while Compton cross-section is significant up to keV (Lightman & White 1988). This effect makes the overall spectral hardening and forming of the Compton hump (Lightman & White 1988; Guilbert & Rees 1988).

In addition to the reflection continuum, intrinsically narrow features, absorption edges and fluorescent emission lines, are other significant imprints of the reflection from an accretion disc. These spectral features have a great potential in investigation of the properties and localisation of the original source of radiation. They are defined with specific energies and so, detecting of energy shifts and broadening of the features is an important observational tool which allows us to investigate the innermost region of a black hole accretion disc.
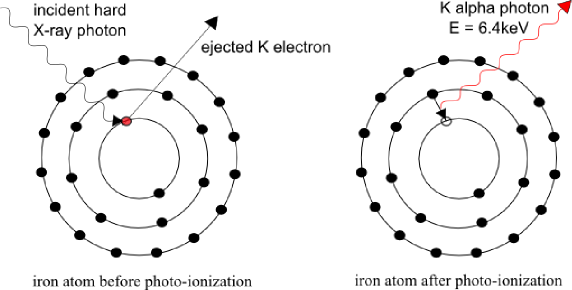
A schematic picture of photoionisation followed by production of an X-ray photon is shown for the case of a neutral iron atom in Figure 1.4. The incident radiation must have high energy (hard X-ray) to be able to kick off an inner electron. The minimal energy of the incident photon is equal to the binding energy of the electron in the atom, and it corresponds to the absorption edge in the reprocessed spectrum. The originally neutral atom is photoionised and the electron vacancy is immediately filled up by an electron dropping down from a higher atomic level, L shell or M shell. This is accompanied by a release of the energy equivalent to the difference between the energy levels either in the form of radiation (fluorescence), or by ejecting of an outer electron (Auger effect). 222The Auger effect may be interpreted as a further, inner, photoionisation. A photon released by dropping down of an electron from higher to lower level (from L to K shell) is absorbed by an outer electron. The photon has enough energy to eject the electron from the atom.
The fluorescent emission line is named according to the shell from which the electron was ejected by the photoionisation, K line if the ejected electron is from the K shell, L line if it is from the L shell etc. Further division follows the origin of an electron filling the vacancy in the inner shell. If it comes from a neighbouring shell a Greek letter is added to the name, and gradually with higher levels (, ,…). The K line, shown in Figure 1.4, means that a K electron was ejected by the photoionisation, and an L-shell electron jumped into the vacancy. This is a more probable transition than filling the vacancy by an M-shell electron. The probability ratio of K to K appearance is well defined quantity and it is about 7.4 : 1. Similarly, if the vacancy by photoionisation is produced in the L shell, L photon is radiated if an M shell electron fills the vacancy.
The probability of the fluorescence occurrence, i.e. probability that an X-ray photon is radiated from the atom after photoionisation, is characterised by the fluorescence yield . This quantity depends strongly on the atomic number, approximately as (e.g. Bambynek et al. 1972). Taking into account cosmic abundances as well, the iron fluorescent lines are expected to be particularly strong. Moreover, the iron K and K lines occur at the energies ( keV and keV, respectively) where both, the thermal radiation of an accretion disc and the reflection continuum (represented mainly by the Compton hump) are minimal, and where only a few absorption lines of lighter elements occur. This all makes the iron K lines to be relatively easily observable spectral features (see left panel of Figure 1.5). Properties of the iron K line in the X-ray illuminated cold accretion disc picture were extensively studied by George & Fabian (1991); Matt, Perola & Piro (1991) and Matt et al. (1992).
The energy and the intensity of the fluorescent line depends significantly on the ionisation state (Ross & Fabian 1993; Matt, Fabian & Ross 1993; Ross & Fabian 2005). The ionisation parameter may be defined as:
| (1.52) |
where is the flux received per unit area of the disc at a radius , and is the co-moving electron number density.
The intrinsic energy of the fluorescent line monotonically increases with higher ionisation state because the binding energies of the inner shells increase with ionisation. In the case of iron, the energy of the K is very close to keV up to Fe XVII, then the energy value increases up to keV for Fe XXV (helium-like iron atom), and finally reaches the value keV for Fe XXVI (hydrogen-like iron atom) when the last electron is ejected by photoionisation and another electron is caught up by the fully ionised atom and drops down to the innermost K shell. The energy of the K photon depends also on the sub-level of the dropping down electron, which makes the K emission line to be a doublet with energies keV and keV. This difference is, however, very small and beyond the resolution abilities of the detectors on-board the current X-ray satellites.
The intensity of the fluorescent line is maximal for . This is due to two effects. First, the fluorescent yield is higher for ionised iron atoms than for neutral ones. Second, the incident radiation which is strong enough to ionise iron atoms is not so much photoabsorbed by dissociated lighter elements. The fluorescence does not occur if all the matter is too highly ionised, so that all electrons are unbound. The iron fluorescent line cannot be produced if . Reflection spectra for different ionisation are shown in the right panel of Figure 1.5.
1.4 Observational evidence of accreting black holes
1.4.1 Stellar-mass black hole binaries
The first black hole candidates to be identified were celestial bodies of small size and mass only a few solar masses, in close orbits to ordinary companion stars emitting intense and rapidly flickering X-rays. This emission is attributed to the radiation of inward-spiralling matter in the form of accretion disc (see Section 1.3.2). The first established black hole binary was Cygnus X-1 (Webster & Murdin 1972; Bolton 1972). This object is persistently bright in X-rays because its companion is a blue super-giant of spectral type O9.7Iab (Walborn 1973) which fuels the accretion onto black hole by large amount. These types of objects are classified as High-Mass X-ray Binaries (HMXBs) and next to the Cygnus X-1, two black hole binaries in the Large Magellanic Cloud, LMC X-1 and LMC X-3, belong to this category.
More frequently observed black hole binaries are, however, Low-Mass X-ray Binaries (LMXBs), or also called X-ray novae, which are transient and change rapidly the spectral state according to the accretion rate of the infalling matter. Two of them are especially remarkable, GRS 1915+105 belongs to the brightest X-ray objects on the sky (excluding the Sun), and since its eruption in August 1992 it remained very bright for more than one decade; and GX 339-4, which undergoes frequent outbursts followed by very faint states. In total, about two dozens of black hole binaries are confirmed and two other dozens are the candidates. For review about X-ray properties of the observed black hole binaries see Remillard & McClintock (2006).
1.4.2 Active galactic nuclei
Another class of the astrophysical black holes are super-massive black holes (SMBH) which settle in the dynamical centres of galaxies. The immense nuclear activity of some galaxies was detected already at 1930s by radiotelescopes, but the spatial resolution was poor to measure the position of the radiation source. In the early 1940s, Carl Seyfert discovered intense nuclear activity together with the presence of highly ionised and extremely broad (up to 8500 km s-1) optical emission lines in a sample of galaxies (Seyfert 1943). Consequently, a new subclass of galaxies, Seyfert galaxies, was established.
Another windows to the Universe, especially X-ray and infrared, revealed that some galactic nuclei are enormously bright compared to the rest of galaxies in the whole spectral energy range. These objects are commonly denoted as Active Galactic Nuclei (AGN). Some AGNs are faint radio sources like M31, but other nuclei, like the one in a quasar 3C 273, belong to radio-loud AGNs, which are characterised by collimated jets of energetic particles spanning millions of light years into the space.
Such an activity of galactic nuclei is attributed to the accretion on the super-massive black hole with the mass of several millions to billions of solar masses, , (Rees 1984). The precise value of the central black hole mass is measured from the velocity dispersion of the stars orbiting near to the centre (see Section 1.5.1 for more details).
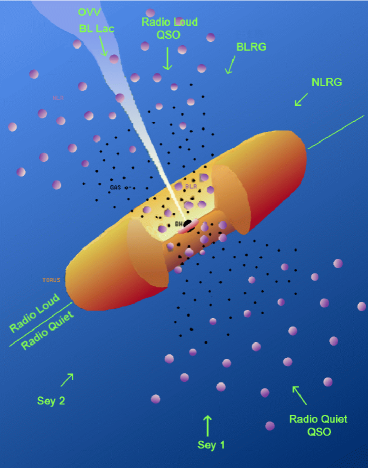
Extensive mapping of properties of the individual AGNs across the whole electromagnetic spectrum lead to the origin of several different empirical AGN subclasses, which gradually evolved into a realisation that a unification into a single family of intrinsically similar active galaxies may be possible (Antonucci & Miller 1985; Antonucci 1993; Urry & Padovani 1995). The different appearance is mainly due to the orientation effect, see Figure 1.6. The activity in the radio spectral energy range, so called “radio loudness”, is the only large distinction, probably connected with the presence or absence of the relativistic jet.
Particularly interesting subclass of the AGNs are Seyfert galaxies which belong to the low-luminosity radio-quiet AGNs. Its significant role in the unification scheme is mainly due to the relatively frequent occurrence at low redshift (close to our Galaxy), which enables a spatial resolution unachievable for the distant quasars. The Seyfert galaxies are divided into two main groups, Seyfert 1 and Seyfert 2, according to the presence or absence of broad lines, especially Balmer lines of hydrogen. According to the unification scenario, as seen in the Figure 1.6, the broad line region of Seyfert 2s is obscured by a torus surrounding the central region as the nucleus is seen under a high value of the inclination.333Standard convention is that the inclination angle is zero when we see the disc/torus along the symmetric axis. We say that we see the disc “face-on”. Oppositely, if the observer is in the disc plane, the inclination is 90 degrees and the disc is “edge-on”. The torus does not enter the line-of-sight between us and the central broad line region when we see the nucleus under a low value of the inclination. The typical value of the inclination angle of Seyfert 1s is around 30 degrees. More sensitive detectors constructed in 1980s enabled fainter division of Seyferts into spectral subclasses (Osterbrock 1989). The spectral type of a Seyfert galaxy may be expressed as (Blandford et al. 1990):
| (1.53) |
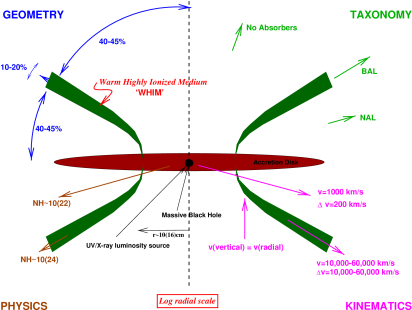
In spite of the unquestionable success of the standard unification scheme by Antonucci (1993), some observational facts are not explained within this standard AGN picture. Especially, broad absorption lines ( 0.1) in about 10 of quasars and highly ionised outflows ( km s-1) in narrow absorption lines in a half of Seyfert galaxies belong to the issues which are beyond the standard picture. Hence, Elvis (2000) proposed a different structure for quasars which can be also applied to other AGNs, see Figure 1.7. The warm highly ionised medium, WHIM, is in the form of an outflow from the disc and has a conical configuration. The opening angle of the cone is about 70-90 degrees and its width is at maximum about 10-20 degrees. If we translate it to the probability of observation of a quasar through the conical sheath then broad absorption lines of the WHIM should be detected in about 10-20 % quasars. This corresponds to the proportional representation of the so called BAL quasars in the observations. The spectra are characterised with high values of column density of the ionised absorber cm-2.
1.4.3 Black hole binaries versus active galaxies: similarities and differences
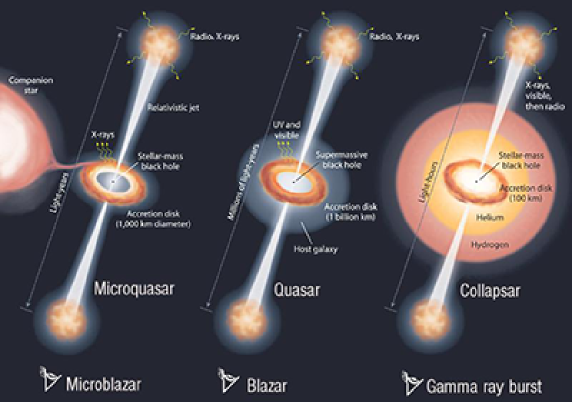
Both, black hole binaries and active galaxies, are powered by black hole accretion. The masses of black holes in binaries and galactic nuclei are very different (see previous Sections). The typical length and time scale differ accordingly (eq. 1.1). However, the physical mechanism of the energy balance seems to be the same, and so, the AGNs can be interpreted as scaled-up Galactic black holes, or vice-versa, Galactic black holes are often called as “microquasars” (Mirabel & Rodríguez 1998). The unified picture of both types of objects is illustrated in Figure 1.8 where another object, collapsar, is added to the same family of accretion powered objects, as well. The collapsar occurs when a massive star undergoes the final gravitational collapse, and it appears only in a short flash. If the jet is aligned with the line-of-sight the objects appear as blazars, microblazars, and gamma ray bursts, respectively.
Besides the similar appearance of AGNs and BHBs the temporal behaviour seems to be the same, only proportionally scaled (McHardy et al. 2006; Uttley 2008). The minimal time scale for the spectral variability is limited by the black hole horizon (eq. 1.1):
| (1.54) |
The typical time scale for stellar-mass black hole binaries is of order of milliseconds, for super-massive black holes in AGNs it is of order of minutes to hours.
The very rapid flux variability is a characteristic feature of both kinds of objects and was constrained in several observations. The RXTE (Rossi X-ray Timing Explorer) satellite is suitable for studying millisecond variability of BHBs (see e.g. the review by van der Klis 2006, and references therein). The variability of AGNs was also reported in several works (see e.g. Iwasawa et al. 1999; Turner et al. 1999; Miniutti & Fabian 2004; Vaughan & Fabian 2004; Uttley & McHardy 2005; Turner et al. 2006; Ponti et al. 2006; Gierliński et al. 2008; de Marco et al. 2009) although more sensitive instruments or longer exposure times would be eligible to increase the accuracy.
The time-averaged spectrum of a black hole binary evolves as the spectral states change, but in general, it may be interpreted as a composition of power-law radiation, thermal multi-colour black-body radiation of the accretion disc (Mitsuda et al. 1984), and reflection radiation from the disc, all absorbed by a local (possibly ionised) matter and the interstellar Galactic gas. The model spectrum of BHB is shown in the right panel of Figure 1.9. The model spectrum of an AGN is very similar (left panel of Figure 1.9), but the thermal component is dominated in the UV energy range, and, thus, it is obscured by the interstellar gas, which is opaque to UV photons. Nevertheless, the high energy tail of a black-body spectrum can reach soft X-rays if the temperature of the disc is high enough. Indeed, a “soft excess” is observed in several Seyfert galaxies which may be interpreted by the thermal radiation of the disc (as shown in the left panel of Figure 1.9).
However, Crummy et al. (2006) and Gierliński & Done (2006) argued that the thermal radiation interpretation is doubtful since the temperature would be the same for a big sample of AGN with distinct masses, and therefore, they suggested alternative explanations. The “soft excess” may be due to reflection by the ionised surface of the accretion disc (Crummy et al. 2006). For a cold disc, the reflection is dominated by a plenty of emission lines in soft X-rays. In this case, the “soft excess” may also occur when the reflection radiation comes from the innermost regions of an accretion disc and the individual lines are blended due to relativistic smearing. Another interpretation of the “soft excess” is that it appears due to the partially ionised and Doppler smeared absorption (Gierliński & Done 2006).
1.5 Measuring black hole parameters
Astrophysical black holes are characterised only by their mass and angular momentum. Although electrically charged black holes also represent the solution of Einstein’s equations, their existence in the Universe is very unlikely since the electromagnetic repulsion is about 42 orders of magnitude stronger than the gravitational attraction. Thus, any charged black hole will be immediately neutralised by an accreting matter.
1.5.1 Mass
Masses of astrophysical black holes are known with relatively good precision and customarily categorised in three groups of stellar-mass black holes (), intermediate mass black holes (–), and super-massive black holes () in galactic nuclei (Casares 2007; Ziółkowski 2008; Vestergaard & Osmer 2009; Czerny & Nikolajuk 2009). The intermediate mass black holes may occur in centres of globular star clusters and represent a plausible explanation of so called ultra-luminous X-ray sources (ULXs) (Kaaret et al. 2001; Miller & Hamilton 2002; Miller & Colbert 2004; Strohmayer & Mushotzky 2009), but their existence has not yet been unambiguously accepted (e.g. King 2004; Soria & Ghosh 2009).
The mass of the black hole in a binary system can be determined from the knowledge of the inclination of the system and the mass ratio between two components of the binary (the mass of the companion star can be estimated from the spectral type of the star). The mass function is given by:
| (1.55) |
where is the orbital period, is the maximal line-of-sight Doppler velocity of the companion star, and is the mass of the companion star, which is usually lower than the black hole mass (if it is not a super-giant as in the case of the Cyg X-1 system).
The mass of black holes in galactic nuclei can be derived from the dynamical properties of the stellar neighbourhood. The first velocity moment of the collisionless Boltzmann equation, the Jeans equation, gives the mass as the function of radius (see e.g. Binney & Tremaine 2008; Camenzind 2007):
| (1.56) |
where is the rotational velocity, are velocity dispersions and is the density of stars. All these quantities are measurable, but several problems exist. First, we observe these quantities projected on the sky, and de-projection is rather complicated process. Second, the most galaxies are not spherically symmetric. The high quality of the data are required. Observations performed by the Hubble Space Telescope can serve to extract the line-of-sight velocity dispersions (LOSVD). Then, an orbit based approach, known as Schwarzschild’s method is applied to de-project the quantities. Finally, maximum entropy models are used to account for axisymmetry instead of the spherical symmetry, and the potential is derived from the profile of the surface brightness. The velocity maps can be achieved with higher precision from microwave maser emission of water molecules (Miyoshi et al. 1995; Greenhill et al. 2002).
In order to estimate the black hole mass one can use the fact that the stars around more massive nucleus orbit with higher velocities. The empirical relation between the black hole mass and velocity dispersion of the nearby stars, “” relation, was found on the sample of galaxies with relatively known values of the central mass (Ferrarese & Merritt 2000; Gebhardt et al. 2000):
| (1.57) |
Earlier, the correlation between the central mass and the bulge luminosity was discovered (Kormendy & Richstone 1995; Magorrian et al. 1998). This relation is often called “Magorrian” relation. It has larger scatter than the “” relation, and hence it is used less often at present. However, both correlations have important implications for theories of the galaxy and bulge formation and the interactions of the stars with the central super-massive black hole.
In fact, the value of the mass determined using such relations is rather an order-of-magnitude estimation than the precise measurement due to the relatively large scatter of the correlations. Our own Galaxy is an exception in the mass determination of black holes in galactic nuclei because it is so close ( ly) that the individual stars orbiting around the central black hole are observed (Eckart & Genzel 1996; Ghez et al. 1998, 2005; Gillessen et al. 2009). The latter one presents the black hole mass to be , where the uncertainty is given by the statistical and systematical error, in which the uncertainty of the distance is included. The suitable view to measure dynamical properties of the closest stars to the Galactic centre is due to the most sensitive infrared detectors at the largest telescopes (VLT, Keck’s telescopes).
Though the infrared observations reveal some accretion activity in the form of the flares (Genzel et al. 2003), there is no observational evidence for a standard Shakura-Sunyaev accretion disc in the Galactic centre. The advection dominated accretion flow is likely to explain the X-ray spectrum and also the luminosity of the Galactic centre (Narayan, Yi & Mahadevan 1995).
1.5.2 Angular momentum (spin)
The mass of a black hole is relatively easy to measure because the attractive gravitational force reaches to the large distance and affects therefore orbital movement of the companion star in a binary system or the surrounding stars and gas in the central region of a galaxy, respectively. More challenging is to measure the value of the spin of a black hole because the spin causes curvature of the space-time in a detectable level only within a few gravitational radii around the black hole. Despite this small outreach, the black hole spin plays an important role in the black hole energetics, especially, it is assumed to be responsible in generating and up-keeping of the powerful relativistic jets (Penrose 1969; Blandford & Znajek 1977). The information about the spin value on a statistically significant sample of black holes is important in the understanding of the formation and the growth of black holes. It can significantly help to answer the question if the observed spin value is natal or if the black hole rotation is accelerated via the accretion (see e.g. King & Kolb 1999; Volonteri et al. 2005).
There are several observational methods which provide a good opportunity to explore the innermost region of an accretion disc, and thus, to constrain the spin value. The summary of them is listed and briefly discussed:
Continuum fitting
In the thin Shakura-Sunyaev disc, the temperature decreases with the distance as given by eq. (1.46). When the innermost edge of the disc corresponds to the last stable circular orbit, which should be the case in at least one accretion state (high/soft), its position can be determined from the spectral fitting of the thermal component. This is the basic concept of the method which is called X-ray continuum fitting method and which was first carried out by Zhang, Cui & Chen (1997) to measure black hole spin.
The temperature does not depend only on the inner edge of the disc, but also on the accretion rate. The thermal spectrum is further distorted by the rotational and gravitational frequency shift, and therefore, the fully relativistic model is acquired for this purpose (Li et al. 2005, kerrbb model). The spectral hardening factor as a function of the Eddington scaled disc luminosity (Davis et al. 2005) and a switch parameter for zero/nonzero torque condition at the inner edge are included in the kerrbb model. The spectral hardening factor (or also called colour correction) plays an important role especially in higher accretion rates (Shimura & Takahara 1995).
Iron K line profile
The iron K line profile originates by the reflection of hard X-rays on the accretion disc surface. The combination of three effects makes the iron K line easily detectable in X-ray spectra of black hole binaries as well as active galaxies. First, the fluorescent yield is higher for heavier elements (, see Section 1.3.3). Second, the relative cosmic abundances of iron are high compared to other heavy elements. And last, the energy of iron K line occurs in the spectral range of a simple continuum (see Figure 1.9).
The profile of the intrinsically narrow emission line is distorted by thermal motion, Compton scattering, Doppler broadening, and relativistic effects on the radiation including relativistic Doppler shift, lensing, gravitational redshift, and time delay (if the radiation source is not steady in time). The Doppler broadening due to the rapid orbital motion and the relativistic effects are much more significant than the thermal or Compton broadening if the emitted radiation comes from the inner region of an accretion disc (within a few hundreds of ), making the line profile extremely smeared even for a non-rotating Schwarzschild black hole (Fabian et al. 1989). The effects are amplified in the case of a rotating black hole since the marginally stable orbit shifts closer to the black hole (see Sec. 1.1 and Fig. 1.2), and are maximal for a maximally rotating black hole (Laor 1991).
The advantage of this method is that the line profile is completely independent of black hole mass, and is widely applicable to BHBs as well as to AGNs (for reviews see Reynolds & Nowak 2003; Miller 2007; Guainazzi 2009). The line profile depends on the source properties – its geometrical position, which is influenced by the black hole spin (the innermost edge of a disc), and orientation. This makes this technique a suitable tool for investigation of the nature of the innermost region of the accretion disc, and also for measurement of the inclination angle of the disc. This method is more widely investigated and discussed in the following Sections of the Thesis.
Quasi-periodic oscillations
X-ray quasi-periodic oscillations (QPOs) are transient phenomena associated with the non-thermal states and state transitions. There are two kinds of QPOs - low frequency quasi-periodic oscillations (LFQPOs) at roughly 0.1-30 Hz in the power density spectra (PDS), and high frequency quasi-periodic oscillations (HFQPOs) at roughly 40-450 Hz in PDS. The typical frequency of HFQPO corresponds approximately to the orbital frequency at the ISCO, and are thus relevant for the spin measurement. Although several models were suggested (e.g. Stella & Vietri 1998; Titarchuk, Lapidus & Muslimov 1998; Abramowicz & Kluźniak 2001; Rezzolla et al. 2003; Török et al. 2005; Horák & Karas 2006), the satisfactory description of QPOs is not well established.
Variability and reverberation
Small size of a “hole” in the inner accretion disc implies the variability on the relatively short time-scales. Temporal changes in the primary radiation are translated to the reflection radiation with a certain time lag . The characteristic time lag is approximately /. A clear evidence for such a lag, a 30 s reverberation lag between direct X-ray continuum and Fe L emission accompanying the relativistic reflection, was reported by Fabian et al. (2009). This measurement was possible thanks to a high overabundance of iron in this particular galaxy and a very long exposure time by XMM-Newton satellite.
Polarimetry
The last method of the spin measurement is via X-ray polarimetry. The polarisation of X-rays from accretion discs around black holes was studied by Lightman & Shapiro (1975). The thermal emission is polarised due to Thomson scattering in a disc atmosphere. Connors, Stark & Piran (1980) showed that the polarisation features are strongly affected by general relativistic effects. Other authors have considered effects of magnetic fields on the resulting polarisation (e.g. Agol, Blaes & Ionescu-Zanetti 1998; Silant’ev & Gnedin 2008). Especially, rotation of the polarisation angle is a sensitive quantity. Recent studies (Dovčiak et al. 2008; Schnittman & Krolik 2009) illustrate how the polarisation features depend on the spin value in the thermal state of an accreting black hole. Although the models capable to compute Stokes parameters of a polarised accretion disc spectrum are ready for use (Dovčiak, Karas & Yaqoob 2004), any X-ray polarimeter useful for this type of measurement has not yet been launched. This method is hence promising in the future.
Chapter 2 Relativistic lines
2.1 Line profiles in strong gravity regime
In classical astronomy, broad emission lines are useful diagnostic tool for measuring of the temperature (thermal broadening) or velocity dispersion (Doppler broadening) of an observed system. However, X-ray spectroscopy of some X-ray binaries and active galaxies has revealed iron fluorescent lines so broad and asymmetric that their profiles cannot be explained in terms of classical physics and instead, a complex fully general-relativistic approach needs to be taken into account (Fabian et al. 1989; Tanaka et al. 1995; Reynolds & Nowak 2003; Nandra et al. 2007; Miller 2007). The broad iron lines are supposed to originate in close neighbourhood of a black hole where the strong gravitational redshift occurs and the orbital velocities reach a considerable fraction of the speed of light (see Fig. 1.1).
2.1.1 Frequency shift
The frequency shift, , is defined as the ratio of the observed frequency to the intrinsic emitted frequency :
| (2.1) |
In high-energy astronomy, energies are usually used instead of frequencies:
| (2.2) |
where J s is the Planck constant, and is the wavelength. Typically used units are kiloelectronvolts ( keV J) for energies, or Angströms ( m) for wavelengths. The conversion relation is:
| (2.3) |
In the case of a rotating accretion disc, the g-factor is a function of the position on the disc and the emission angle . In Newtonian approach:
| (2.4) |
where is the line-of-sight velocity. For Keplerian orbital velocity, .
In special relativistic approach:
| (2.5) |
where is the Lorentz factor. The observed frequency is shifted even when the line-of-sight velocity is zero (, “face-on” disc). Since in this case, the frequency is shifted to lower energy. This effect is called as the transverse Doppler shift.
In general relativity, g–factor may be expressed within the approximation of geometrical optics, in terms of four-momentum of photons and four-velocities (Cunningham 1975):
| (2.6) |
Using (four-velocity of the observer):
| (2.7) |
The frequency shift and the emission angle may be expressed using constants of motion as:
| (2.8) |
where , ; and are constants of motion connected with symmetries of the Kerr space-time (Novikov & Thorne 1973; Karas 2006).
The computation of g–factor can be provided numerically (e.g. Dovčiak, Karas & Yaqoob 2004; Beckwith & Done 2004; Brenneman & Reynolds 2006), or some feasible approximations were developed for Schwarzschild metric to perform fast calculations (e.g. Beloborodov 2002; Pecháček et al. 2005).
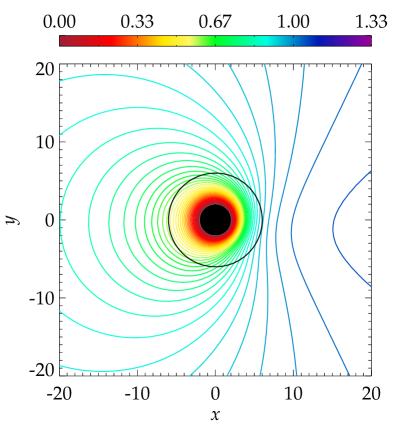
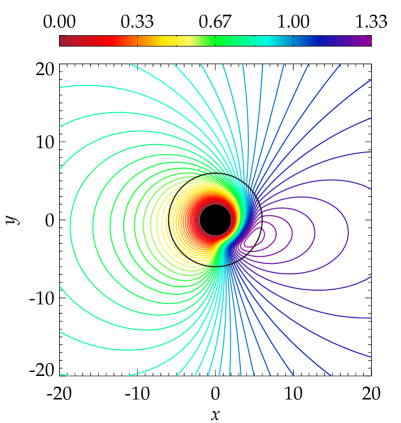
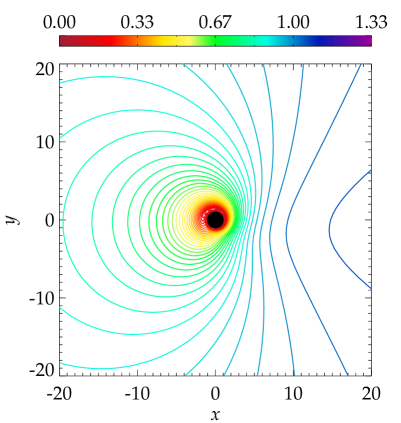
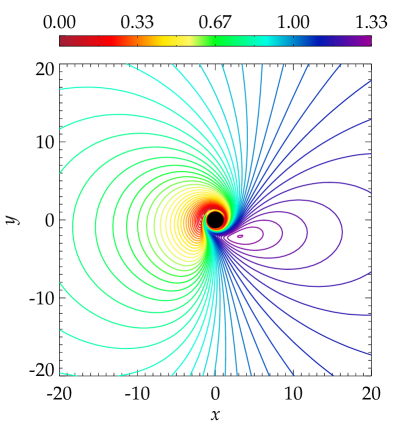
The contours of constant frequency shift around a non-rotating, , and a maximally rotating, , black hole are shown for two different values of the inclination angle in Figure 2.1 (an atlas of –factor for different values of spin and inclination may be found in Dovčiak 2004). The value of the frequency shift results from two effects, gravitational redshift and Doppler shift. The effect of gravitational redshift quickly increases when approaching the black hole, and it is infinite at the black hole horizon (). Near the black hole, the gravitational redshift clearly dominates over the Doppler shift.
The magnitude of the Doppler shift depends on the line-of-sight velocities. Its effect is also maximal at the closest orbit to the black hole where the orbital speed is maximal (see Figure 1.2). Therefore, the maximal redshift always occurs at the innermost orbit. However, the position of the maximal blueshift is farther from the black hole due to the gravitational redshift, and its exact position depends on the inclination angle. For lower inclinations, the Doppler effect is weaker and hence, it overcomes the gravitational redshift at a farther radius. Sufficiently far from the black hole, two distinct regions of blueshift and redshift are separated according to the rotation and the direction of the line-of-sight velocity to the observer. The level of the frequency shift decreases with the radius as the orbital velocity decreases as well.
2.1.2 Intensity
The specific intensity is defined as energy emitted at some given frequency into the element of solid angle in unit of time :
| (2.9) |
where is the total number of photons.
The value of the intensity detected by an observer depends on the frequency shift of the emitted radiation. This relation may be derived from the Liouville’s theorem which states that the phase-space volume is invariant to the canonical transformations representing the time evolution of the system:
| (2.10) |
where is the dimension, expresses coordinates and the conjugated momenta. In our application, the Liouville’s theorem states that the phase-space density:
| (2.11) |
is a constant of the Lorentz transformation. The element of the phase-space volume is given by:
| (2.12) |
Thus,
| (2.13) |
Substituting from (eq. 2.13) into (eq. 2.9) and using :
| (2.14) |
and
| (2.15) |
Thus, using eq. (2.1)
| (2.16) |
This fact implies that the radiation from a matter approaching to the observer (blueshift) is boosted while the radiation from a matter receding from the observer (redshift) is diminished. The level of the intensity amplification (resp. diminution) depends on the values of the line-of-sight velocity.
2.1.3 Line profiles from accretion discs
For line emission from an accretion disc, we can assume an axial symmetry and separability of the radial and angular emissivities in some cases. Then, the line emission from the disc can be written in the form of product:
| (2.17) |
where is the disc radius (distance from the centre), is the cosine of the emission angle measured from the disc normal direction to the equatorial plane, in the disc co-moving frame, i.e. in the local Keplerian frame orbiting with the angular velocity . Likewise, the intrinsic energy is measured with respect to the local frame. is the intrinsic energy of the fluorescent line depending on the ionisation state.
The radial part is being approximated by a power law,
| (2.18) |
or by a broken power law:
| (2.19) |
The parameter is typically which means that the intrinsic intensity of the radiation decreases with the distance. The standard value is , larger values may occur only under certain conditions in the innermost parts of the disc (see e.g. Niedźwiecki & Życki 2008).
The angular emissivity law, , defines the distribution of the intrinsic intensity outgoing from each radius of the disc surface with respect to the perpendicular direction. The limb darkening law in the form (Chandrasekhar 1960; Laor 1991) is most frequently used. However, the choice is somewhat arbitrary in the sense that the physical assumptions behind this law are not satisfied at every radius over the entire surface of the accretion disc. This aspect is studied in detail in Section 3 of the Thesis.
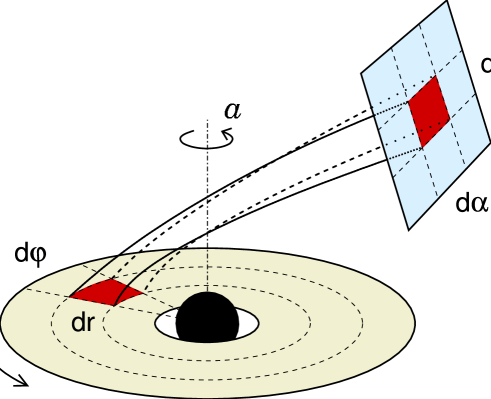
The observed radiation flux from an accretion disc is obtained by integrating the intrinsic emission over the entire disc surface, from the inner edge () to the outer edge (), weighted by the transfer function determining the impact of relativistic energy change (Doppler and gravitational) as well as the lensing effect for a distant observer directed along the inclination angle (see Cunningham 1975; Asaoka 1989; Karas, Vokrouhlický & Polnarev 1992; Karas 2006):
| (2.20) |
where the index ‘e’ denotes quantities related to the disc and ‘o’ observed quantities. The integration is carried out over all possible values of the frequency shift and the whole surface of an accretion disc.
Another approach is employed in Dovčiak, Karas & Yaqoob (2004) where the integration is carried out over the coordinates and -factor is computed at each place. There are two possibilities how the observed flux is expressed:
-
1.
in detector coordinates , :
(2.21) -
2.
in Boyer-Lindquist coordinates of the disc , :
(2.22)
where and are another transfer functions. If is the specific intensity given by eq. (2.9) then from eq. (2.16): . The relation for may be found from the transformation relation between the , coordinates and the Boyer-Lindquist coordinates of the disc , (see Figure 2.2):
| (2.23) |
where is the observed element surface (i. e. in the detector frame), is the local element surface of the disc, and is the lensing factor defined as the ratio of the cross-section of the flux tube at the detector to the cross-section of the same flux tube at the disc. Using eqs. (2.21)–(2.23): .
As a summary, the resulting line profile from an axisymmetric accretion disc is shaped by these parameters (see eqs. 2.17 and 2.22):
-
1.
inclination angle
-
2.
inner disc radius
-
3.
outer disc radius
-
4.
radial dependence parameter
-
5.
angular emissivity law
-
6.
spin
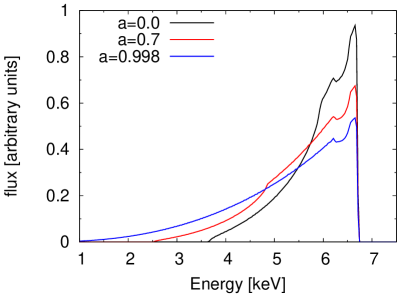
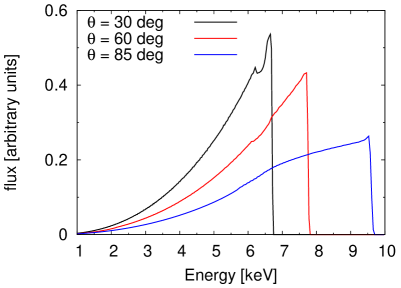
Figure 2.3 shows the theoretical line profiles for different values of the parameters. The kyrline model (Dovčiak, Karas & Yaqoob 2004) in the XSPEC fitting package (Arnaud 1996) was used to produce the lines. The inner disc was fixed to the radius of the marginally stable orbit which is linked with the spin value by eq. (1.2). The line profile has a more extended red wing for higher values of the spin because the inner edge of the disc shifts to lower radii where more extreme gravitational redshift occurs. The line profile is broader for higher values of the inclination angle because the line-of-sight velocities are higher accordingly implying a stronger Doppler effect. The stronger Doppler effect overreaches the gravitational redshift in the region where the matter moves towards the observer. The position of the maximal blueshift is closer to the black hole proportionally to the strength of the Doppler shift and thus, to the inclination angle (see Figure 2.1). The peak of the line is shifted to higher energies for higher inclinations. All the lines shown in the figure are normalised to the same flux.
2.2 Observational evidence of relativistic iron lines
Broad iron lines have been detected in several X-ray spectra of black hole binaries as well as active galaxies. The first detection of a moderately broad iron line is attributed to the EXOSAT observations of Cygnus X-1 (Barr, White & Page 1985). The redshift and broadening of the line was explained by Fabian et al. (1989) as a result of relativistic smearing. They constructed diskline model111This model is embedded in the XSPEC fitting package and may still be used for spectral analysis of non-rotating or slowly rotating black holes or neutron stars. However, be aware that the effect of lensing is not included in this model. for the relativistic line around a non-rotating black hole. A model of the relativistic line for a maximally rotating Kerr black hole was developed independently by Kojima (1991) and Laor (1991). A strongly asymmetric and redshifted line profile was predicted for radiation coming from an inner accretion disc around a black hole. This indicated that the interesting insights on the geometrical properties of accretion discs in the closest vicinity of a black hole may be derived from the shape of the line.
The first X-ray spectrometer capable for resolving the shape of the line was SIS detector (Solid-state Imaging Spectrometer) on-board the ASCA satellite (Advanced Satellite for Cosmology and Astrophysics). The first resolved broad iron line was detected in the spectrum of a Seyfert galaxy MCG -6-30-15 by Tanaka et al. (1995). This source exhibited an extremely broad iron line in X-ray spectra of all succeeding satellites (see Section 4.3). The one of the most suitable and still operating missions for investigation of broad iron lines is the XMM-Newton satellite thanks to its large effective collecting area in the iron line band and also a few keV above (see Section 4.1.1). Recently, the Suzaku satellite (launched on 10 July 2005) exceeds XMM-Newton with its broad-band coverage (0.4-600 keV) which allows better constraining of the continuum (both, primary and reflection).
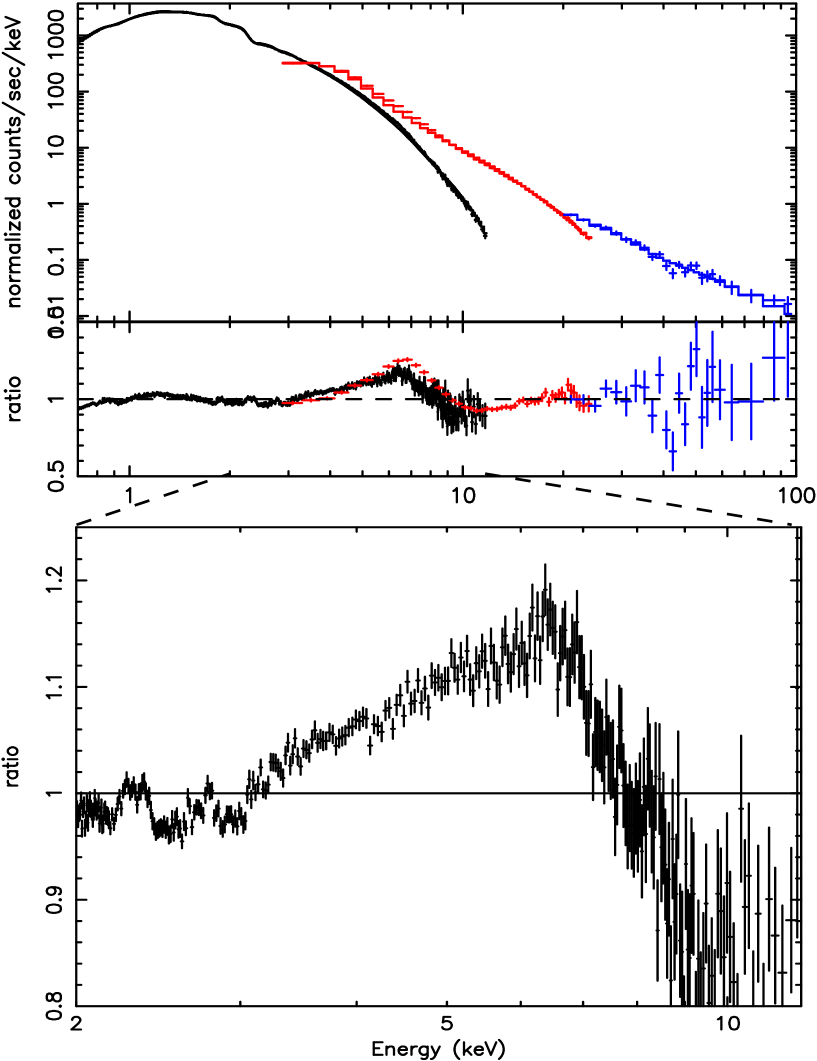
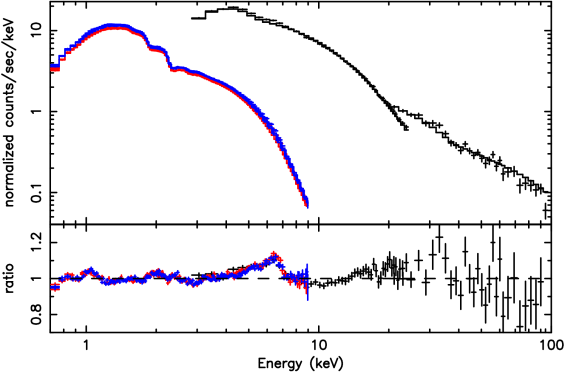
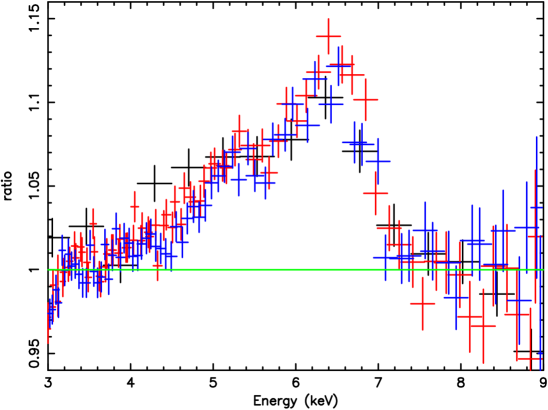
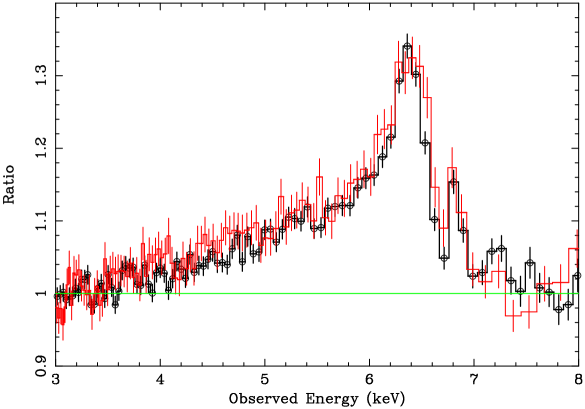
Broad iron lines shown in Figure 2.4 for the case of a black hole binary GX 339-4, and in Figure 2.5 for the case of a Seyfert 1 galaxy MCG -6-30-15 belong to the best examples of the extremely relativistically broadened lines. We re-analysed the XMM-Newton observations of these sources. For a brief description of both sources and details of our re-analysis, see Sections 4.2 and 4.3. Other examples of active galaxies with broad iron lines may be found in e.g. in Nandra et al. (1997); Guainazzi (2003); Streblyanska et al. (2005); Reeves et al. (2006); Turner et al. (2006); Piconcelli et al. (2006); Nandra et al. (2007); Longinotti et al. (2008); Markowitz et al. (2008, 2009); Brenneman & Reynolds (2009); Fabian et al. (2009); Shu et al. (2010). A statistical distribution of AGN with broad iron lines was studied by Guainazzi, Bianchi & Dovčiak (2006) who estimated a fraction of of well exposed AGNs that exhibit a relativistically broadened iron line. Works by Longinotti et al. (2008) and de la Calle et al. (2009, submitted to A&A) represent the continuation of this effort. Different samples of Seyfert galaxies observed by the XMM-Newton satellite were studied by Nandra et al. (2007) and Brenneman & Reynolds (2009). Both groups concluded that the most X-ray spectra of their samples possess a relativistically broadened iron line. Other examples of black hole binaries may be found in Díaz Trigo et al. (2007); Hiemstra et al. (2009); Miller et al. (2009). Relativistically broadened iron lines were also detected in several X-ray spectra of neutron stars (see Cackett & Miller 2010, and references therein).
2.3 Comparison between the laor and ky models
There are several numerical codes for the relativistic disc spectral line, some of them were already mentioned. The most widely used model, over almost two decades, has been the one by Laor (1991), which includes the effects of a maximally rotating Kerr black hole. In other words, the laor model sets the dimensionless angular momentum to the canonical value of – so that it cannot be subject of the data fitting procedure. Dovčiak, Karas & Yaqoob (2004) have relaxed this limitation and allowed to be fitted in the suite of ky models.
Other numerical codes have been developed independently by several groups (Martocchia, Karas & Matt 2000; Viergutz 1993; Zakharov & Repin 2004; Fuerst & Wu 2004; Beckwith & Done 2004; Čadež & Calvani 2005; Brenneman & Reynolds 2006) using different techniques. The last three equipped their codes with similar functionality as KY to be used in X-ray spectra modelling. Brenneman & Reynolds (2006) performed useful tests demonstrating that ky and their kerrdisk model give compatible results when they are set to equivalent parameter values.
Although the laor model does not have the spin value as a variable parameter, it can still be used for evaluation of the spin if one identifies the inner edge of the disc with the marginally stable orbit (eq. 1.7, see also Figure 1.2). The evaluation of the spin from extension of the red wing only is, however, not precise because the spin also modulates the value of the factor and thus, it affects the overall shape of the line by itself. This systematic error of spin measurements obtained with the laor model has not yet been constrained. Further, we compare the spin estimation by the laor and kyrline model to constrain this error.
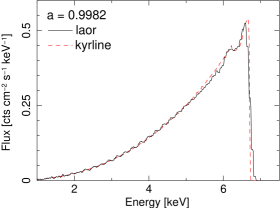
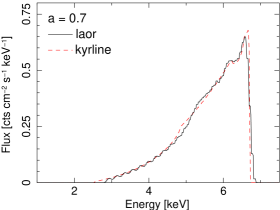
The theoretical line profiles of the laor and kyrline models are compared in Figure 2.6 for two values of the spin, (left panel) and (right panel). The inner radius of the disc is set to coincide with the marginally stable orbit for a given value of the spin, i.e. and , respectively. The angular dependence of the emissivity in this example is given by the limb darkening law () which is the only prescription for the directionality in the laor model. The kyrline model enables to switch between different emission laws. Further in this Section, we used two distinct cases and this name convention: kyrline is equipped with the same limb-darkening law as in the laor model, and kyrline* uses the limb-brightening law in the form (Haardt 1993).
In the first comparison (left panel of Fig. 2.6), the difference between the two models is noticeable only in the high energy edge of the line profile. This is caused by poorer energy resolution of the laor model. In the second comparison (right panel of Fig. 2.6), an additional discrepancy appears in the slope of the line profile (look at energies 4.5–6 keV). This is the effect of the different frame-dragging taken into account and it is caused by the fact that the laor model is calculated only for .
Relatively to the total line profile, the difference between the laor and kyrline model seems to be rather small. Nevertheless, we further compare both models applied to the real data with these goals:
-
1.
to investigate the importance of the precise value of spin in the line profile formation besides the relation between spin and the marginally stable orbit,
-
2.
to constrain the uncertainty in the spin determination by the less precise laor model.
2.3.1 Analysis with current data provided by XMM-Newton satellite
For the comparison of the laor and kyrline model with current data, we chose two sources, MCG -6-30-15 and GX 339-4, which exhibited extremely broad iron lines (see Figures 2.4 and 2.5). We re-analysed the observations performed by the XMM-Newton satellite (see Section 4.1.1).
MCG-6-30-15
The galaxy MCG -6-30-15 is a nearby Seyfert 1 galaxy (). The skewed iron line has been revealed in the X-ray spectra by all recent satellites (Guainazzi et al. 1999; Wilms et al. 2001; Fabian et al. 2002; Lee et al. 2002; Miniutti et al. 2007). The XMM-Newton observed MCG -6-30-15 for a long 350 ks exposure time during summer 2001 (revolutions 301, 302, 303). We joined the three spectra into one for further analysis. Details of the data reduction and spectral re-analysis are described in Section 4.3.
We used the same continuum model for the MCG -6-30-15 spectrum as presented in Fabian et al. (2002): the simple power law component absorbed by Galactic gas matter along the line of sight with column density cm-2. The employed model is sufficient to fit the data above keV, which is satisfactory for our goal of the comparison of the relativistic line models. The value of the photon index is . The residuals are formed by a complex of a broad iron line and two narrow iron lines – one emission line at keV likely originating in a distant matter (torus) and one absorption line at keV which can be explained by a blueshifted absorption originating in an outflow. The rest energy of the broad line is keV, which corresponds to the helium-like ionised iron atoms. The spectral complexity in the line band allows an alternative explanation – the model with two narrow emission lines at energies keV and keV. This alternative model leads to the presence of the broad line component at keV. See Section 4.3 for details.
| parameter | kyrline | kyrline* | laor best | laor loc.min. |
|---|---|---|---|---|
| [deg] | ||||
| [keV] | ||||
Notes: The errors in brackets are related to the last significant digit of the number, and they correspond to 90 confidence level calculated while the other model parameters are fixed.
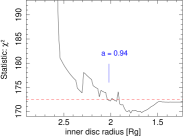 |
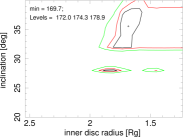 |
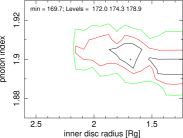 |
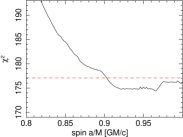 |
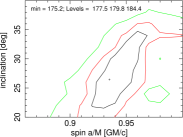 |
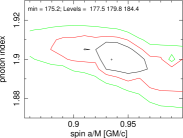 |
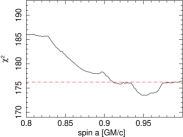 |
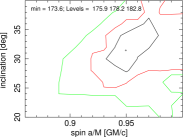 |
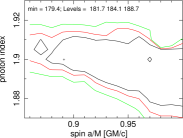 |
A good fit of the broad line was found with a broken power law line emissivity with a steeper dependence on the radius in the innermost region. The goodness of the fit is constrained by the least squared method. The fit results in 2.5–9.5 keV are presented in Table 2.1. The values give comparable results for all employed models. The , where is the number of degrees of freedom which is related to the total number of energy bins and model parameters. The six independent parameters of the laor and kyrline models make the global minimum of rather wide with several local minima. Each model has a different tendency to converge to a different minimum. Hence, we did not compare only best fits of both models, but also the evaluated spin values by the kyrline and laor models when the other model parameters correspond to each other. The equivalent width of the line is eV which is a rather high value but consistent with the result of Brenneman & Reynolds (2006).
The errors presented in the table are evaluated while the
other parameters of the model are fixed. However,
the realistic errors are higher because the model parameters
further depend on other parameters of the line and continuum models.
To catch up these relations we produce various contour graphs focusing
on the determination of the spin value, taking into account the other
parameters of the used model, see Figure 2.7.
The dependence of the value
on the value of the spin (kyrline) or the inner disc radius (laor)
is shown in the left column of the figure.
The contour graphs for the spin and the inclination angle are shown
in the middle column. The underlying
model was fixed in both cases, and it was relaxed
for the third evaluation in the right column
where the contours for the spin and the power-law index are shown.
The contour plots reveal quite complicated structure
of the parameter space with several minima, making
the spin estimation rather smeared.
Taking all of these into account, we obtain for the spin value:
Another issue is the smoothness of the contour plots. Some of the sharp or local features in the presented contour plots are due to computational problems of the fitting method but some of them can be smoothed by an improved choice of the internal computational parameters. We tried to change some of these parameters. The smoothest results were generally obtained when we increased number of fitting iterations together with wider steps of the value of the examined parameters. However, one may easily miss a true minimum when stepping a parameter value roughly which leads to bad results.
To avoid this problem we always tried first to find a true minimum and then stepping the parameters in such a way that the values corresponding to the true minimum are not skipped. Finding the true minimum is rather difficult problem in such a rich space of free parameters. Therefore, we usually repeated the fitting procedure several times with different initial values of the model parameters and then we compared values of the local minima.
GX 339-4
The black hole binary GX 339-4 exhibited a strong broadened iron line in the 76 ks observation in 2002 when the source was in the very high state (Miller et al. 2004), and also in two 138 ks observations in spring 2004 when the source was in the low-hard state (Miller et al. 2006). See also Figure 2.4 adopted from the two papers. However, by our re-analysis of the data we found that the longer low/hard state observation is affected by a pile-up – see the details in Section 4.1.2. Hence, we use further only the very high state observation from 2002. Details of the data reduction and spectral re-analysis are described in Section 4.2.
| parameter | kyrline | kyrline* | laor |
|---|---|---|---|
| [deg] | |||
| [keV] | |||
The fitting results of the relativistic line models in 3–9 keV are summarised in Table 2.2 and Figure 2.8. There are two minima found during the fitting procedure. We preferred the one which better corresponds to the results obtained by the independent radio and infrared measurements which constrained the inclination angle to be (Gallo et al. 2004). The dependence of the goodness of the fit on the spin value is shown in the left column of the figure. The contour graphs for the spin and the inclination angle are depicted in the middle column, and for the spin and the power law photon index in the right column of the figure. The derived spin value is then:
In both cases, MCG -6-30-15 and GX 339-4, the fitting with the laor model resulted in slightly higher values for the spin, but consistent with the values of the kyrline model within the general uncertainties of the spin estimation. The spin value of MCG -6-30-15 is better constrained thanks to its high value and more counts in the line than in the case of GX 339-4 (see Table 2.3).
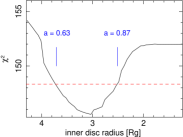 |
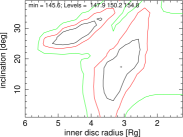 |
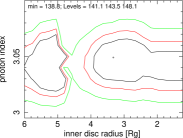 |
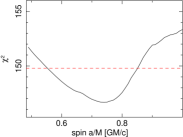 |
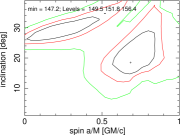 |
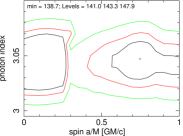 |
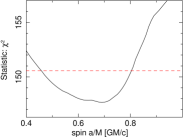 |
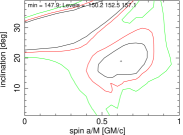 |
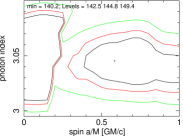 |
| MCG -6-30-15 | GX 339-4 | |
|---|---|---|
| number of counts | ||
| net counts/s | ||
| model counts/s | ||
| line counts/s | ||
| line counts |
2.3.2 Simulated data of next generation X-ray satellites

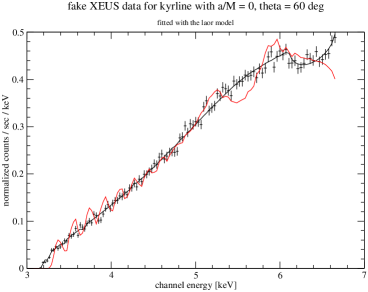
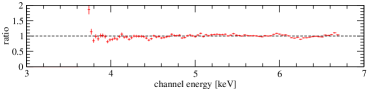
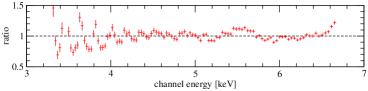
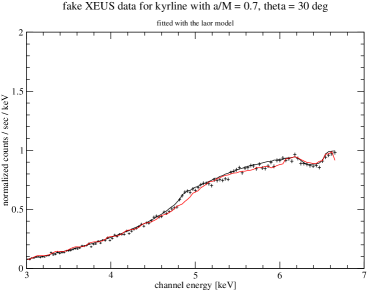

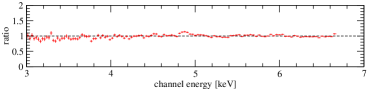
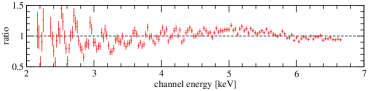
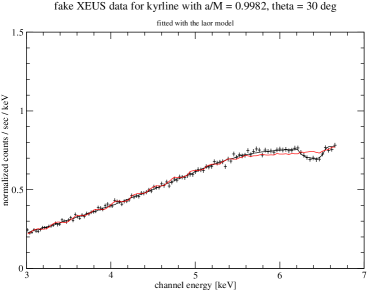
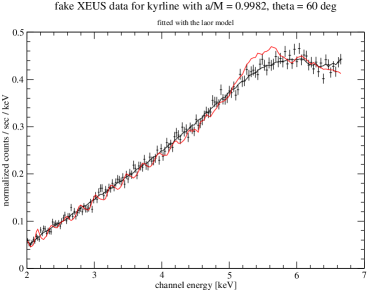
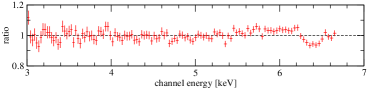
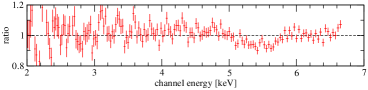
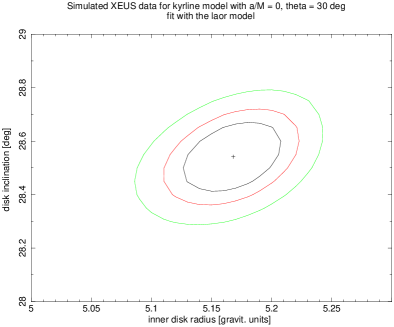
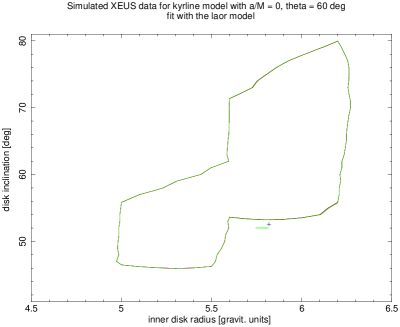
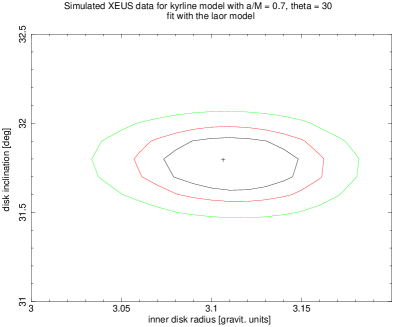
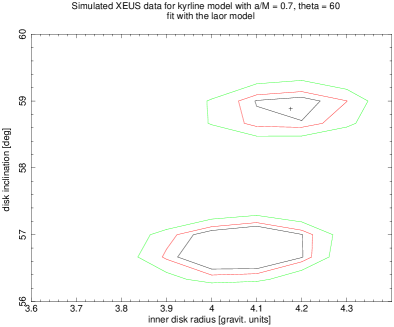
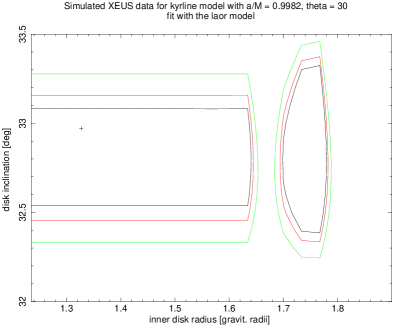
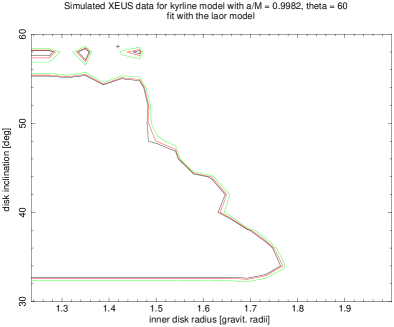
Further, we applied the laor and kyrline models on the data with significantly higher quality supposed to be achieved by on-coming X-ray missions. The presently planned International X-ray Observatory (IXO, see e.g. Bookbinder 2010) arose from the merging of the former XEUS and Constellation-X missions. Because the details of the IXO mission have not been fixed at the moment when this work originated, we used a preliminary response matrix of the former XEUS mission (Arnaud et al. 2009). We generated the data for a kyrline model with a rest energy of the line keV and radial disc emissivity that follows a power law with the index . We re-binned the data in order to have a resolution of eV per bin. We then fit the data in the 1–9 keV energy range with the laor model using the same initial values of the fitting parameters as for the data simulation. Due to insufficient resolution of the laor model, a significant problem appears at the high-energy edge of the broad line. This occurs because the next generation instruments achieve much higher sensitivity in the corresponding energy range.
We examined the artificial data for a grid of values of the angular momentum and the inclination angle. The results for different values are shown in Figure 2.9. We excluded the higher-energy drop of the lines in order to reveal the differences in the overall shape of the line. It is clearly seen from the figures that the effect of the spin on the shape of the line is sufficiently resolved with the higher quality data. The contour graphs of the inner disc radius and the inclination angle are shown in Figure 2.10 for three different values of the spin, , , . For lower values of the spin, the results obtained with the laor model differ more from the fiducial values. The laor model tends to underestimate the inner disc radius, or, by other words, to overestimate spin value related to the inner disc radius by the relation .
| MCG -6-30-15 (simul.) | GX 339-4 (simul.) | |||
|---|---|---|---|---|
| parameter | KY value | fitted laor value | KY value | fitted laor value |
| - | - | |||
| - | - | |||
Note: Fiducial values of the ky model parameters which were used to the data simulation are shown in columns “ky value”. The inner disc radius is determined from the relation (eq. 1.2).
Further, we produced simulated data for the Seyfert galaxy MCG-6-30-15 and the black hole binary GX 339-4 using rather simplified models which were suitable to fit the current XMM-Newton data. For MCG-6-30-15 we used a power law model plus a kyrline model for the broad iron line, absorbed by Galactic gas matter along the line of sight: phabs * (powerlaw + kyrline). The parameters of the continuum are the column density cm-2, the photon index of the power law, and its normalisation . The values of the line parameters are summarised in the KY value column of Table 2.4. The exposure time was chosen as ks and the flux of the source as erg cm-2 s-1 in the 2–10 keV energy range (i.e. cts).
For GX 339-4 we used phabs * (diskbb + powerlaw + kyrline) with cm-2, keV (), and (). The exposure time was chosen as ks, the flux of the source as erg cm-2 s-1 in the 2–10 keV energy range, i.e. cts. The number of counts is more than two orders of magnitude higher than for the observation of the XMM-Newton satellite (see Table 2.3). The reason is due to the loss of 97% of the photons during the burst mode of XMM-Newton observation which eliminates the pile-up problem (see Section 4.1.1). The next generation X-ray missions are supposed to have a calorimeter instead of the CCD camera on-board which will get rid of such problems.
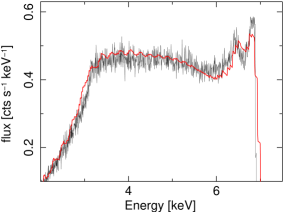
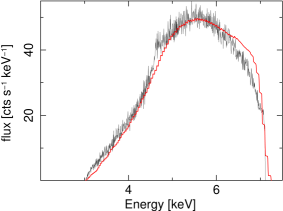
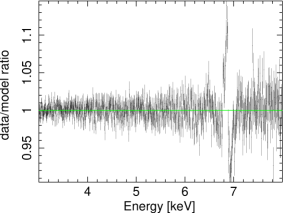
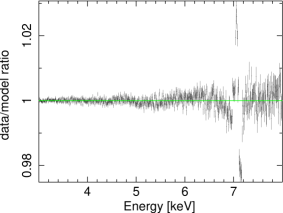
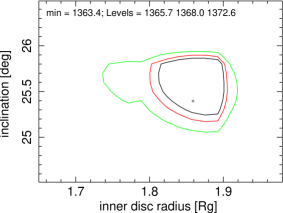
The results of the laor fit are shown in Table 2.4 and in Figure 2.11. The broad iron line component of the model is plotted in the top panel of the figure. The model continuum components are not displayed there to clearly see the deflections of the laor model. The most prominent discrepancy appears at the higher-energy drop, which is clearly seen in the data/model ratio plot in the middle panel of Figure 2.11. The model parameters are constrained with small error bars (see contours vs. in the bottom panel of Figure 2.11), which reveals a difference between the kyrline and the laor models.
The spin value derived from the analysis using the laor model is:
for MCG -6-30-15, while the fiducial value of the spin was , and
for GX 339-4, while the fiducial value of the spin was .
2.4 Discussion of the results
We investigated the iron line band for two representative sources – MCG -6-30-15 (active galaxy) and GX 339-4 (X-ray binary). The iron line is statistically better constrained for the active galaxy MCG -6-30-15 due to a significantly longer exposure time of the available observations – see Table 2.3 for comparison of count rates of the observations. The spectra of both sources are well described by a continuum model plus a broad iron line model.
We compared modelling of the broad iron line by the two relativistic models, laor and kyrline. The laor model always assumes an extreme Kerr metric (), and therefore, it is used for the fitting of different spin values only by identifying the inner edge of the disc with the marginally stable orbit. In the kyrline model, on the other hand, the spin itself is a fitting parameter and the metric is adjusted to the actual value of .
The discrepancies between the kyrline and laor results are within the general uncertainties of the spin determination using the skewed line profile when applied to the current data. This means that the spin is currently determined from the position of the marginally stable orbit rather than from the overall shape of the line.
Results with both models are apparently distinguishable for higher quality data, as those simulated for the next generation X-ray missions. We find that the laor model tends to overestimate the spin value and moreover, it has insufficient energy resolution which affects the correct determination of the high-energy edge of the broad line. This leads to large values by fitting the high resolution data (see Table 2.4).
Technically, the kyrline model leads to a better defined minimum of for the best fit value. The confidence contour plots for versus other model parameters are more regularly shaped. This indicates that the kyrline model has a smoother adjustment between the different points in the parameter space allowing for more reliable constraints on . The laor model has a less accurate grid. Smoother and more precise results by the kyrline model are at the expense of the computational speed. Empirically, we found that the kyrline model is about slower than the laor model.
Chapter 3 Role of the emission directionality in the spin determination
3.1 Emission directionality
Light rays coming from a black hole accretion disc are highly curved in strong gravitational field and the emission angle given by eq. (2.8) may possess any value, depending on the position on the disc from which the radiation is reflected. Figure 3.1 shows the contours of the constant local emission angle from the accretion disc around a non-rotating, , and a maximally rotating, , black hole taking into account their distortion by the central black hole and assuming that the emitted photons reach a distant observer at a given view angle . It clearly illustrates that the local emission angle spans the entire range, from to degrees for any value of . This is due to the combined effects of aberration and light bending which grow greatly near the inner rim of the disc. In the inner region, the photons are boosted in the direction of rotation and they emerge along grazing angles. Notice for the case of a higher disc inclination, deg, that there is a small region behind the black hole (below, in the picture) where the local emission angle is very low, i.e. the radiation is emitted in the direction almost perpendicular to the disc. This is the clear effect of the light bending. Although the contours are most dramatically distorted near the horizon the emission angle is visibly different from the observer inclination even quite far from the horizon, at a distance of several tens . This is mainly due to special-relativistic aberration which decays slowly with the distance as the disc obeys Keplerian rotation at all radii. Asymptotically, for .
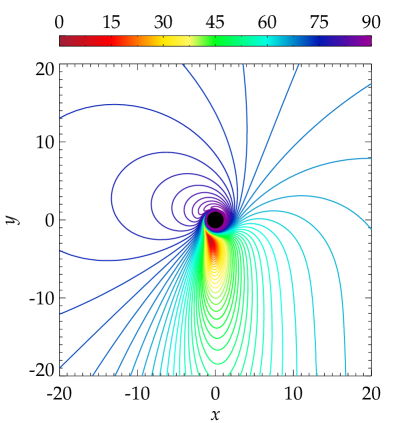
As emission directionality, we call the dependence of the intensity on the emission angle. Because of the variety of the emission angle values, the directional distribution of the outgoing radiation is among the important aspects that must be addressed. This functionality depends on how the radiation originates and also on the surrounding conditions. In the case of a black hole accretion disc, the directionality of thermal and reflection radiation may be significantly different. In general, the directionality is a function of radius from the black hole and energy of the emitted radiation. In practical application, however, a unique profile is standardly assumed, invariably over the entire range of radii in the disc and the energy in the spectral band. Particularly, the limb darkening law is frequently used since it is embedded in the currently most widely used laor model (Sect 2.3).
Limb darkening traditionally refers to the gradual diminution of intensity in the image of the surface of a star as one moves from the centre of the image to the edge. It is a consequence of uneven angular distribution of the radiation flux emerging from the stellar surface (Chandrasekhar 1960; Mihalas 1978). Limb darkening results as a combination of two effects: (i) the density of the surface layers decreases in the outward direction, and (ii) temperature also drops as the distance from the centre of the star increases. The outgoing radiance is therefore distributed in a non-uniform manner.
The limb darkening law is widely applied also to describe radiation coming from an accretion disc around a black hole. Nevertheless, the actual form of the angular distribution depends on the physical mechanism responsible for the emission and the geometrical proportions of the source. The limb darkening law is relevant for thermal radiation of the disc with infinite optical depth. However, already when the optical depth is assumed to be finite and also internal heating is taken into account the emission directionality significantly changes (see e.g. Fukue & Akizuki 2006). The case of reflection is substantially different from the thermal radiation because the initial radiation comes from above the disc and passes through the disc atmosphere. The higher layers are characterised by higher ionisation and temperature with the electron scattering as the dominant process there. The observer looks deeper to the colder layers of the atmosphere when the emission angle is low. However, the radiation is there more likely to be absorbed resulting in the detection of weaker reflection radiation than when the emission angle is higher (see discussion in Goosmann et al. 2007, Sect. 3). This effect is just opposite to the limb darkening, and therefore, it is called as limb brightening.
Given the high velocity of the orbital motion (see Fig. 1.1) and the strong-gravity light bending near the black hole, the effect of directional anisotropy of the local emission is enhanced. As a result of this interplay between the local physics of light emission and the global effects of the gravitational field, different processes contribute to the final (observed) directional anisotropy of the emission. For this reason it is important to describe the angular distribution in a correct manner; ad hoc choices of the limb-darkening law may lead to errors in the determination of the model best fit parameters, including the inaccuracy in the spin parameter which are difficult to control, or they may prevent us from estimating the statistical confidence of the model.
3.1.1 Effects of the emission directionality on the iron line profiles
In optics, Lambert’s cosine law describes an emitter producing a radiation intensity that is directly proportional to . Lambertian surfaces exhibit the same apparent radiance when viewed from any angle . Likewise, Lambertian scattering refers to the situation when the surface radiates as a result of external irradiation by a primary source and the scattered light is distributed according to the same cosine law. This is, however, a very special circumstance; directionality of the emergent light is sensitive to the details of the radiation mechanism. For example, the classical result of the Eddington approximation for stellar atmospheres states that the effective optical depth of the continuum is , and so the emergent intensity is described by the limb-darkening law, .
In the case of a fluorescence iron line produced by an illuminated plane-parallel slab, the angular distribution was investigated by various authors (Basko 1978; George & Fabian 1991; Haardt 1993; Ghisellini, Haardt & Matt 1994; Reynolds, Nowak & Maloney 2000). In that case a complicated interplay arises among the angular distribution of the primary irradiation, reflection and scattering in the disc atmosphere. Several authors pointed out that it is essential for the reliable determination of the model parameters to determine the angular directionality of the broad line emission correctly. Martocchia, Karas & Matt (2000) noted, by employing the lamp-post model, that “…the broadening of the observed spectral features is particularly evident when strongly anisotropic emissivity laws, resulting from small [i.e., the lamp-post elevation above the equatorial plane], are considered.“
The important role of the emission angular directionality was clearly spelled out by Beckwith & Done (2004): “…the angular emissivity law (limb darkening or brightening) can make significant changes to the derived line profiles where light bending is important“ (see their Fig. 9–13). Similarly, Dovčiak et al. (2004a); Dovčiak, Karas & Yaqoob (2004) and Beckwith (2005) compared the relativistic broad lines produced under different assumptions about the emission angular directionality. However, to verify the real sensitivity of the models to the mentioned effect of directionality, it is necessary to connect the radiative transfer computations with the spectral fitting procedure, and to carry out a systematic analysis of the resulting spectra, taking into account both the line and the continuum in the full relativistic regime. We report on our results from such computations in Section 3.2.4.
Reynolds et al. (2004, sec. 4.3) argue that the combined effect of photoelectric absorption in the disc and Compton scattering in the corona more affect the iron line photons emerging along grazing light rays than continuum photons. They conclude that the line equivalent width should be diminished for observers viewing the accretion disc at high inclination angles. Such a trend can be seen also in the lamp-post model of Matt et al. (1992) and Martocchia, Karas & Matt (2000, see their Figure 11). However, in the latter work this diminution is less pronounced when we compare it with the case of intrinsically isotropic emissivity.
More recently, Niedźwiecki & Życki (2008) studied the effect of different limb darkening laws on the iron line profiles. They pointed out that the role of emission directionality can be quite significant once the radial emissivity of the line is fixed with sufficient confidence. However, this is a serious assumption. In reality, the radial emissivity is not well constrained by current models.
The angular dependence of the outgoing radiation is determined by the whole interconnection of various effects. We describe them in more detail below (Sec. 3.2.4). Briefly, the conclusion is such that realistic models require numerical computations of the full radiative transfer. We have developed a complete and consistent approach to such radiative transfer computations in the context of the broad iron-line modelling together with the underlying continuum computations. As described in considerable detail below, we performed the extensive computations which are necessary in order to reliably determine the impact of the emission angular anisotropy on spectral fitting results (namely, on the determination of the black hole angular momentum). In particular, we describe detailed results from the investigation of the model goodness (by employing an adequate statistical analysis of the complicated parameter space). Such the analysis has not been performed so far in previous papers because detailed stepping through the parameter space and proper re-fitting of the model parameters was not possible due to the enormous complexity of the models and extensive computational costs.
In regular stars and their accretion discs, the relativistic effects hardly affect the emerging radiation. The situation is very different in the inner regions of a black hole accretion disc, where the energy shift and gravitational lensing are significant. The observed signal can be boosted or diminished by the Doppler effect combined with gravitational redshift: (eq. 2.16), where the values span more than a decade (see Fig. 2.1).
As mentioned above, many authors have adopted the defining choice (Laor 1991) of the cosine profile for the line angular emissivity: . This relation describes the energy-independent limb-darkening type of profile. However, the choice is somewhat arbitrary in the sense that the physical assumptions behind this law are not satisfied at every radius over the entire surface of the accretion disc. It has been argued that the limb-darkening characteristics need to be modified, or even replaced by some kind of limb brightening in the case of X-ray irradiated disc atmospheres with Compton reflection (Haardt 1993; Ghisellini, Haardt & Matt 1994; Życki & Czerny 1994). The latter should include the energy dependence, as the Compton reprocessing of the reflected component plays a significant role. The angle-dependent computations of the Compton reflection demonstrate these effects convincingly (Czerny et al. 2004). Indeed, the same effect is seen also in our computations, as shown in the right panel of Figure 3.2. The increase of emissivity with the emission angle strongly depends on the ionisation state of the reflecting material, so the actual situation can be quite complex (Goosmann et al. 2007).


A question arises of whether the current determinations of the black hole angular momentum might be affected by the uncertainty in the actual emissivity angular distribution, and to what degree. In fact, this may be of critical concern when future high-resolution data become available from the new generation of detectors. We have therefore carried out a systematic investigation using the ky code to reveal how sensitive the constraints on the dimensionless parameter are with respect to the possible variations in the angular part of the emissivity.
Figures 2.1 and 3.1 demonstrate the main attributes of the photon propagation in black hole space-time relevant to our problem: the energy shift and the direction of emission depend on the view angle of the observer as well as on the angular momentum of the black hole. Notice that, near the inner rim, the local emission angle is indeed highly inclined towards the equatorial plane where at the same time the outgoing radiation is boosted. These effects are further enhanced by gravitational focusing, which we also take into account in our calculations.
It should be noted that the energy shifts and emission angles near a black hole have been studied by a number of authors in mutually complementary ways. The figures shown here have been produced by plotting directly the content of FITS format files that are encoded in the corresponding ky routines (see Dovčiak (2004), where an atlas of contour plots is presented for different inclinations and spins). Analogous figures were also shown in Beckwith & Done (2004), who depicted the dependence of the cosine of the emission angle on the energy shift of the received photon and the emission radius.
The above quoted papers concentrated mainly on the discussion of the energy shifts and the emission directions of the individual photons, or they isolated the role of relativistic effects on the predicted shape of the spectral line profile. They clearly demonstrated that the impact of relativistic effects can be very significant. However, what is still lacking is a more systematic analysis which would reveal how these effects, when integrated over the entire source, influence the results of spectra fitting. To this end one needs to perform an extensive analysis of the model spectra including the continuum component, match the predicted spectra to the data by appropriate spectra fitting procedures, and to investigate the robustness of the fit by varying the model parameters and exploring the confidence contours.
One might anticipate the directional effects of the local emission to be quite unimportant. The argument for such an expectation suggests that the role of directionality should grow with the source inclination, whereas the unobscured Seyfert 1 type AGNs (where the relativistically broadened and skewed iron line is usually expected) are thought to have only small or moderate inclinations. However, this qualitative trend cannot be used to quantitatively constrain the model parameters and perform any kind of precise analysis, needed to determine the black hole spins from current and future high-quality data. Such an analysis has not been performed so far, and we embark on it here for the first time.
3.2 Iron K line band examined with different directionalities
3.2.1 Approximations to the angular emission profile
We describe the methodology which we adopted in order to explore the effects of the spectral line emission directionality. To this end we first employ simple approximations, neglecting any dependence on the photon energy and the emission radius. We set the line intrinsic emissivity from the planar disc to be described by one of the following angular profiles,
| (3.1) |
The three cases correspond, respectively, to the limb-brightened, isotropic, and limb-darkened angular profiles of the line emission.
The limb-brightening law by Haardt (1993) describes the angular distribution of a fluorescent iron line emerging from an accretion disc that is irradiated by an extended X-ray source. The relation was obtained from geometrical considerations and agrees well with more detailed Monte-Carlo computations (George & Fabian 1991; Matt et al. 1992). The physical circumstances relevant for the limb-darkening law are different, and we include this case mainly because it is implemented in the laor model and frequently used in the data analysis. The isotropic case, dividing all limb-brightening and limb-darkening emissivity laws, is included in our analysis for comparison.
The radial profile of the emission is set to a unique power law, eq. (2.18), over the entire range of radii across the disc. The directionality formula (3.1) of the intrinsic emissivity and the resulting spectral profiles are illustrated in Fig. 3.2 (left panel). Naturally, more elaborate and accurate approximations have been discussed in the literature for some time. For example, Ghisellini, Haardt & Matt (1994) in their eq. (2) include higher-order terms in to describe the X-ray reprocessing in the single-scattering Rayleigh approximation. However, at this stage the first-order terms are sufficient for us to demonstrate the differences between the three cases. Later on we will proceed towards numerical radiation transfer computations that are necessary to derive realistic profiles of the emission angular distribution and to keep their energy dependence.


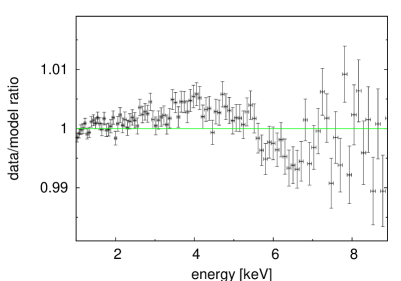
The dependence of the spectral profiles on the angular distribution of the intrinsic emission is shown in figures 3.3–3.4. It is apparent from Figure 3.3 that the limb brightening case makes the line profile broader (in the left panel) and the height of the blue peak lower (in the right panel) than the limb darkening case for the same set of parameters, which can consequently lead to discrepant evaluation of the spin. While Figure 3.3 shows the line profile for an extended disc, Figure 3.4 deals with a narrow ring. In this case, a typical double-horn profile develops. Although the energy of the peaks is almost entirely insensitive to the emission angular directionality, the peak heights are influenced by the adopted limb darkening law. In the right panel of Figure 3.4, the ratio of the two peaks is shown for the three cases of the emission angular directionality according to eq. (3.1). The influence of the directionality is apparent and it is comparable to the effect of the inclination angle. The spin value has only little impact for large inclinations.
In general, we notice that the extension and prominence of the red wing of the line are indeed related to the intrinsic emission directionality. This was examined in detail by Beckwith & Done (2004), who plotted the expected broad-line profiles for different angular emissivity and explored how the red wing of the line changes as a result of this undetermined angular distribution. Similarly, the inferred spin of the black hole must depend on the assumed profile to a certain degree. This is especially so because the spin is determined by the extremal redshift of the red wing of the line (see Section 2).
However, simple arguments are insufficient to assess how inaccurate the spin determination might be in realistic situations, as the spectral fitting procedure involves several components extending over a range of energy above and below the iron-line band. We illustrate this in Figure 3.5, noticing that the different prescriptions produce very similar results outside the line energy, but they do differ at the broad line energy range. The theoretical (background-subtracted) profiles of the relativistic line cannot alone be used to make any firm conclusion about the error of the best fit parameters that could result from the poorly known angular emissivity. To this end one has to study a consistent model of the full spectrum. With a real observation, the sensitivity to the problem of directionality (as well as any other uncertainty inherent in the theoretical model) will depend also on the achieved resolution, energy binning and the error bars of the data.
3.2.2 Example: directionality effects in MCG -6-30-15


We re-analysed a long XMM-Newton observation of a nearby Seyfert 1 galaxy MCG -6-30-15 to test whether the different directionality approximations can be distinguished in the current data. The observation took place in summer 2001 and the acquired exposure time was about 350 ks. We reduced the EPN data from three sequential revolutions (301, 302, 303). The details of the reduction of the data are described in Section 4.3.
We applied the same continuum model as presented in Fabian et al. (2002): the power law component (photon index ) absorbed by Galactic gas (column density cm-2). This simple model is sufficient to fit the data above keV, which is also satisfactory for our goal of reproducing the overall shape of the broad iron line. Other components need to be added to the model in order to fully understand the spectrum formation and to decide between viable alternatives, including the presence of outflows and a combination of absorption and reflection effects (Miller, Turner & Reeves 2008a; Turner & Miller 2009). However, our goal here is not to give precedence to any of the particular schemes. Instead, we rely on the model of a broad line and we test and compare different angular laws for the emission.
The residuals from the simple power law model can be explained by a complex of a broad line and two narrow lines. Due to the complexity of the model, it is hard to distinguish between the narrow absorption line at keV and the emission line at keV (Fabian et al. 2002). Although the level of values stays almost the same, the parameters of the broad iron line do depend on the continuum model and the presence of narrow lines (see Section 4.3). By adding an absorption line at keV, the best fit rest energy of the broad component comes out to be keV, and so the broad line originates in a moderately ionised disc. This result is consistent with Ballantyne, Vaughan & Fabian (2003).
Figure 3.6 shows the results of the one-dimensional steppar command performed in XSPEC, which demonstrates the expected confidence of -parameter best-fit values for the two extreme cases of directionality, Case 1 and Case 3. The model used in the XSPEC syntax is: phabs*(powerlaw + zgauss + zgauss + kyrline). The fixed parameters of the model are the column density cm-2, the photon index of power law , the redshift factor , the energy of the narrow emission line keV, and the energy of the narrow absorption line keV. The parameters of the broad iron line were allowed to vary during the fitting procedure. Their default values were keV for the energy of the broad iron line, deg for the emission angle, , and for the radial dependence of the emissivity (the radial part of the intensity needs to be rather complicated to fit the data and can be expressed as a broken power law: for , and for ).
The determined best-fit values for the spin are virtually the same for both cases, independent of the details of the limb-brightening/darkening profile. However, this result arises on account of the growing complexity of the model. The differences between the two cases become hidden in different values of the other parameters – especially in , and , i.e. the parameters characterising the radial dependence of the line emissivity in kyrline as a broken power law with a break radius . We find: (i) , deg, , , for Case 1; and (ii) keV, deg, , , for Case 3. The errors in brackets are evaluated as the 90% confidence region for a single interesting parameter when the values of the other parameters are fixed. The combination of three parameters , , thus adjusts the best fit in XSPEC. Nonetheless, the clear differences between the models occur consistently with theoretical expectations: for Case 3 the lower values of the spin, , produce larger and the best-fit spin can reach the extreme value within the 90% confidence threshold.
3.2.3 Analysis of simulated data for next generation X-ray missions
| Case | ||||
|---|---|---|---|---|
| no. | ||||
| 1 | ||||
| 2 | ||||
| 3 | ||||
The artificial data were generated using the kyrline model with isotropic directionality and the fiducial values of parameters (denoted by the subscript “f”). See the main text for details.
In order to evaluate the feasibility of determining the spin of a rotating black hole and to assess the expected constraints from future X-ray data, we produced a set of artificial spectra. We used a simple model prescription and preliminary response matrices for the International X-ray Observatory (IXO) mission.111We used the current version of provisional response matrices available at http://ixo.gsfc.nasa.gov/science/responseMatrices.html for the glass core calorimeter, dated October 30, 2008. We used the energy resolution of 5 eV per bin. Here we limit the energy band in the range – keV. The adopted model consists of powerlaw for continuum (photon index and the corresponding normalisation ), plus kyrline model (Dovčiak, Karas & Yaqoob 2004) for the broad line. The normalisation factors of the model were chosen in such a way that the model flux matches the flux of MCG -6-30-15. In this section, the simulated flux is around erg cm-2 s-1 with about 3% of the flux linked to the broad iron line component. The simulated exposure time was 100 ks.
 |
 |
 |
 |
 |
 |
 |
 |
 |
 |
 |
 |
 |
 |
 |
 |
 |
 |
 |
 |
 |
 |
 |
 |
We generated a set of “fake” spectra (i.e., artificial spectra in the XSPEC terminology). These spectra were produced in a grid of angular momentum values while assuming isotropic directionality, Case 2 in eq. (3.1). We call the assumed angular momentum of the black hole the fiducial spin and we denote it as . We performed the fitting loop to these data points using each of the three angular emissivity profiles. Once the fit reached convergence, we recorded the inferred spin . Figures 3.7–3.10 show the results in terms of best-fit profiles and the confidence contours for two different fiducial values of the spin (we assumed , and ). We summarise the values for the inferred spin for two inclination angles deg and deg in Table 3.1.
The fitting procedure was performed in two different ways – having the rest of the parameters free or keeping them frozen. Obviously the former approach results in an extremely complicated space. Therefore, for simplicity of the graphical representation, we plot only the results of the second approach which, however, gives broadly consistent results (though it misses some local minima of ). In other words, the plots have the parameters of the power law continuum, the energy of the line and the radial dependence parameter fixed at , keV, and .
The conclusion from this analysis is that the determination of indeed seems to be sensitive within certain limits to the assumed directionality of the intrinsic emission. The suppression of the flux of the reflection component at high values of may lead to overestimating the spin, and vice versa. The middle panels of Figs. 3.7–3.10 show the fit results for isotropic directionality, which was also the seed model used to generate the test data, and so these contours illustrate the magnitude of combined dispersion due to the simulated noise and the degeneracy between the spin and the inclination.. The fiducial values are well inside the confidence contour in all the graphs in the middle panels.
However, systematically lower values of the angular momentum are obtained for the limb brightening profile and, vice versa, higher values are found for the limb darkening profile. The magnitude of the difference is larger for higher values of angular momentum.
3.2.4 Angular emission profile of the detailed reprocessing model
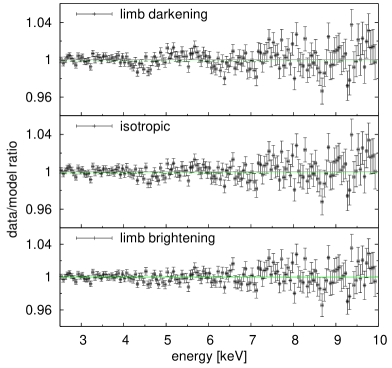
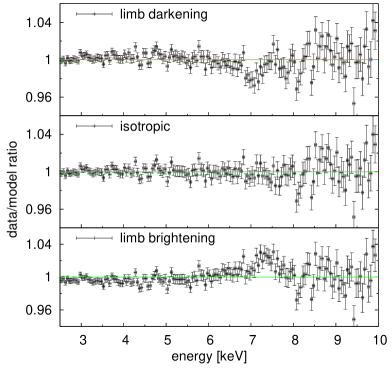
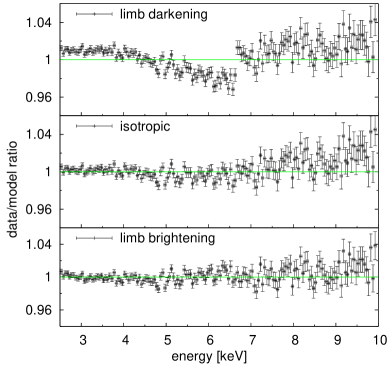
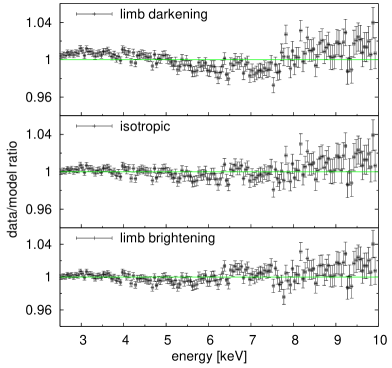
 |
 |
 |
 |
 |
 |
 |
 |
 |
 |
 |
 |
 |
 |
 |
 |
 |
 |
 |
 |
 |
 |
 |
 |
| Case 1 | Case 2 | Case 3 | |
| , | |||
| [deg] | |||
| 1.33 | 1.27 | 1.39 | |
| , | |||
| [deg] | |||
| 1.87 | 1.00 | 1.48 | |
| , | |||
| [deg] | |||
| 1.30 | 1.58 | 5.08 | |
| , | |||
| [deg] | |||
| 1.24 | 1.02 | 2.51 | |
Data were generated using the kyl2cr model. See the main text for details. The quoted errors correspond to the 90 confidence level.
The results presented in the previous sections show that using different emission directionality approaches leads to a different location of the minimum in the parameter space. Doubt about the correct prescription for the emission directionality thus brings some non-negligible inaccuracy into the evaluation of the model parameters. The magnitude of this error cannot be easily assessed as a unique number because other parameters are also involved.
A possible way to tackle the problem is to derive the intrinsic spectrum from self-consistent numerical computations. This has the potential of removing the uncertainty about the emission directionality (although, to a certain degree this uncertainty is only moved to a different level of the underlying model assumptions). In this section, we present such results from modelling the artificial data generated by numerical simulations, i.e. independently of an analytical approximation of the emission directionality presented in the previous sections.
Let us remind the reader that the orbital speed within the inner reaches a considerable fraction of the speed of light (Fig. 1.1). Beaming, aberration, and the light-bending all affect the emitted photons very significantly in this region. Less energetic photons come from the outer parts where the motion slows down and the relativistic effects are of diminished importance. This reasoning suggests that the analysis of the previous section may be inaccurate because the adopted analytical approximations (3.1) neglect any dependence on energy and distance.
We applied the Monte-Carlo radiative transfer code NOAR (see Section 5 in Dumont, Abrassart & Collin 2000) for the case of “cold” reflection, i.e. for neutral or weakly-ionised matter. The NOAR code computes absorption cross sections in each layer. Free-free absorption and the recombination continua of hydrogen- and helium- like ions are taken into account, as well as the direct and inverse Compton scattering. The NOAR code enables us to obtain the angle-dependent intensity for the reprocessed emission. The cold reflection case serves as a reference point that can be later compared against the models involving stronger irradiation and higher ionisation of the disc medium.
The directional distribution of the intrinsic emissivity of the reprocessing model is shown in Fig. 3.2 (right panel). The continuum photon index is considered and the energies are integrated over the – keV range. Although the results of the radiation transfer computations do show the limb-brightening effect, it is a rather mild one, and not as strong as the Case 1. In the same plot we also show the angular profile of the emissivity distribution in different energy ranges: (i) 2–6 keV (i.e. below the iron K line rest energy); (ii) 6–15 keV (including the iron K line); (iii) 15–100 keV (including the Compton hump). We notice that the energy integrated profile is dominated by the contribution from the Compton hump, where much of the emerging flux originates. However, all of the energy sub-ranges indicate the limb-brightening effect, albeit with slightly different prominence.
We implemented the numerical results of NOAR modelling of a reflected radiation from a cold disc as kyl2cr in the ky collection of models. Furthermore, we produced an averaged model, kyl3cr, by integrating kyl2cr tables over all angles. Therefore, kyl3cr lacks information about the detailed angular distribution of the intrinsic local emission from the disc surface. On the other hand, it has the advantage of increased computational speed and the results are adequate if the emission is locally isotropic. Furthermore, kyl3cr can be a posteriori equipped with an analytical prescription for the angular dependence (Cases 1–3 in eq. 3.1), which brings the angular resolution back into consideration. This approach allows us to switch between the three prescriptions for comparison and rapid evaluation.
In order to constrain the feasibility of the aforementioned approaches, we generated the artificial data using the powerlaw + kyl2cr model. The parameters of the model are: photon index of the power law and its normalisation , spin of the black hole , inclination angle , the inner and outer radii of the disc and , the index of the radial dependence of the emissivity , and the normalisation of the reflection component . We simulated the data for two different values of the spin, and , and for inclination angles and . The simulated flux of the primary power law component is the same as in the previous section. However, now an important fraction of the primary radiation is reflected from the disc. The total flux depends on the extension of the disc and its inclination. Its value is erg cm-2 s-1 for our choice of the parameters.
As a next step, we replaced kyl2cr by kyl3cr and searched back for the best-fit results using the latter model. In this way, using kyl3cr we obtained the values of the spin and the inclination angle for different directionalities. The fitting results are summarised in Table 3.2. Besides the spin and the inclination angle, only normalisation of the reflection component was allowed to vary during the fitting procedure. The remaining parameters of the model were kept frozen at their default values.
The resulting data/model ratios are shown in Figures 3.11 and 3.12. For and the graphs look very similar in all three cases. However, the inferred spin value differs from the fiducial value with which the test data were originally created. The dependence of the best-fit statistic on the spin and the corresponding graphs of the confidence contours for spin versus inclination angle are shown in Figures 3.13–3.16, again for the three cases of angular directionality. These figures confirm that for the limb-brightening profile the inferred spin value comes out somewhat lower than the correct value, whereas it is higher if the limb-darkening profile is assumed.
In each of the three cases the error of the resulting determination depends on the inclination angle and the spin itself. However, we find that the isotropic directionality reproduces our data to the best precision. The limb darkening profile is not accurate at higher values of the spin, such as , when the resulting value even exceeds . The limb darkening profile is characterised by an enhanced blue peak of the line while the height of the red peak is reduced (see Figs. 3.3–3.4). Consequently, the model profile is too steep to fit the data. This is clearly visible in the data/model ratio plots for shown in Figures 3.12. The flux is underestimated by the model below a mean energy value of the line (for and deg keV) and overestimated above . This fact leads to a noticeable jump in the data/model ratio plot.
A noteworthy result appears in comparing of the contours produced by the model with limb brightening and limb darkening for and deg (Fig. 3.14). Although the former model (limb brightening) gives a statistically worse fit with than the limb darkening case (), the inferred values of the spin and the inclination angle are consistent with the fiducial values within the level. On the other hand, the spin value inferred from the limb darkening model is far from the fiducial (i.e., the correct) value.
 |
 |
 |
 |
 |
 |
 |
 |
 |
 |
 |
 |
It was shown for the case of XMM-Newton data of MCG -6-30-15 that the radial emissivity can mimic different angular emissivity (Section 3.2.2). Therefore, as a next step, we allowed parameter to vary during the fitting procedure of the artificial data. The contour graphs of the spin and the parameter are shown in Figure 3.17. It is clear from the figures that the correct value of the spin can be reached by adjusting of the parameter – for limb brightening by decreasing steepness of radial emissivity, and vice versa for limb darkening. However, this is not valid for each set of parameters. For , and deg, the model with limb darkening overestimates the spin value for any value of within confidence level. Oppositely, for , and deg, the model with limb brightening underestimates the spin value for any value of within confidence level.
3.3 Discussion of the results
We investigated whether the spin measurements of accreting black holes are affected by the uncertainty of the angular emissivity law, , in the relativistically broadened iron K line models. We employed three different approximations of the angular emissivity profiles, representing limb brightening, isotropic and limb darkening emission profiles. For the radius-integrated line profile of the disc emission, and especially for higher values of the spin, the broadened line has a triangle-like profile. The differences among the considered profiles concern mainly the width of the line’s red wing. However, the height of the individual peaks, also affected by the emission directionality, is important for the case of an orbiting spot (or a narrow ring), which produces a characteristic double-horn profile.
We re-analysed an XMM-Newton observation of MCG -6-30-15 to study the emission directionality effect on the broad iron line, as measured by current X-ray instruments. We showed the graphs of values as a function of spin for different cases of directionality. We can conclude that the limb darkening law favours higher values of spin and/or steeper radial dependence of the line emissivity; vice versa for the limb brightening profile. Both effects are comprehensible after examining the left panel of Fig. 3.3. The limb darkening profile exhibits a deficit of flux in the red wing compared with the limb brightening profile. Both higher spin value and steeper radial profile of the intensity can compensate for this deficit.
The higher spin value has the effect of shifting the inferred position of the marginally stable orbit (ISCO) closer to the black hole, in accordance with eq. (1.2). Consequently, the accretion disc is extended closer to the black hole. The radiation comes from shorter radii and it is affected by the extreme gravitational redshift. Hence, the contribution to the red wing of the total disc line profile is enhanced. Naturally, these considerations are based on the assumption that the inner edge of the line emitting region coincides with the ISCO. Likewise, the steeper radial dependence of the emissivity means that more radiation comes from the inner parts of the accretion disc than from the outer parts, and this produces a similar effect to decreasing the inner edge radius. With the limb brightening law the above-given considerations work the other way around.
We further simulated the data with the powerlaw + kyrline model. The simple model allows us to keep better control over the parameters and to evaluate the differences in the spin determination. We used one of the preliminary response matrices for the IXO mission and we chose the flux at a level similar to bright Seyfert 1 galaxies observable by current X-ray satellites (Nandra et al. 2007). The simulations with the kyrline model confirm that the measurements would overestimate the spin for the limb darkening profile and, vice versa, they tend to the lower spin values for the limb brightening profile.
Although the interdependence of the model parameters is essential and it is not possible to give the result of our analysis in terms of a single number, one can very roughly estimate that the uncertainties in the angular distribution of the disc emission will produce an uncertainty of the inferred inner disc radius of about % for the high quality data by IXO.222Here, we refer to the inner disc radius instead of the spin because the latter is not as uniform a quantity as the corresponding ISCO radius to express the uncertainty simply as a percentage value. However, we still suppose that the inner edge of the line emitting region of the disc coincides with the marginally stable orbit. We consider this value as realistic.
In the next step, we applied the NOAR radiation transfer code to achieve a self-consistent simulation of the outgoing spectrum without imposing an ad hoc formula for the emission angular distribution. We assumed a cold isotropically illuminated disc with a constant density atmosphere. We created new models for the ky suite. The results of NOAR computations of the cold disc are implemented in the kyl2cr model, while the kyl3cr model uses the angle-integrated tables over the entire range of emission directions. This enables us to include, a posteriori, the analytical formulae for directionality and check how precisely they reproduce the original angle-resolved calculations. We simulated the data using the preliminary IXO response matrix with the seed model powerlaw + kyl2cr. Then we replaced the kyl2cr model by kyl3cr to test the analytical directionality approaches on these artificial data.
We found that, for , none of the three assumed cases of the directionality profile covered the fiducial values for the spin and the inclination angle within the contour line (see Figs. 3.15–3.17). The suitability of the particular directionality prescription depends on the fiducial values of the spin and the inclination angle. The limb brightening profile successfully minimises the values for and deg (though with slightly different parameter values), but for and deg it gives the worst fit of all studied cases of the directionality laws.
On the whole, we found that the isotropic angular dependence of the emission intensity fits best. The model with the limb darkening profile was not able to reproduce the data, especially for higher values of the black hole spin. The best fit value exceeds for and deg, which means a more than three times worse fit than using isotropic or limb brightening directionality. The inclination angle was underestimated by more than deg, the -parameter was overestimated by almost .
This is an important result because much of the recent work on the iron lines, both in AGN and black hole binaries, has revealed a significant relativistic broadening near rapidly rotating central black holes (see e.g. Miller 2007). In some of these works, the limb darkening law was employed and different options were not tested. The modelled broad lines are typically characterised by a steep power law in the radial part of the intensity across the inner region of the accretion disc, as in the mentioned MCG -6-30-15 observation. This behaviour has been interpreted as a case of a highly spinning compact source where the black hole rotational energy is electromagnetically extracted (Wilms et al. 2001). We conclude that the significant steepness of the radial part of the intensity also persists in our analysis, however, the exact values depend partly on the assumed angular distribution of the emissivity of the reflected radiation.
It should be noted that, in reality, the angular distribution of the disc emission is significantly influenced by the vertical structure of the accretion disc. However, our comprehension of accretion disc physics is still evolving. In recent years, several detailed models have been developed for irradiated black hole accretion discs in hydrostatic equilibrium (see e.g. Nayakshin 2000; Ballantyne, Ross & Fabian 2001; Różańska et al. 2002). These models combine radiative transfer simulations with calculations of the hydrostatic balance in the stratified disc medium. Aside from reprocessing spectra, the models provide solutions for the vertical disc profile of the density, temperature, and ionisation fractions. In Goosmann et al. (2007) the effects of general relativity and advection on the disc medium were added.
In Nayakshin (2000), Goosmann et al. (2007), and Różańska & Madej (2008) the reprocessed spectra are evaluated at different local emission angles. The shape and normalisation of these spectra depend on various model assumptions. Until we know in more detail how accretion discs work, it is hard to choose which is the “correct” reprocessing model. One could always argue that more physical processes and properties should be included in the radiative transfer simulations, such as the impact of magnetic fields, macroscopic turbulence, or different chemical compositions of the medium. Using the above-mentioned models for an accretion disc in hydrostatic equilibrium may then easily become computationally intense.
For the practical purpose of data analysis, however, the computation of large model grids is necessary, which requires sufficiently fast methods. This is why simple constant density models are most often used to analyse the observational data. In fact, Ballantyne, Ross & Fabian (2001) have shown that their reprocessing spectra for a stratified disc medium in hydrostatic equilibrium can be satisfactorily represented by spectra that are computed for irradiated constant density slabs. Therefore, we included in our present analysis the angular emissivity obtained from the modelling of neutral reprocessing in a constant density slab. We have not discussed in any further detail the dependence on the ionisation parameter, which we expect to be rather important, and it will be possibly addressed in a future work.
We emphasise that the main strategy of our presented research is not intended to find the “correct” angular emissivity, as this is still beyond our computational abilities and understanding of all the physical processes shaping the accretion flow. Instead, we examined the three different prototypical dependencies which are mutually disparate (i.e., the limb-darkening, isotropic, and limb-brightening cases), applied in current data analysis, and which presumably reflect the range of possibilities. By including these different cases we mimic various uncertainties, such as those in the vertical stratification, and we estimate the expected error that these uncertainties can produce in the spin determinations. Further detailed computations of reprocessing models and the angular emissivity are needed in the future in order to understand its role in different spectral states of accreting black holes.
Chapter 4 Data reduction and spectral analysis
4.1 Preliminaries
4.1.1 XMM-Newton satellite
X-ray astronomy is essential to study neutron stars and accreting black holes. These objects would not be revealed on the sky without X-ray detectors which were first used in the early 1960s. It was quite a surprise at that time that the X-ray sky was so different from the optical sky. The first detected X-ray source besides our Sun, Scorpius X-1 (discovered by Aerobee 150 rocket launched on 12th June 1962), was found to be 10,000 times brighter in X-rays than in its optical emission. X-ray astronomy is not possible from the Earth surface because our atmosphere blocks out all X-rays. Only telescopes above the atmosphere can detect X-ray radiation. Following the first “rockoons” experiments (hybrid of a rocket and a balloon) many X-ray satellites have been launched.
The XMM-Newton satellite (X-ray Multi Mirror) belongs to the largest scientific satellites ever launched and it represents a cornerstone mission of the European Space Agency’s Horizon 2000 programme (Jansen et al. 2001). It was launched by the Ariane 504 rocket on 10th December 1999, and it is planned to operate still several more years. Its large effective area ( cm2) is its major advantage compared to other recent satellites (like Chandra). The satellite is in a highly eccentric orbit (between and km) allowing long uninterrupted exposure times ( hours). Observing time on XMM-Newton is being made available to the scientific community, applying for observational periods on a competitive basis. The data are stored in the publicly available archive111http://xmm.esac.esa.int/xsa.
The XMM-Newton satellite carries three CCD cameras for X-ray spectroscopy and imaging – European Photon Imaging Camera, EPIC, which includes two MOS detectors (Turner et al. 2001) and one PN detector (Strüder et al. 2001), two spectrometers for high resolution X-ray spectroscopy – Reflection Grating Spectrometer, RGS (den Herder et al. 2001), and one optical/UV imaging and grism spectroscopy instrument – Optical Monitor, OM (Mason et al. 2001). All these instrument are able to operate simultaneously. The main properties of the instruments are summarised in Table 4.1.
| Instrument | EPIC PN | EPIC MOS | RGS | OM |
|---|---|---|---|---|
| Energy bandpass | keV | keV | keV | nm |
| Orbital target visibility 1 | ks | ks | ks | ks |
| Sensitivity 2 | mag | |||
| Field of view | ||||
| Spectral resolution 3 | eV | eV | Å |
Notes: 1 The orbital target visibility represents the total time
available for scientific measurement per orbit. The value depends on what time the satellite
is outside van Allen radiation belts which could damage the detectors.
2 The sensitivity is a) for EPIC detectors: in units of erg s-1 cm-2
measured in keV range after 10 ks exposure,
b) for RGS detectors: in units of counts s-1 cm-2 measured
in O VII 0.57 keV line flux with a background of counts s-1 cm-2,
c) for OM: 5 detection of an A0 star in 1 ks exposure.
3 The spectral resolution of EPIC detectors is at 1 keV (at the energy of Fe K
line keV the energy resolution of both detectors is eV.
The resolution of OM is the resolving power ().
Observation modes of EPIC detectors
The EPIC detectors are suitable for our research of broad iron lines with their energy range (see Table 4.1) and high effective area. There are several observation modes which differ from each other mainly in the covered field of view and the read-out time. The basic characteristics of the PN and MOS observation modes are summarised in Tables 4.2-4.3. The “Full Frame” or “Extended Full Frame” modes are useful for faint sources where long read-out time is necessary to reach a reasonable signal to noise ratio. Oppositely, “Timing” mode or “Burst” mode are dedicated for observation of very bright sources to avoid the problem with pile-up (see Section 4.1.2). The duty cycle in the “Burst” mode is only 3 which means that the rest 97 of counts are lost.
| Modes | Time resolution [ms] | Live time [] | Max. count rate* [cts s-1] |
|---|---|---|---|
| Extended Full Frame | |||
| Full Frame | |||
| Large Window | |||
| Small Window | |||
| Timing | |||
| Burst |
| Modes | Time resolution [ms] | Live time [] | Max. count rate* [cts s-1] |
|---|---|---|---|
| Full Frame | |||
| Large Window | |||
| Small Window | |||
| Timing |
*The maximal count rate values are shown for a point source. Only observations of sources with lower flux avoid problems with an irremovable pile-up.
SAS - tool for reduction of the XMM-Newton data
The Science Analysis System (SAS) is a collection of tasks, scripts and libraries, specifically designed to reduce and analyse data collected by the XMM-Newton observatory (Gabriel et al. 2004). It is publicly available at http://xmm.esac.esa.int/sas, where also the instructions for install and usage are described. In this Section, we briefly summarise what is needed in preparation of the X-ray data before the spectral analysis and which is all accessible with the SAS software:
-
1.
The raw XMM-Newton data, called Observation Data Files (ODF), are provided in FITS (Flexible Image Transport System) format. The SAS software allows to create a calibrated and concatenated event list where events from all detector chips are included in one single file. The information about the instrumental calibration is necessary to properly interpret the data. The researchers are encouraged to use the most updated calibration data set.
-
2.
The SAS software helps its users to create scientific products according to their own taste and data screening criteria. High X-ray background flare events are standardly removed by creating of good-time intervals of the observation where the background level is under a certain criterion.
-
3.
After choosing good-time intervals, an X-ray image might be created. The source spectrum is extracted from the region on the chip where the point spread function (PSF) is the brightest (it is usually a circle around the centre of the PSF). The background spectrum is extracted from the outer regions of the same chip where the PSF is weaker.
-
4.
Each X-ray instrument has a typical response on the incoming radiation and has a different sensitivity in different wavelengths. The instrumental spectral transfer functions (response matrices) are needed for the quantitative spectral analysis. The SAS software allows the users to generate it for the individual observation.
- 5.
4.1.2 Pile-up
Pile-up is one of the biggest problems of the detection technique using a CCD camera when the observed source is too bright. Any CCD camera is composed from individual pixels which are collecting photons. The energy of an incoming photon invokes a charge in the photo-active region (in typical CCDs, epitaxial layers of silicon are used). The charge is then read-out during the duty cycle. Problem with pile-up occurs when two or even more photons deposit charge packets in a single pixel (“photon pile-up”), or in neighbouring pixels (“pattern pile-up”) during one read-out cycle.
In general, the pile-up makes spectra harder because two or more soft photons are detected as only one hard photon. In addition, when the summed energy is above a rejection threshold, it leads to a more or less pronounced depression of counts in the central part of the point spread function implying undesirable flux loss. The Tables 4.2-4.3 contain the values of the maximal count rates of the observed source fluxes for different observation modes to avoid the problem with pile-up. In general, the MOS detector is more susceptible to pile-up than the PN camera.
If the pile-up is only moderate, it might be removed by:
-
1.
using only single events, i.e. events where no signal is detected in neighbouring pixels. The single events are less sensitive to the pile-up than any multiple events.
-
2.
excising of the PSF core. However, this procedure may cause a drastic loss of counts.
A SAS task epatplot is a suitable tool for constraining the pile-up level. It measures the “pattern pile-up” which is proportional to the “photon pile-up”. The pattern pile-up occurs when two single events are interpreted as one double event with twice the energy. The probability of single and double events fractions can be modelled for a given flux. If there is a pile-up the double events are more frequent than predicted. The rate of diversion of the data from the theoretical model curves corresponds to the pile-up level.
We encountered the pile-up problem in the observation of a stellar-mass black hole binary, GX 339-4, performed by the XMM-Newton satellite in 2004, see Section 4.2.1 for details.
4.1.3 Re-binning of the data
There is not a unique way of the treatment with the data after their reduction described in Section 4.1.1. Some astronomers use the data for the spectral analysis without any re-binning. Some re-bin the data but with different conditions. The common condition for grouping is to have at least a certain number of counts per bin, e.g. 20. The reason is that the commonly used statistics for fitting the data is the Gaussian one with values describing the fit goodness, and the derived formulae of the Gaussian statistics are based on the assumption of a sufficient number of counts (see Section 4.1.4). However, when the number of counts per bin is not adequate C-statistics (Cash 1976) may be used, instead. Further, we discuss re-binning of the data because of the energy resolution rather than an insufficient number of counts.
The counts are intrinsically distributed in many channels of the instrument according to the detected energy of photons. However, the energy resolution of currently used X-ray instruments is not so brilliant and it is largely exceeded by the total number of channels. For instance, the PN detector has the energy resolution of order of eV (see Table 4.1) and the energy range keV which is about larger than the energy resolution. Thus, the corresponding number of energy bins of the width equal to the order of the energy resolution is . However, the PN detector has 4095 intrinsic channels in total, i.e. more than one order of magnitude more.
Hence, we find necessary to re-bin (group) the data with respect to the intrinsic resolution of the instrument. We find sufficient re-binning which over-samples the energy resolution by a factor of three. We use the pharbn script provided us by M. Guainazzi for this purpose. The energy resolutions of the instruments are typically approximated as power laws of the energy (with an exponent for the PN detector and for the MOS detector), and with a known energy resolution at some reference energy ( at 6 keV for PN, at 1 keV for MOS).
We emphasise that the interpretation of spectral results can be influenced by the adopted procedure of the data re-binning, and so different authors may reach different conclusions. We will illustrate this fact on an X-ray spectrum of GX 339-4 (see the details in Section 4.2.2).
4.1.4 Goodness of the fit
In this section, we briefly describe how to constrain the goodness of the fit. Readers are referred to e.g. Press (2002) for more information about different statistical techniques to analyse the data.
X-ray spectra are measured with spectrometers which do not obtain the actual spectrum but rather photon counts within specific instrument channels . This observed spectrum is related to the actual spectrum of the source by:
| (4.1) |
where is the instrumental response which is proportional to the probability that an incoming photon of energy will be detected in channel .
The instrumental spectral transfer functions (response matrices) are not generally invertible (see e.g. Blissett & Cruise 1979), and it is therefore insecure to reconstruct the original spectrum (so called unfolded spectrum). Instead of deriving for a given set of , model spectra are calculated how they would look like when passing through the detector. The predicted counts are:
| (4.2) |
and then, they are compared with the data counts .
The quality of the fit, i.e. how the model is able to interpret the data, is usually characterised by the value given by:
| (4.3) |
where is the number of counts in the energy bin (DATA), is the number of predicted counts in the energy bin (MODEL), and is the (generally unknown) error for the channel . The error is usually estimated as .
The statistics provides a goodness-of-fit criterion for a given number of degrees of freedom , which is calculated as the number of channels minus the number of model parameters, and for a given confidence level. If value exceeds a critical value one can conclude that the fit is not an adequate model for . As a general rule, one wants to have a reduced to be approximately equal to one (). A reduced value that is much greater than one, , indicates a poor fit, while indicates that the errors on the data have been over-estimated.
If , so the best-fit model pass the “goodness-of-fit” test, one still cannot say that is the only acceptable model. For example, if the data used in the fit are not particularly good, one may be able to find many different models for which adequate fits can be found. In such a case, the choice of the correct model to fit is a matter of scientific judgement.
There are several software packages to analyse X-ray spectra – XSPEC (Arnaud 1996), SPEX (Kaastra, Mewe & Nieuwenhuijzen 1996), ISIS (Houck & Denicola 2000). For all the spectral analysis presented in this Thesis, we used the XSPEC fitting package. The best-fit values of the model parameters were found using the modified Levenberg-Marquardt algorithm (Bevington 1969), which is the default one in the XSPEC. This algorithm is local rather than a global one, so we were aware of the possibility to get stuck in a local minimum instead of the global minimum by starting of the fitting process from reasonable initial values of model parameters. Therefore, we standardly repeated fitting procedures for several different initial parameter values.
4.2 GX 339-4
GX 339-4 belongs to the Galactic black hole candidates (Remillard & McClintock 2006). Dynamical properties of the system are still not completely known. The companion star stays unresolved by the present measurements even during the quiescent state of the object. However, the optical spectroscopy reveals periodic behaviour of He II and Bowen blend N III lines in spectra (Hynes et al. 2003; Buxton & Vennes 2003). Hynes et al. (2003) determined the orbital period of the system as . From the given period the radial velocity curve of the secondary can be fitted. The mass function is given by eq. (1.55). For GX 339-4: . The mass of the black hole can be determined from the knowledge of the inclination of the system and the ratio of the mass of the companion to the mass of the black hole (see eq. 1.55).
However, these quantities are not yet well constrained. Hynes et al. (2003) estimated the mass ratio from a small modulation of the wings of the He II line. The inclination angle is unknown. However, a jet is resolved from radio and infrared observations. The derived inclination from these measurements is (Gallo et al. 2004), but this need not be necessarily related with the inclination of the orbital plane.
We chose this object for our analysis because it exhibited a relativistic broadened iron line profile in the X-ray spectra in both high/soft state (Miller et al. 2004) and low/hard state (Miller et al. 2006), see Figure 2.4. This fact rather contrasts with the interpretation of the low/hard state via a truncated disc (Section 1.3.2). The extremely skewed line profiles suggest that the radiation comes from the innermost parts of the accretion disc within a few gravitational radii. Assuming accreting material radiates only above the marginal stable orbit it implies a high value of the spin of the black hole (Section 2). Miller et al. (2008) determined the value of the spin (statistical) (systematic) by joint fitting of two XMM-Newton and one Suzaku observations. The XMM-Newton spectra were re-analysed by Reis et al. (2008) who measured the spin value as (statistical) (systematic).
4.2.1 Low/hard state observation
The low/hard state observations of GX 339-4 were performed by the XMM-Newton satellite in March 2004 (Obs. ID #0204730201 and #0204730301). The MOS detectors were operating in the “Full Frame” mode. Although the object was in the low/hard state, it was still bright with the count rate cts s-1, i.e. more than one order of magnitude greater than the maximal recommended value to avoid the pile-up problem (cts s-1, see Table 4.3). Indeed, we found a substantial level of the pile-up in the data using the epatplot tool (see Section 4.1.2).
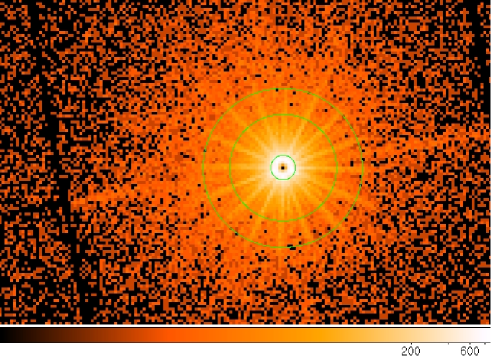
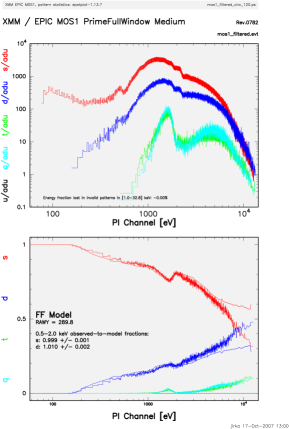
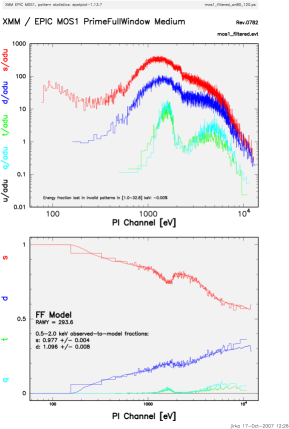
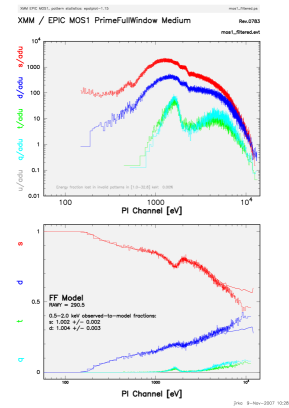
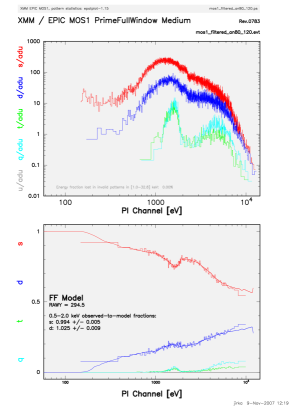
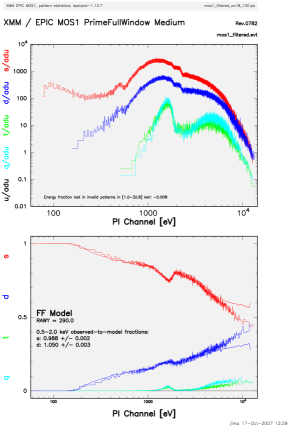
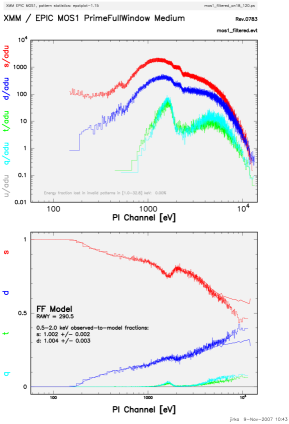
Figure 4.1 shows the central chip of the MOS 1 detector of the first observation (it is similar in the second observation). The black core itself indicates the over-exposition of the detector. Figures 4.2 and 4.3 show pattern distribution with the energy for two distinctly extracted regions from the central MOS chip of the two observations. The first extracted region is a circle around the core of point spread function (PSF) which is the standard way of the region extraction to obtain the source spectra if there is no pile-up problem. The radius was chosen as arcsec. The second region is an outer annulus between 80 and 120 arcsec. In this case, however, the most of the flux is lost, and the signal to noise ratio becomes very low.
The more deviated from the expected curves the pattern fractions are (bottom panels of the figures) the more significant the effect of pile-up is. It is clear that the pile-up is highly presented when the extracted region is the whole circle including the core of PSF. However, the pile-up is not completely removed nor for a faraway outer annulus though the level of the pile-up is much lower. Hence, the spectral analysis might be possible in combination with the use of only single events. However, the drastic excision of such a large region causes that the signal to noise is so low that the quantitative spectral analysis gives very poor constraints about the spectrum and is not suitable for a detailed investigation of any model parameters (not speaking of a very sensitive spin parameter).
Besides the two extreme extraction regions, we checked several annuli with the inner radius between 0 and 80 arcsec. We found that the pile-up is significant up to arcsec. Miller et al. (2006) were satisfied with an annulus arcsec. However, Figure 4.4 shows very strong indications of the pile-up in both observations for this extraction region. Because of the pile-up problem, we left these data sets as unsuitable for our purposes, regarding any spectral results obtained with these data as untrustworthy.
Meanwhile, the data were re-analysed by Done & Diaz Trigo (2009) who also found the pile-up level significantly high. Moreover, they performed a more comprehensive analysis including PN data, as well. They showed that the PN data are less affected by the pile-up than MOS data, and so they can be used for the spectral analysis if only single events are considered and the brightest core of PSF is excised (in the PN “Timing mode”, it means to excise several central columns of the source image). They concluded that the PN data do not support the presence of a broad iron line as suggested from the piled-up MOS data (presented by Miller et al. 2006 and Reis et al. 2008). They argued that missing relativistic smearing supports the truncated disc interpretation of the low/hard state. Similar issues with the pile-up were also reported by Yamada et al. (2009) with Suzaku data of GX 339-4.
Evidently, the pile-up issues and the possible ways of removing its degradation of the spectra are subject of discussions. Different researchers seem to agree on the general conclusion that the pile-up can be a serious problem. However, in individual observations the impact of the effect is often estimated differently. It appears that the problem can be definitively avoided only by future high throughput detectors.
4.2.2 Very high state observation
We also re-analysed the observation of GX 339-4 in the very high state (VHS). The PN detector was operating in the “Burst mode” which avoids the pile-up problem (see Table 4.2). Using the SAS task epatplot we found the pile-up to be insignificant with these data. Therefore, we used these data for the further spectral analysis and also for the comparison of the relativistic line models in Section 2.3.1. However, we obtained an unacceptable fit with when we applied the same model as in Miller et al. (2004) to the data in the energy range keV. The difference of the results is likely due to the different re-binning of the instrumental energy channels (see Section 4.5).
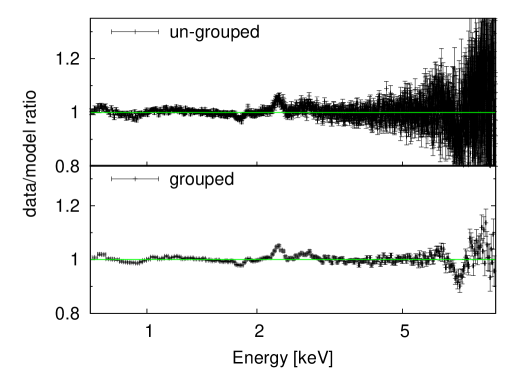
Figure 4.5 shows ratios of differently binned data to the same model as used in Miller et al. (2004) and Reis et al. (2008). The upper panel shows the data re-binned with the only condition to have at least 20 counts per bin, which was used in the mentioned works. This condition is, however, very weak with respect to the total number of counts and the total number of energy channels in the keV energy range. As a result, the data stayed practically un-binned and the energy resolution was excessively over-sampled.
In the lower panel of Figure 4.5, the data are re-binned with respect to the instrumental energy resolution (the energy resolution is over-sampled by a factor of three). An absorption feature at high energies which was concealed in large error bars of the ungrouped data is now clearly revealed. The discrepancy is even more visible in the quantitative spectral analysis, i.e. after constraining the fit-goodness in the keV energy range by the reduced values (see Section 4.1.4). While for the ungrouped data for the grouped data. After adding a Gaussian line to model a spectral feature at keV, possibly being some calibration issue only (Miller et al. 2004), for the ungrouped data, and for the grouped data in the energy range keV. So, the model would still have not been acceptable if applied to the appropriately grouped data.
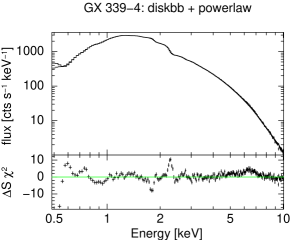
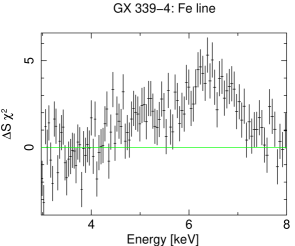
|
| model | parameter | Miller et al. (2004) | Reis et al. (2008) | our fit |
|---|---|---|---|---|
| phabs | cm | |||
| powerlaw | ||||
| normalisation | ||||
| diskbb | [keV] | |||
| normalisation | ||||
| laor | [keV] | |||
| [deg] | ||||
| normalisation | ||||
| smedge | [keV] | - | ||
| - | ||||
| [keV] | - | |||
Note: Miller et al. (2004) required the photon index of the power law to lie within of the value from the simultaneous RXTE measurements. The value is their upper limit.
Further, we analysed the spectrum of the re-binned data. First, we removed an artificial smedge model which was used by Miller et al. (2004) for fitting a smeared edge. As a next step, we allowed the model parameters of the continuum and also the iron line to float. As a result, we found a better fit with in 0.7–9 keV. The model parameters are shown in Table 4.4 and they are compared there with the values found by Miller et al. (2004) and Reis et al. (2008).
Our fit is characterised by a steeper power law with , a slightly hotter disc with keV, and a less prominent broad iron line. The column density cm-2 is slightly higher than the value cm-2 from the Leiden/Argentine/Bonn H I measurements (Kalberla et al. 2005), which may be explained by an additional local absorption. We tried also to add a reflection component into the model, as pexrav (pexriv) or refsch model, but without any improvements of the fit. Reis et al. (2008) used the refhidden model for fitting of the reflection component from the hot disc. However, we did not have the opportunity to use it because it is not a publicly available model.
The spectrum of GX 339-4 is shown in Figure 4.6 with a detailed view of the iron line band in the right panel. A broadened iron line feature is still present. However, due to the different slope of the underlying power law the line is much weaker than the one presented in Miller et al. (2004). The equivalent width found by Miller et al. (2004) is eV while our value is eV. The main difference is in the determination of the inner disc radius inferred from the iron line modelling. While Miller et al. (2004) and Reis et al. (2008) concluded that the black hole in GX 339-4 is very rapidly rotating with we found an intermediate value for the spin from our fitting, (see also Section 2.3.1).
4.3 MCG -6-30-15
MCG -6-30-15 is a nearby Seyfert galaxy () of the type I (see Section 1.4.2). This object is one of the most studied objects in X-ray domain since it exhibited a very broad iron line in the spectrum of the ASCA observation (Tanaka et al. 1995). The broadness of the line has been attributed to its origin from the relativistic accretion disc around a rapidly spinning black hole. Further investigations of this object with following X-ray missions confirmed the presence of the relativistically broadened iron K line: BeppoSAX (Guainazzi et al. 1999), XMM-Newton (Wilms et al. 2001; Fabian et al. 2002; Martocchia, Matt & Karas 2002; Vaughan & Fabian 2004; Brenneman & Reynolds 2006), Chandra + RXTE (Lee et al. 2002), and Suzaku (Miniutti et al. 2007). All cited authors concluded that the extension of the red wing can be reasonably interpreted only with models employing a very high value of the black hole spin. However, Miller, Turner & Reeves (2008b) showed in their analysis that the substantial X-ray data set for MCG -6-30-15, comprising all the mentioned missions, could be equally well fitted by an absorption-dominated model with no relativistically smeared emission. The main idea of this work is that the source is obscured by several clumpy absorption zones (“partial covering” absorption).
A possible way how to distinguish between the two different models is to study the time variability. The lack of variability in the energy range of the broad iron line was noticed by Fabian & Vaughan (2003) in the XMM-Newton spectrum and explained by the light bending model (Miniutti & Fabian 2004). They constrained the inner edge of the disc to be within two gravitational radii (the spin value ). However, Niedźwiecki & Życki (2008) pointed out that the line profile has always a pronounced blue peak in the light bending model, whereas the blue peak is missing in the deep minimum state observation (Iwasawa et al. 1996). Hence, Niedźwiecki & Życki (2008) concluded that the innermost region of the disc is not closer than 2–3 gravitational radii. It has been also shown that a possible warm absorber may have an important effect on the spectral variability (Miller, Turner & Reeves 2008b; Miyakawa et al. 2009). Within these models, the variability is explained by changing of the ionisation state of the warm absorber.
The uncertainty which model is more realistic pertains to all similar sources. A strong argument against partial-covering warm absorber model was pronounced by Fabian et al. (2009). In the X-ray spectrum of an extragalactic source, 1H0707-495, the authors detected an iron L line as well (thanks to extraordinarily high abundances of iron), and measured a time reverberation lag between the direct X-ray continuum and its reflection from matter falling into black hole. The time lag of 30 s is comparable with the light travel time within one gravitational radius, implying that the radiation must come from the closest neighbourhood around a maximally rotating black hole.
Long XMM-Newton observation of MCG -6-30-15
A long XMM-Newton observation took place in summer 2001 (31st July - 5th August) with the acquired exposure time was about 350 ks (Obs. #0029740101, #0029740701, #0029740801). The EPN and both MOS cameras were operating in the “Small Window” mode (see Section 4.1.1). The spectra were analysed by several authors (Fabian et al. 2002; Ballantyne, Vaughan & Fabian 2003; Vaughan & Fabian 2004; Brenneman & Reynolds 2006; Miller, Turner & Reeves 2008b, etc.). We re-analysed the data and then, we used them for analyses presented in the previous sections of the Thesis (Section 2.3 and 3.2.2). In this section, we describe the details of our re-analysis.
We reduced the EPN data from three sequential revolutions (301, 302, 303) using the SAS software version 7.1.2. Intervals of high particle background were removed by applying count rate thresholds on the field-of-view (EPIC, single events) light curves of 0.35 cts/s for the PN, and 0.5 cts/s for the MOS. The patterns 0–12 were used for both MOS cameras, and patterns 0–4 (i.e. single and double events) for the PN camera. The source spectra were extracted from a circle of 40 arcsec in radius defined around the centroid position with the background taken from an offset position close to the source. The two MOS spectra and the related response files were joined into a single spectrum and response matrix.
Using the FTOOL MATHPHA (part of the HEASOFT) we merged together the three spectra to improve the statistical significance. Further, we used the XSPEC version 12.2 for the spectral analysis. We re-binned all the data channels to over-sample the instrumental energy resolution maximally by a factor of 3 and to have at least 20 counts per bin. The first condition is much stronger with respect to the total flux of the source – erg cm-2 s-1 ( cts) in the 2–10 keV energy interval.
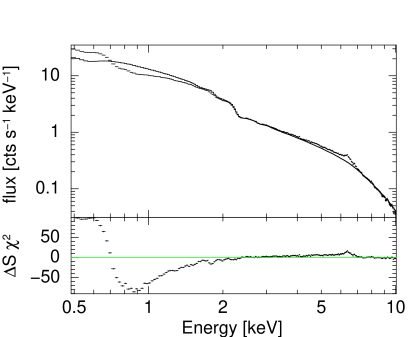
X-ray continuum
The resulting X-ray spectrum of MCG -6-30-15 is shown in Figure 4.7. Above keV, the X-ray continuum can be described by a power law component with the photon index absorbed by Galactic gas matter along the line of sight with column density cm-2 revealing a broad iron line at keV (Fabian et al. 2002). It is clear from the figure that other components need to be added into the model to describe the spectrum at lower energies as well.
The shape of the data residuals in lower energies suggests a combination of two effects: an additional absorption and a soft excess. The local additional absorption is usually attributed to a warm absorber, i.e. absorption by totally or partially ionised matter; see, e.g., Netzer et al. (2003); Blustin et al. (2005); Krongold et al. (2007) for more information about warm absorbers in Seyfert galaxies. The soft excess can be caused by reflection on the ionised surface of the accretion disc (Crummy et al. 2006). Alternative explanations for the soft excess are black-body radiation or complex partially ionised absorption (see Section 1.4.3 for brief discussion of the origin of the soft excess).
Brenneman & Reynolds (2006) included warm absorber and ionised reflection in their model and they showed that the extreme relativistic smearing is still required. However, in a spectral analysis by Miller, Turner & Reeves (2008a), the spectrum is characterised by a complex partial covering absorption in four different zones which affects the higher energy band more significantly implying that even no relativistic smearing was needed in the model. Our aim is not to discuss the appropriateness of the particular models. Instead, we relied on the model of a broad line which we used in Section 2.3 for a comparison of two iron line models, kyrline and laor, and in Section 3.2.2, for a comparison of different angular emissivity laws.
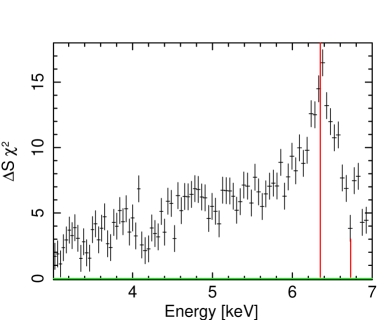
Iron line complex
The iron line complex (see Figure 4.8) consists of three components:
-
1.
a narrow line at keV possibly originating by reflection on a distant torus and/or outer parts of an extended accretion disc
-
2.
a broad relativistic line
-
3.
an additional narrow line which can be either an emission line keV (of hydrogen-like ionised iron atoms), or an absorption line at keV
It is impossible to distinguish from the spectral analysis the statistical preference between the models with the additional emission line of fully ionised iron atoms and with the absorption line of mildly ionised iron atoms. The values of the broad iron line parameters obviously depend on the parameters of the underlying model. However, it was discussed by Fabian et al. (2002) that the energy of the broad relativistic line is consistent with neutral iron K line originating in the innermost regions of cold disc independently of the inclusion of the narrow emission or absorption line. This was confirmed in the analysis by Brenneman & Reynolds (2006) who preferred the emission line at keV because they found it to be more consistent with a Chandra observation (Young et al. 2005). However, they considered also the model with the absorption line. They found the equivalent width of the absorption line eV much less than the one derived by Fabian et al. (2002), where eV, and so, they concluded that it is not robustly required by the fit.
We considered both cases and realised that the parameters of the broad iron line are more sensitive to the underlying model than it was suggested from the previous works, including the broad line energy, i.e. the ionisation state of the disc.


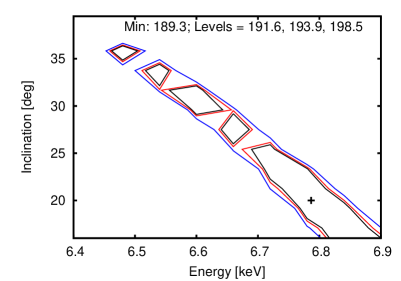
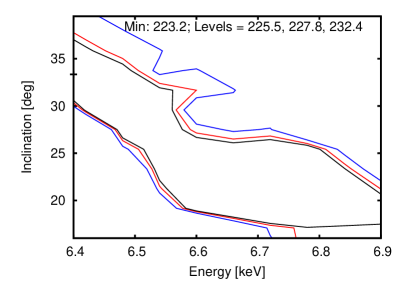
The energy of the narrow absorption line was constrained to be keV, see the left panel of Figure 4.9, where the dependence of the goodness of the fit is plotted against the energy of the absorption line. The photon index of the power law, spin, inclination, energy and radial emissivity of the broad iron line, and all normalisations were allowed to vary during the fitting procedure. We measured the equivalent width of the absorption line eV, consistently with the result obtained by Brenneman & Reynolds (2006).
The alternative model employs the emission line, instead. The energy of the narrow emission line was constrained to be keV, a rather lower value than keV considered by Fabian et al. (2002), but consistently with Brenneman & Reynolds (2006). The total goodness of the fit against the energy of the emission line is shown in the right panel of Figure 4.9. The equivalent width is eV, i.e. about twice larger than the value by Brenneman & Reynolds (2006).
Further, we investigated how the energy of the broad iron line depends on the choice of one of the model alternatives. We constructed contour plots for the energy of the broad line and inclination angle for the two model alternatives - see Figure 4.10. The parameters of the narrow lines modelled as Gaussian profiles were fixed. We used keV for the energy of the absorption line, and keV for the energy of the emission line. The photon index of the power law, spin, inclination, energy and radial emissivity of the broad iron line, and all normalisations were allowed to vary during the fitting procedure.
The values for the broad line energy are relatively consistent, similarly depending on the inclination angle value. Nevertheless, in the alternative with the absorption line (left panel of Figure 4.10), the ionised case is preferred rather than the case of a cold disc.
4.4 IRAS 05078+1626
IRAS 05078+1626 is a nearby Seyfert 1.5 galaxy. Before its identification as an infrared source it was also known as CSV 6150 (Catalogue of Suspected Variables). Its position on the sky is and in the Galactic coordinates. The cosmological redshift of this galaxy is (Takata et al. 1994). It had never been spectroscopically examined in X-ray prior to the observation discussed in this Thesis. However, it was detected in a number of X-ray surveys, such as the all-sky monitoring of the INTEGRAL IBIS/ISGRI instrument (Sazonov et al. 2007), the SWIFT BAT instrument (Ajello et al. 2008; Tueller et al. 2008), and the RXTE Slew Survey (XSS) (Revnivtsev et al. 2004).
The X-ray spectroscopic properties of intermediate Seyferts are rather elusive: both obscured Type 1 and unobscured Type 2 active galactic nuclei (AGN) have been reported (e.g., Cappi et al. 2006; Brightman & Nandra 2008; Bianchi et al. 2009b). It has been suggested that intermediate Seyfert galaxies are seen at intermediate inclination angles between pure “face-on” Seyfert 1s and pure “edge-on” Seyfert 2s, which follows directly from the orientation-based AGN unification scenarios (Antonucci & Miller 1985; Antonucci 1993; Urry & Padovani 1995). For this reason, X-ray spectroscopy of type 1.5 Seyferts may provide clues to the nature and geometrical distributions of optically thick gas surrounding the active nucleus, the latter being the fundamental ingredient behind the unification scenarios.
IRAS 05078+1626 is included in the FERO project (“Finding Extreme Relativistic Objects”; Longinotti et al. 2008) with the aim of establishing the fraction of a relativistically broadened K iron lines in the spectrum of a complete flux-limited sample (2–10 keV flux 1 mCrab).

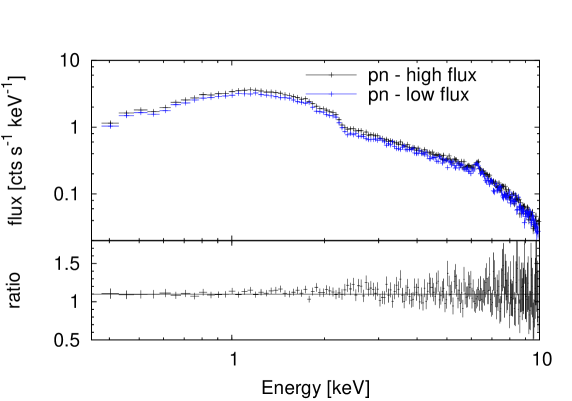
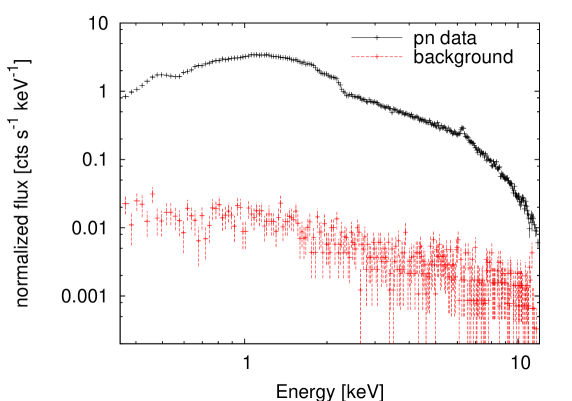
4.4.1 Results from XMM-Newton observation in 2007
Observations and data reduction
The XMM-Newton observation of IRAS 05078+1626 was performed between 2007 August 21 UT 22:24:49 and 22 UT 15:35:43 (Obs. #0502090501). The EPN and both MOS cameras were operating in the “Small Window” mode (see Section 4.1.1). The RGS cameras were operating in the “Spectroscopic” mode (den Herder et al. 2001). The spectra were reduced with the SAS software version 9.0.0 (Gabriel et al. 2004). Intervals of high particle background were removed by applying count rate thresholds on the field-of-view (EPIC, single events) and CCD #9 (RGS) light curves of 0.35 cts/s for the PN, 0.5 cts/s for the MOS and 0.15 cts/s for the RGS. The exposure time after data screening is ks for MOS, ks for PN and ks for RGS, respectively. The patterns 0–12 were used for both MOS cameras, and patterns 0–4 (i.e. single and double events) for the PN camera. The source spectra were extracted from a circle of 40 arcsec in radius defined around the centroid position with the background taken from an offset position close to the source. The two MOS spectra and the related response files were joined into a single spectrum and response matrix. Finally, the PN and MOS spectra were re-binned in order to have at least 25 counts per bin and to over-sample the energy resolution of the instrument maximally by a factor of three, while the RGS spectra were left un-binned. Consequently, different statistics were used in fitting the spectra – the traditional statistics to fit the PN and MOS spectra and the C-statistics (Cash 1976) for all fits including RGS data. For the spectral analysis, we used XSPEC version 12.5, which is part of the HEASOFT software package version 6.6.
Timing properties
The PN light curve of the source is shown in Figure 4.11. We have divided the energy range into two bands and checked the light curve behaviour in each of them, as well as a hardness ratio, which we defined as the ratio of the counts at 2–10 keV to the counts at 0.2–2 keV. The energy ranges were chosen for sampling different spectral components, as indicated by the energy where the continuum starts deviating from a power law model that describes the hard X-ray spectrum (see Sect. 4.4.1). The hardness ratio stays almost constant during the observation, suggesting that no significant spectral variations occur, although the source flux increased by around 20%.
To confirm this conclusion also for narrow spectral features, such as the iron emission line, we compared the PN spectra extracted during the first and the second halves of the observation (see Figure 4.12). The spectra correspond to the lower/higher source flux because the flux is increasing nearly monotonically during the observation. We calculated the ratio values of the two data sets and fit them with a simple function using the least square method. The fitting results are and with the sum of the residuals for 190 degrees of freedom. When we set , the fitting results are comparably good with and . The ratio of the spectra is plotted in the lower panel of Figure 4.12. Because no significant spectral differences are evident222Meanwhile, de Marco et al. (2009) reported study of variability of FERO-sample galaxies, including IRAS 05078+1626. They also found that the spectral variability of this source is diminutive., we analyse the time-averaged spectra hereafter.
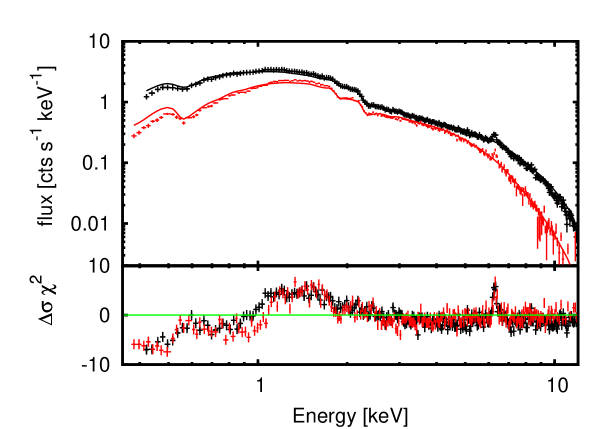
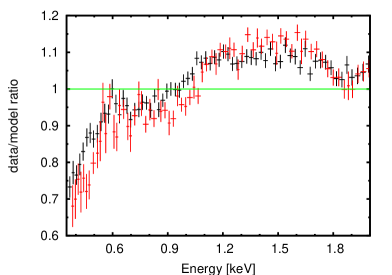
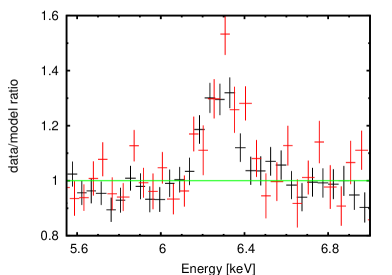
Mean spectral properties
The signal-to-noise ratio is very good up to high energies (Figure 4.13), so we fit the EPIC spectra spectra in the full energy range where they are well calibrated (0.35–12 keV). The X-ray continuum is described by a power law model at energies above 2 keV, although the iron line at keV is present (Figure 4.14). The photon index of the power law is . In this and all subsequent models we included absorption by Galactic gas matter along the line of sight with column density cm-2. This value is from the Leiden/Argentine/Bonn H I measurements (Kalberla et al. 2005). We used the tbabs model (Wilms, Allen & McCray 2000) to fit the absorption produced by the Galactic interstellar matter.
We applied the simple tbabs*powerlaw model to both PN and MOS spectra. The value is 3557 with 528 degrees of freedom () in the keV energy range. The spectra differ from the power law model not only around keV but also at lower energy band keV (adding a Gaussian line model to fit the iron line improves the fit only to ). Residuals against this model are shown in Figure 4.15. They may be due to a warm absorber and/or soft excess.
The spectral residuals reveal certain discrepancies between the PN and MOS spectra (see Figure 4.15 with the data/model ratios of both spectra, PN and MOS, with the identical model parameters of the spectra). The level of discrepancy is, however, comparable to the level of systematic uncertainties in the cross-calibration between the EPIC cameras (Stuhlinger et al. 2006). Nonetheless, we conservatively analyse the EPIC spectra separately. We use the same models for both spectra but allow the values of the model parameters to be different. The values of the photon index using the simple power law model differ from each other when fitting the spectra independently, resulting in a harder PN spectrum with compared to the MOS spectrum with , ignoring the energies below 2 keV and also between 5.5-7.5 keV. Although the absolute value of these spectral index measurements does not have a direct physical meaning, given the simplicity of the model applied on a small energy band, the comparison between them is illustrative of the quality of the cross-calibration between the EPIC cameras. Differences of the order of 0.06 in the hard X-ray band are consistent with current systematic uncertainties (Stuhlinger et al. 2006).
RGS spectrum
We jointly fit the un-binned first-order spectra of the two RGS cameras with the same model’s parameter values except the overall normalisations. The continuum is well-fitted by the simple power law model with the photon index . We searched further for narrow emission and absorption lines in the spectrum using several zgauss models with the intrinsic width set to zero. We calculated the 90 % confidence interval for a blind search, as , where and . For the RGS data , to which corresponds assuming the Student probability distribution. The only line fulfilling this criterion by improving the fit about is an emission line at the energy keV () and the equivalent width eV. We identified it with the forbidden line of the O VII triplet ( keV).
EPIC spectrum
The forbidden line of the OVII triplet is clear signature of a photoionised plasma. No significant features were detected that may be expected alongside the O VII (f) line, if it were produced in a collisionally ionised plasma, such as the resonance line in the OVII triplet or the OVIII Ly. This led us to try and explain the residuals against a power law model in the soft X-rays as effect of intervening ionised absorption gas. We used the xstar model version 2.1ln7c (Kallman & Bautista 2001)333http://heasarc.gsfc.nasa.gov/docs/software/xstar/xstar.html to calculate a grid of tabular models with the input parameters constrained from the preliminary data analysis with simple models whenever possible (photon index , density cm-3, luminosity erg s-1, column density cm cm-2, and ionisation parameter ).
| Model | Model | ‘baseline’ model | ‘final’ (‘double reflection’) model | |||
| component | parameter | PN | MOS | PN | MOS | PN+MOS+RGS |
| zphabs | cm | |||||
| xstar | cm | |||||
| He/HeSolar - Ca/CaSolar | (f) | (f) | (f) | (f) | (f) | |
| FeFeSolar - NiNiSolar | ||||||
| powerlaw | ||||||
| normalisation | ….. | |||||
| reflion | (b) | (b) | (b) | (b) | (b) | |
| FeFeSolar - NiNiSolar | (b) | (b) | (b) | (b) | (b) | |
| normalisation | ….. | |||||
| reflion 2 | normalisation | - | - | ….. | ||
| zgauss | E [keV] | - | - | - | ||
| [keV] | - | - | - | |||
| z | (f) | (f) | - | - | - | |
| normalisation | - | - | - | |||
| 246/264 | 405/243 | 256/266 | 404/244 | = 1551/1347 | ||
Note: The sign (f) after a value means that it was fixed during the fitting procedure. The sign (b) means that the parameter was bound to the value of the corresponding parameter of the previous model component. The sign “-” means that the model component was not included while dots only mean that there are more values related to the individual spectra which are not necessary to be all shown in the table.
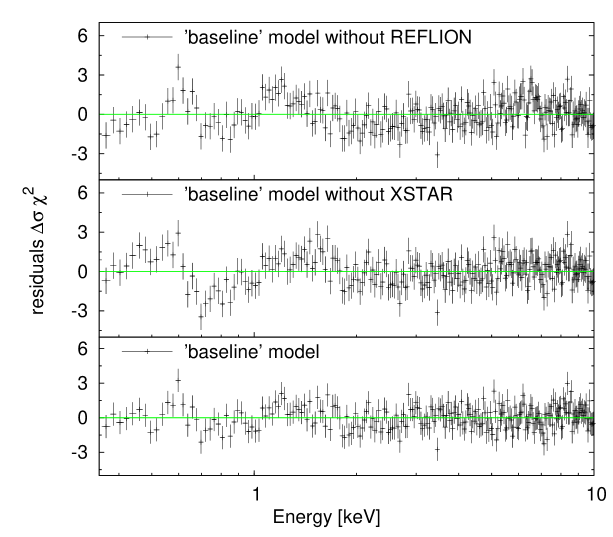
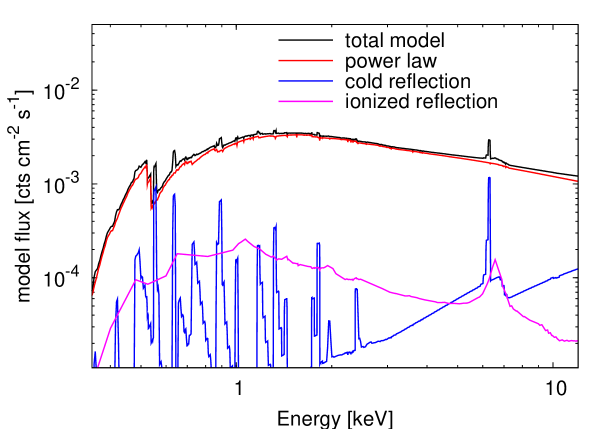
A single-zone warm absorber component modifying the power law continuum dramatically improved the fit from to for the PN spectrum. The ionisation parameter converged to a very low value, and we found that this almost neutral absorption can be successfully reproduced with zphabs, which is a simpler model than xstar, so we preferred this possibility. The addition of another warm absorber zone improves the fit to for the PN spectrum, and it requires the ionisation parameter . We checked that adding another warm absorber zones does not improve the fit significantly. The residuals from the model (see Figure 4.16, upper panel) reveal an extra emission that remains at low energies, as well as around the iron K line band.
These features can come from reflection of the primary radiation on the surface of the accretion disc, so we added the reflion model (Ross & Fabian 2005), which calculates the ionised reflection for an optically thick atmosphere with constant density. We examined the significance of the addition of the reflection component into the complex model of the PN spectrum by the statistical F-test. The low value of the F-test probability () strongly favours this additional model component. The best fit was now for the PN spectrum. We hereafter call this model the ‘baseline’ model; in the XSPEC notation: tbabs zphabs xstar (powerlaw + reflion + zgauss).
The parameter values of the ‘baseline’ model are presented in the Table 4.5. The quoted errors of the parameters represent a 90 confidence level for a single interesting parameter. The measurement is obviously affected by a much larger systematic error, which, however, could be properly quantified only if we knew the “right” model. The value of the power law photon index increased to compared to the simple model applied to the data in Sect. 4.4.1, because we included the additional local absorption in the model. The data residuals from the model are shown in the lower panel of Figure 4.16. In the same figure, we also show residuals from the best fit performed with the ‘baseline’ model, excluding the ionised absorption (middle panel) and the ionised reflection component (upper panel).
The narrow iron K line with the rest energy keV, the width keV, and the equivalent width eV evidently represents cold reflection. This suggests an origin of this spectral component in the outer part of the disc, or from the torus. The cold reflection is also supposed to contribute to the soft part of the spectrum with the individual emission lines. For this reason, we replaced the Gaussian profile in the ‘baseline’ model with another reflion component (called as reflion 2 in the Table 4.5) with the same values for the photon index and abundances as the reflion 1 model component. The ionisation parameter was kept free during the fitting procedure, but it very quickly converged to its lowest value (). The advantage of the reflion model compared to the other available reflection models is that it also includes the soft X-ray lines, with the disadvantage in this case that the ionisation parameter cannot be set to zero.

| Model | Flux at keV | Flux at keV | ||
|---|---|---|---|---|
| component | erg cm-2 s-1] | erg cm-2 s-1] | ||
| PN | MOS | PN | MOS | |
| total model | ||||
| unabsorbed model | ||||
| powerlaw | ||||
| reflionion | ||||
| reflioncold | ||||
| ∗ | ||||
| ∗ | ||||
∗ the ratios of the reflection component flux values to the flux value of the total unabsorbed model (sum of the primary and reflected radiation).
This ‘double reflection’ model, in the XSPEC notation tbabs zphabs xstar (powerlaw + reflion + reflion), does not significantly improve the fit goodness over the ‘baseline’ model (with for the PN spectrum), but it represents a more self-consistent astrophysical picture. Therefore, we call the ‘double reflection’ model as ‘final’ model. In contrast to the ‘baseline’ model, it does not require sub-solar iron abundances, see the Table 4.5, where the parameter values for this model are presented. The ‘final’ model with each component separately drawn is shown in Figure 4.17. All the plotted components are absorbed by a warm absorber surrounding the central accretion disc and two kinds of cold absorber – one from Galactic interstellar matter and one from local absorber in the host galaxy.
Some model parameters were not allowed to vary during the fitting procedure. The redshift of the ionised absorber was fixed to the source cosmological value, because leaving it free yields a negligible improvement in the quality of the fit. Second, we used the same iron abundances across all the components in the model.
In the ‘final’ model, the warm absorber ionisation parameter is consistent with the ionised reflection component. This result is also presented in Figure 4.18, where the contour lines related to the , , and levels of between the ionisation parameters of the two model components are presented.
Table 4.6 summarises flux values of the individual components of the ‘final’ model for both PN and MOS spectra for two energy bands, keV and keV, and also shows fractions of the reflection radiation to the total emission (sum of the primary and reprocessed radiation). The flux ratio is almost equally shared between the cold and ionised reflection components, and its value is in total . The absorption–corrected luminosity values of the source in the same energy bands are erg s-1 and erg s-1, respectively.
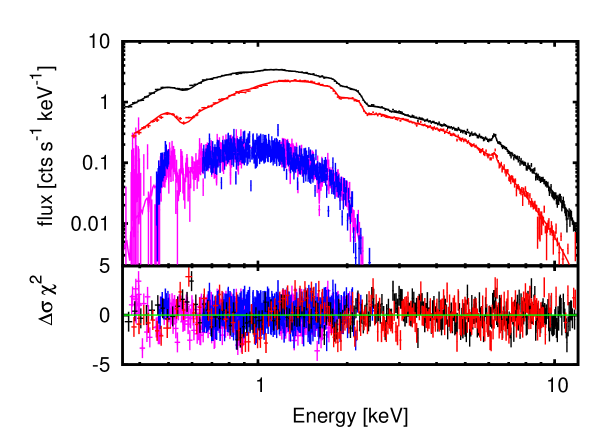
We also used the ‘final’ model for a joint fitting of all the XMM-Newton instruments (PN, MOS and both RGS spectra) together. The parameter values were bound among all the spectra, only normalisation factors were allowed to vary. The goodness of the joint fit is given in C-statistics because the RGS data are un-binned (and each individual bin contains only a few counts). The result is for a number of degrees of freedom . All the spectra, together with the residuals, are shown in Figure 4.19, and the corresponding parameters in the last column of Table 4.5.
4.4.2 Discussion of the results
Constraints on the location of the absorbers
In this section, we discuss a possible location of the absorber’s system in the ‘final’ model. Photoelectric absorption is almost invariably observed in Type 2 Seyferts (Awaki et al. 1991; Turner et al. 1997; Risaliti, Elvis & Nicastro 2002) and generally attributed to an optically thick matter responsible for orientation-dependent classification in AGN unification scenarios (Antonucci & Miller 1985; Antonucci 1993).
Because the IRAS 05078+1626 galaxy is probably viewed under an intermediate inclination between unobscured Seyfert 1s and obscured Seyfert 2s, the torus rim may also intercept the line of sight to the AGN and absorb the radiation coming from the centre. The cold absorption can, however, also be associated with the interstellar matter of the galaxy (Lamastra, Perola & Matt 2006).
Both reflection components are inside the ionised absorber in the ‘final’ model. The geometrical interpretation is that the cold reflection occurs on the outer parts of the disc or the inner wall of the torus. Reflection on the nearer part of the torus is heavily absorbed by the torus itself, so only radiation reflected on the farther peripheral part of the torus can reach the observer after passing through the warm absorber. However, an alternative scenario, in which the cold reflection is unaffected by the warm absorber, i.e., tbabs zphabs [reflioncold + xstar (powerlaw + reflion )], is also acceptable with .
The lack of constraints on the variability in the warm absorbed features (Krongold et al. 2007), caused by the moderate dynamical range of the primary continuum, as well as statistical limitations in our spectra, prevents us from precisely constraining the location of the warm absorber.

Constraints on the location of the ionised reflector
The ionised reflection might occur either at the inner wall of a warm absorber cone or on the accretion disc. Even in the latter case, the reflection cannot occur arbitrarily close to the black hole. In this section we investigate the constraints of the accretion disc location and structure, which can be drawn from the lack of the significant relativistic blurring of the disc reflection component.
We convolved the ionised reflection component with the fully relativistic kyconv model (Dovčiak, Karas & Yaqoob 2004). Two assumptions about the disc emissivity were considered. First, the radial part of the intensity decreases with the power of the disc radius (), where the value of was allowed to vary between and . Second, the angular dependence was assumed to be isotropic which seems to be appropriate approximation for our situation of an X-ray irradiated accretion disc (Svoboda et al. 2009).
We examined the expected confidence levels of the best-fit values of the disc’s inner radius by stepping this parameter in the whole range of its possible values – from the horizon to the outer disc radius, which we set to 400 gravitational radii (). The results are shown in Figure 4.20. At the 90 % confidence level, the accretion disc is not allowed to extend closer to the black hole than .
The “relativistic blurring method” would be less appropriate in looking for the imprints of the innermost parts of the accretion disc if the disc were too highly ionised (log) and the narrow reflection features were not present (Ross & Fabian 2005). However, the ionisation parameter value of the reflection component is not so high in the ‘final’ model and the dominant feature is the intermediately ionised iron line ( keV). If we assumed a stratified disc with the ionisation state decreasing with the radius from the centre, the hydrogen-like iron line would be also expected to appear in the spectrum (as an intermediate stage between the over-ionised and mildly ionised contribution). Because it is not detected in the data, the accretion disc truncation provides a more reasonable explanation of missing signatures of the relativistic blurring.
Mass accretion rate
Disc truncation is expected in low–luminosity AGN where the inner accretion flow is advection-dominated (Narayan & Yi 1994; Esin, McClintock & Narayan 1997; Narayan & McClintock 2008, and references therein). The transition from the outer standard accretion disc may occur, e.g., via the disc evaporation mechanism (Meyer, Liu & Meyer-Hofmeister 2000; Liu & Taam 2009). The observational evidence of a truncated accretion disc in low–luminosity AGN was reported e.g. by Lasota et al. (1996); Quataert et al. (1999). However, its presence is also suggested in some observations of Seyfert galaxies (Lu & Wang 2000; Done, Madejski & Życki 2000; Chiang & Blaes 2003; Markowitz & Reeves 2009) and even a quasar (Matt et al. 2005) where the luminosity value is estimated as a half of the Eddington value. Generally, it is expected that the lower the luminosity, , the larger transition radius (see Yuan & Narayan 2004, and references therein). Furthermore, we investigate whether the disc truncation hypothesis is consistent with the IRAS 05078+1626 luminosity. To have these quantities in Eddington units, we first estimated the mass of the black hole.
IRAS 05078+1626 belongs to the sample of the infrared-selected Seyfert 1.5 galaxies observed by a 2.16 m optical telescope (Wang, Wei & He 2006) where, among others, the velocity dispersion in the O III emission line was measured. The correlation between the O III line width and the mass of active galactic nucleus was discussed in Nelson (2000) and Boroson (2003). The value from the optical measurements, km s-1, corresponds to the mass using a correlation plot in Boroson (2003). The scatter of the correlation is somewhat large with the reported limit of a factor of 5 for an uncertainty in the black hole mass determination, so the value only provides an order of magnitude estimation.
The value of the Eddington luminosity is erg s erg s-1 for the given value of the mass. We used luminosity-dependent corrections by Marconi et al. (2004) to estimate the bolometric luminosity of IRAS 05078+1626 from the X-ray luminosity. Its value is erg s. Correspondingly, the mass accretion rate, , is sub-Eddington with . This value is typical of less luminous Seyfert galaxies (see for example Bianchi et al. 2009a), and is consistent with the disc truncation hypothesis.
Chapter 5 Conclusions
We employed the relativistic models of iron line to probe the innermost regions of black hole accretion discs with the current X-ray data by XMM-Newton, and with the simulated data for next generation X-ray missions. We found the modelling of broad iron lines to be a suitable method to measure the angular momentum of black holes at all scales – from stellar-mass microquasars to giant black holes of billions solar masses of distant quasars. In this section, we summarise the main conclusions of our investigation presented in the previous chapters.
5.1 Relativistic line models
In Section 2, we described how the observed profile of an intrinsically narrow emission line is distorted due to the effects of rapid orbital motion and strong gravity. We investigated the iron line band of the X-ray spectrum for two representative sources – MCG -6-30-15 (active galaxy) and GX 339-4 (X-ray binary). The iron line is statistically better constrained in the active galaxy MCG -6-30-15 due to a significantly longer exposure time of the available observations. The spectra of both sources are well described by a continuum model plus a broad iron line model. We determined the spin values using the kyrline model as:
-
•
MCG -6-30-15: ,
-
•
GX 339-4: .
The value for MCG -6-30-15 is consistent with previously obtained results (Fabian et al. 2002; Brenneman & Reynolds 2006). However, in the case of GX 339-4, our best-fit value is lower than the one by Miller et al. (2004) and Reis et al. (2008). The model with their derived values does not provide an acceptable fit when applied to the data re-binned with respect to the instrumental energy resolution. We found that the iron line is not as extremely broad as previous analyses suggested, and the spin value has rather an intermediate value .
We compared two relativistic models of the broad iron line, laor and kyrline. In contrast to laor, the kyrline model has the spin value as a variable parameter. However, the laor model can still be used for evaluation of the spin if one identifies the inner edge of the disc with the marginally stable orbit. We realised that the discrepancies in the results between the kyrline and laor models are within general uncertainties of the spin determination using the skewed line profile when applied to the current data (for MCG -6-30-15: , and for GX 339-4: ). This means that the spin is currently determined entirely from the position of the marginally stable orbit, as it is done with the laor model.
However, the results are apparently distinguishable for higher quality data, as those simulated for the next generation X-ray missions, which will be sufficiently sensitive to resolve the slight variations in the overall line shape due to the spin. We found that the laor model tends to over-estimate the spin value and furthermore, it has insufficient energy resolution which affects the correct determination of the high-energy edge of the broad line. The discrepancies in the overall shape of the line by the laor model are more visible especially for lower values of the spin.
Another advantage of the kyrline model over the laor model is that the kyrline model gives better pronounced minima of for the best-fit values. The confidence contour plots for versus other model parameters are more regularly shaped. This indicates that the kyrline model has a smoother adjustment between the different points in the parameter space allowing for more reliable constraints on spin.
5.2 Emission directionality
In Section 3, we investigated how the black hole spin measurements using X-ray spectroscopy of relativistically broadened lines depend on the employed definition of the angular distribution of the disc emission. We considered three different approximations of the angular profiles, representing limb-brightening, isotropic and limb-darkening emission profiles. We studied the role of the emission directionality in the spin determination with the current data - we used the XMM-Newton observation of MCG -6-30-15, and with the artificial data simulated with energy resolution and sensitivity of future X-ray missions, such as IXO (International X-ray Observatory).
We realised that the use of an improper directionality profile could affect the other parameters inferred from the relativistic broad line model. Especially for the frequently used case of limb darkening, the radial steepness can interfere with the line parameters of the best-fit model by enhancing the red wing of the line. The limb darkening law favours higher values of spin and/or steeper radial dependence of the line emissivity; vice-versa for the limb brightening profile.
Steeper radial emissivity in the innermost region of an accretion disc has been detected in several other sources, both in AGN and black hole binaries (Miller 2007). The improperly used limb darkening in the reflection model represents one of the possible explanations. For this reason, constraining the “correct” directionality in more sophisticated models of reflection spectra of accretion discs is desirable.
We applied the NOAR radiation transfer code to achieve a self-consistent simulation of the outgoing spectrum reflected from a cold disc without imposing any ad hoc formula for the emission angular distribution. We found that the isotropic directionality reproduces the simulated data to the best precision. On the other hand, the model with the limb-darkening profile was not able to reproduce the simulated data especially for the higher values of black hole spin.
We consider this to be an important result since much of the recent work on the iron lines has revealed a significant relativistic broadening near rapidly rotating central black holes. In some of these works, the limb darkening law was employed without testing different options. The modelled broad lines are typically characterised by a steep power law in the radial part of the intensity across the inner region of the accretion disc, as in the mentioned MCG -6-30-15 observation. We conclude that the significant steepness of the radial part of the intensity also persists in our analysis, however, the exact values depend partly on the assumed angular distribution of the emissivity of the reflected radiation.
5.3 Data reduction
We re-analysed XMM-Newton observations of MCG -6-30-15 and GX 339-4. According to the previous X-ray spectroscopy analyses, these sources exhibited extremely broad iron lines. The results of our spectral analysis are discussed in the context of the aspects of iron line modelling in Sections 2-3. We stressed that the correct re-binning of the data, which reflects the energy resolution of the used instrument, is necessary to obtain statistically relevant results. The un-grouped EPIC/PN or MOS data are characterised by large error bars which implies that any applied model produces lower values when fitting such data (see Section 4.2.2). As a consequence, a larger set of different models may be accepted, including the incorrect models which would be excluded if the data were properly grouped.
Photon pile-up is another problem which may affect the spectral analysis significantly. It occurs during exposures of too bright sources, such as some Galactic black hole binaries. We encountered a serious problem with the pile-up in the data re-analysis of the low/hard state observations of GX 339-4 (see Section 4.2.1). We found that the elimination of the pile-up by excising the core of the point spread function of the source is possible only at the cost of a drastic loss of counts which makes any interpretation of the spectra rather disputable.
5.4 X-ray spectrum of IRAS 05078+1626
In Section 4.4, we presented a spectral analysis of the XMM-Newton observation of a Seyfert galaxy IRAS 05078+1626 being the first X-ray spectroscopy study of this source.
The X-ray continuum spectrum of IRAS 05078+1626 is dominated by a power law with a standard value of the photon index ( in the ‘final model’). The residuals from the power-law continuum can be interpreted in terms of a warm absorber surrounding an accretion disc, and a reflection of the primary radiation from an ionised matter and on a cold torus. The outgoing radiation is absorbed by cold matter ( cm-2), which can be either located in the inner side of the torus or caused by gas in the host galaxy. The type of the galaxy determined from the previous infrared and optical research is Seyfert 1.5, suggesting that the active nucleus could be seen at large inclination, consistent with either interpretation or even allowing a combination of both.
The ionised warm absorber occurs in the central part of the AGN. Its column density was found to be cm-2, which is a rather high value compared to the warm absorbers detected in other Seyfert galaxies (Blustin et al. 2005). This may be because we are looking through a longer optical path of a conical non-relativistic outflow due to the high inclination of the system. Such a conical outflow is suggested in the model by Elvis (2000) (see Figure 1.7). The ionisation parameter of the warm absorber is , which is comparable to the value related to the ionised reflection , suggesting a link between them.
If the ionised reflection is associated to the warm absorber (e.g. the inner walls of a conical outflow), the lack of spectral features associated with the accretion disc is a natural consequence thereof. If, instead, the ionised reflection occurs at the accretion disc, it cannot extend up to the marginally stable orbit. The lack of the significant relativistic blurring of this model component requires the disc to be truncated (inner disc radius ). This idea is also supported by the low ratio of the reflection radiation to the primary one, , and also by the relatively low mass-accretion rate determined from the source luminosity.
Chapter 6 Future perspectives
X-ray spectroscopy is a feasible method to probe the innermost regions of black hole accretion discs in active galactic nuclei and stellar-mass black hole binaries. Especially, it provides a unique way to measure black hole spin which plays an important role in black hole energetic balance and evolution. The existence of powerful relativistic jets is frequently attributed to rapidly rotating black holes where the energy extracted from the black hole rotation generates and maintains the far-reaching collimated ejections of plasma. But is it really so? Is there any correlation between the spin and radio-loudness of galaxies and black hole binaries? What is the statistical distribution of the black hole spin? Is the black hole spin natal or are black holes spun up via accretion? Such questions could be answered if we reliably knew the values of the spin for a sufficiently large number of black holes. Hence, precise measurements of the black hole spin is among the important future tasks of X-ray astronomy.
Black hole angular momentum has been measured since late 1980s (Fabian et al. 1989). At the beginning with a large uncertainty, but following the fast development of X-ray detectors, these measurements have become increasingly precise. The original method dealt with a relativistically broadened iron line. This method is still one of the most suitable methods of the spin measurements. Its advantage is its applicability to black holes at all mass-scales. However, it depends on the accretion regime whether a broad relativistic line may occur in the spectrum or not. The necessary conditions are that the accretion flow is in the “thin-disc” regime (the disc is geometrically thin and optically thick) and not over-ionised ().
The advantage of stellar-mass black hole binaries is that their spectral states evolve on relatively short time-scales so that it is possible to detect them in different states. A relativistically broadened iron line should be common for stellar-mass black hole binaries when observed in the appropriate accretion state (Miller et al. 2009). On the other hand, X-ray spectra of the brightest Galactic black hole binaries, such as Cyg X-1, GRS 1915+105, GX 339-4, etc., suffer significantly from the pile-up when observed with current X-ray satellites. Instruments with a more frequent and faster read-out cycle or with a different detection technology would be more suitable for observations of such bright sources.
For stellar-mass black hole binaries, the spin measurements with a relativistic iron line may be compared to the results obtained by modelling of the disc thermal radiation (Remillard & McClintock 2006). An agreement of the results obtained by both methods will enhance the credibility of the spin measurements. Higher resolution X-ray detectors will allow other methods, such as X-ray reverberation or X-ray polarimetry, to independently measure the spin. These will also be applied for active galaxies.
Many similarities between super-massive black holes in active galaxies and Galactic black holes were reported (see Section 1.4.3). Do they also have a similar distribution in the spin? A statistical study of the presence of relativistically broadened iron lines in spectra of active galactic nuclei (AGN) was performed by Guainazzi, Bianchi & Dovčiak (2006) on the sample of a hundred AGNs observed by the XMM-Newton satellite. They estimated a fraction of of well exposed ( cts) AGNs that exhibit a relativistically broadened iron line. A continuation of this effort is represented by Longinotti et al. (2008) and de la Calle et al. (2009, submitted to A&A). Some other works have been done on different samples of galaxies (Streblyanska et al. 2005; Nandra et al. 2007; Brenneman & Reynolds 2009).
All of these researches have been done on well exposed observations of active galaxies in the local Universe. However, with more sensitive instruments, such as those planned for IXO, the relativistic iron lines will be detectable also in observations of more distant galaxies. Constraints on cosmic density of relativistic lines and its distribution on cosmological length-scales will be available in near future. A pioneering work with the current data appeared recently (Ballantyne 2010).
It is worth-mentioning that, like any other spectroscopic results, the spin measurements with a relativistic iron line are model-dependent. Models employing partial covering absorption represent an alternative explanation of the characteristic spectral curvature around the iron line energy (Miller, Turner & Reeves 2008a). Observations with future X-ray satellites may be helpful to distinguish between the two models thanks to an increased sensitivity in combination with a broader energy range including the Compton hump as well. Self-consistent reflection models are then desirable to model all the reflection components together. If the source is considerably variable then the timing studies may be determinative between the two scenarios. The first reverberation measurement of 1H0707-495 strongly favours the scenario with the relativistic line models (Fabian et al. 2009).
Beyond the current sensitivity of X-ray detectors, further details of accretion physics can be studied. Not only spin will be measured by relativistic line models but also the intrinsic assumptions inside the models will be tested. One of the uncertainties in the relativistic line models is due to the unknown emission directionality. We discussed its effect on the spin value determination for the case of an isotropically illuminated cold accretion disc (see Section 3). This analysis can be enhanced in a future work by adopting different assumptions, e.g. ionised disc, or an illuminating source localised above the black hole. More comprehensive simulations of the irradiated accretion discs taking the general relativistic effects on the radiation transfer into account would be desirable. Detailed knowledge of the model assumptions will be necessary to properly measure the spin.
Currently, the uncertainties in the precise position of the inner edge represent an unknown error of the spin determination. However, it appears that the expected magnitude of these errors does not prevent us from setting interesting and realistic constraints on the spin parameter. Our present treatment of the problem is incomplete by neglecting the magnetohydrodynamical effects and their influence on the ISCO location. Future improvements in our theoretical understanding of the inner edge location are desirable and will help to improve the confidence in the determination of the model parameters.
Higher resolution X-ray detectors will possibly reveal more complex profiles of iron lines modified by a contribution of different non-axial patterns, for instance orbiting hot spots (Dovčiak et al. 2004b) or spiralling waves (Karas, Martocchia & Šubr 2001). Some of the current observations of AGNs already revealed periodic X-ray variability (see e.g. Iwasawa et al. 1998; Turner et al. 2002) or narrow emission lines in the iron line band which may be due to orbiting hot spots (see e.g. Dovčiak et al. 2004b; Piconcelli et al. 2006). The study of non-axial patterns in the iron line profiles is possible using the KY package (Dovčiak, Karas & Yaqoob 2004), and will be promising with sensitive future X-ray missions.
We would like to conclude by expressing our optimism regarding the future of X-ray research of black holes and accretion discs. New technologies that are currently being developed will enhance energy and time resolution of the observations and they will even open new channels of information (such as X-ray polarimetry). In addition, theoretical models and numerical codes are getting more advanced, thus allowing us to make interpretation of the observed data closer to their real meaning.
References
- Abramowicz & Kluźniak (2001) Abramowicz M. A. & Kluźniak W. (2001). A precise determination of black hole spin in GRO J1655-40. A&A, 374, L19–L20.
- Abramowicz et al. (1988) Abramowicz M. A., Czerny B., Lasota J. P. & Szuszkiewicz E. (1988). Slim accretion disks. ApJ, 332, 646–658.
- Abramowicz et al. (1995) Abramowicz M. A., Chen X., Kato S., Lasota J. & Regev O. (1995). Thermal equilibria of accretion disks. ApJ, 438, L37–L39.
- Agol, Blaes & Ionescu-Zanetti (1998) Agol E., Blaes O. & Ionescu-Zanetti C. (1998). Polarization from magnetized accretion discs. II - The effects of absorption opacity on Faraday rotation. MNRAS, 293, 1.
- Ajello et al. (2008) Ajello M., Rau A., Greiner J., Kanbach G., Salvato M., Strong A. W., Barthelmy S. D., Gehrels N., Markwardt C. B. & Tueller J. (2008). The Swift BAT X-Ray Survey. III. X-Ray Spectra and Statistical Properties. ApJ, 673, 96–113.
- Antonucci (1993) Antonucci R. (1993). Unified models for active galactic nuclei and quasars. ARA&A, 31, 473–521.
- Antonucci & Miller (1985) Antonucci R. R. J. & Miller J. S. (1985). Spectropolarimetry and the nature of NGC 1068. ApJ, 297, 621–632.
- Arnaud (1996) Arnaud K. A. (1996). XSPEC: The First Ten Years. In G. H. Jacoby & J. Barnes, editors, Astronomical Data Analysis Software and Systems V, volume 101 of Astronomical Society of the Pacific Conference Series, page 17.
- Arnaud et al. (2009) Arnaud M., Barcons X., Barret D., Bautz M., Bellazzini R., Bleeker J., Böhringer H., Boller T., Brandt W. N., Cappi M., Carrera F., Comastri A., Costa E., Courvoisier T., de Korte P., Dwelly T., Fabian A., Flanagan K., Gilli R., Griffiths R., Hasinger G., Kaastra J., Kahn S., Kelley R., Kunieda H., Makishima K., Matt G., Mendez M., Mitsuda K., Nandra K., Ohashi T., Page M., Palumbo G., Pavlinsky M., Sciortino S., Smith A., Strüder L., Takahashi T., Türler M., Turner M., Ueda Y., Vignali C., Vink J., Warwick R., Watson M., Willingale R. & Zhang S. N. (2009). XEUS: the physics of the hot evolving universe. Experimental Astronomy, 23, 139–168.
- Asaoka (1989) Asaoka I. (1989). X-ray spectra at infinity from a relativistic accretion disk around a Kerr black hole. PASJ, 41, 763–778.
- Awaki et al. (1991) Awaki H., Koyama K., Kunieda H., Takano S., Tawara Y. & Ohashi T. (1991). GINGA observations of three X-ray-luminous early-type galaxies - NGC 4472, NGC 4636, and NGC 3998. ApJ, 366, 88–94.
- Balbus & Hawley (1991) Balbus S. A. & Hawley J. F. (1991). A powerful local shear instability in weakly magnetized disks. I - Linear analysis. II - Nonlinear evolution. ApJ, 376, 214–233.
- Ballantyne (2010) Ballantyne D. R. (2010). The Distribution and Cosmic Density of Relativistic Iron Lines in Active Galactic Nuclei. ApJ, 708, L1–L4.
- Ballantyne, Ross & Fabian (2001) Ballantyne D. R., Ross R. R. & Fabian A. C. (2001). X-ray reflection by photoionized accretion discs. MNRAS, 327, 10–22.
- Ballantyne, Vaughan & Fabian (2003) Ballantyne D. R., Vaughan S. & Fabian A. C. (2003). A two-component ionized reflection model of MCG-6-30-15. MNRAS, 342, 239–248.
- Bambynek et al. (1972) Bambynek W., Crasemann B., Fink R. W., Freund H., Mark H., Swift C. D., Price R. E. & Rao P. V. (1972). X-Ray Fluorescence Yields, Auger, and Coster-Kronig Transition Probabilities. Reviews of Modern Physics, 44, 716–813.
- Bardeen, Press & Teukolsky (1972) Bardeen J. M., Press W. H. & Teukolsky S. A. (1972). Rotating Black Holes: Locally Nonrotating Frames, Energy Extraction, and Scalar Synchrotron Radiation. ApJ, 178, 347–370.
- Barr, White & Page (1985) Barr P., White N. E. & Page C. G. (1985). The discovery of low-level iron K line emission from CYG X-1. MNRAS, 216, 65P–70P.
- Basko (1978) Basko M. M. (1978). K-fluorescence lines in spectra of X-ray binaries. ApJ, 223, 268–281.
- Basko, Sunyaev & Titarchuk (1974) Basko M. M., Sunyaev R. A. & Titarchuk L. G. (1974). Reflection and reprocessing of X-ray source radiation by the atmosphere of the normal star in a binary system. A&A, 31, 249–263.
- Beckwith (2005) Beckwith K. (2005). Observational effects of strong gravity. In S. Hledík & Z. Stuchlík, editors, RAGtime 6/7: Workshops on black holes and neutron stars, pages 29–38. Opava: Silesian University.
- Beckwith & Done (2004) Beckwith K. & Done C. (2004). Iron line profiles in strong gravity. MNRAS, 352, 353–362.
- Beckwith, Hawley & Krolik (2008) Beckwith K., Hawley J. F. & Krolik J. H. (2008). Where is the radiation edge in magnetized black hole accretion discs? MNRAS, 390, 21–38.
- Begelman (1979) Begelman M. C. (1979). Can a spherically accreting black hole radiate very near the Eddington limit. MNRAS, 187, 237–251.
- Beloborodov (2002) Beloborodov A. M. (2002). Gravitational Bending of Light Near Compact Objects. ApJ, 566, L85–L88.
- Bevington (1969) Bevington P. R. (1969). Data reduction and error analysis for the physical sciences.
- Bianchi et al. (2009a) Bianchi S., Guainazzi M., Matt G., Fonseca Bonilla N. & Ponti G. (2009a). CAIXA: a catalogue of AGN in the XMM-Newton archive. I. Spectral analysis. A&A, 495, 421–430.
- Bianchi et al. (2009b) Bianchi S., Piconcelli E., Chiaberge M., Bailón E. J., Matt G. & Fiore F. (2009b). How Complex is the Obscuration in Active Galactic Nuclei? New Clues from the Suzaku Monitoring of the X-Ray Absorbers in NGC 7582. ApJ, 695, 781–787.
- Binney & Tremaine (2008) Binney J. & Tremaine S. (2008). Galactic Dynamics: Second Edition. Princeton University Press.
- Blandford & Znajek (1977) Blandford R. D. & Znajek R. L. (1977). Electromagnetic extraction of energy from Kerr black holes. MNRAS, 179, 433–456.
- Blandford et al. (1990) Blandford R. D., Netzer H., Woltjer L., Courvoisier T. & Mayor M., editors (1990). Active Galactic Nuclei.
- Blissett & Cruise (1979) Blissett R. J. & Cruise A. M. (1979). The restoration of astronomical X-ray spectra. MNRAS, 186, 45–57.
- Blustin et al. (2005) Blustin A. J., Page M. J., Fuerst S. V., Branduardi-Raymont G. & Ashton C. E. (2005). The nature and origin of Seyfert warm absorbers. A&A, 431, 111–125.
- Bolton (1972) Bolton C. T. (1972). Cygnus X-1-Dimensions of the system. Nature, 240, 124.
- Bookbinder (2010) Bookbinder J. (2010). The International X-ray Observatory - RFI#1. ArXiv e-prints.
- Boroson (2003) Boroson T. A. (2003). Does the Narrow [O III] 5007 Line Reflect the Stellar Velocity Dispersion in Active Galactic Nuclei? ApJ, 585, 647–652.
- Brenneman & Reynolds (2006) Brenneman L. W. & Reynolds C. S. (2006). Constraining Black Hole Spin via X-Ray Spectroscopy. ApJ, 652, 1028–1043.
- Brenneman & Reynolds (2009) Brenneman L. W. & Reynolds C. S. (2009). Relativistic Broadening of Iron Emission Lines in a Sample of Active Galactic Nuclei. ApJ, 702, 1367–1386.
- Brightman & Nandra (2008) Brightman M. & Nandra K. (2008). On the nature of unabsorbed Seyfert 2 galaxies. MNRAS, 390, 1241–1249.
- Buxton & Vennes (2003) Buxton M. & Vennes S. (2003). Optical spectroscopy of GX 339-4 - I. Orbital modulation. MNRAS, 342, 105–118.
- Cackett & Miller (2010) Cackett E. & Miller J. M. (2010). Relativistic Lines and Reflection from Neutron Star LMXBs. In Bulletin of the American Astronomical Society, volume 41 of Bulletin of the American Astronomical Society, page 547.
- Čadež & Calvani (2005) Čadež A. & Calvani M. (2005). Relativistic emission lines from accretion discs around black holes. MNRAS, 363, 177–182.
- Camenzind (2007) Camenzind M. (2007). Compact objects in astrophysics : white dwarfs, neutron stars, and black holes.
- Cappi et al. (2006) Cappi M., Panessa F., Bassani L., Dadina M., Dicocco G., Comastri A., della Ceca R., Filippenko A. V., Gianotti F., Ho L. C., Malaguti G., Mulchaey J. S., Palumbo G. G. C., Piconcelli E., Sargent W. L. W., Stephen J., Trifoglio M. & Weaver K. A. (2006). X-ray spectral survey with XMM-Newton of a complete sample of nearby Seyfert galaxies. A&A, 446, 459–470.
- Casares (2007) Casares J. (2007). Observational evidence for stellar-mass black holes. In V. Karas & G. Matt, editor, IAU Symposium, volume 238 of IAU Symposium, pages 3–12.
- Cash (1976) Cash W. (1976). Generation of Confidence Intervals for Model Parameters in X-ray Astronomy. A&A, 52, 307.
- Chandrasekhar (1960) Chandrasekhar S. (1960). Radiative Transfer. New York: Dover.
- Chiang & Blaes (2003) Chiang J. & Blaes O. (2003). Using Multiwavelength Observations to Determine the Black Hole Mass and Accretion Rate in the Type 1 Seyfert Galaxy NGC 5548. ApJ, 586, 97–111.
- Connors, Stark & Piran (1980) Connors P. A., Stark R. F. & Piran T. (1980). Polarization features of X-ray radiation emitted near black holes. ApJ, 235, 224–244.
- Crummy et al. (2006) Crummy J., Fabian A. C., Gallo L. & Ross R. R. (2006). An explanation for the soft X-ray excess in active galactic nuclei. MNRAS, 365, 1067–1081.
- Cunningham (1975) Cunningham C. T. (1975). The effects of redshifts and focusing on the spectrum of an accretion disk around a Kerr black hole. ApJ, 202, 788–802.
- Czerny & Goosmann (2004) Czerny B. & Goosmann R. (2004). Flare-induced fountains and buried flares in AGN. A&A, 428, 353–363.
- Czerny & Nikolajuk (2009) Czerny B. & Nikolajuk M. (2009). Mass of black holes: The State of the Art. ArXiv e-prints.
- Czerny et al. (2004) Czerny B., Różańska A., Dovčiak M., Karas V. & Dumont A.-M. (2004). The structure and radiation spectra of illuminated accretion disks in AGN. II. Flare/spot model of X-ray variability. A&A, 420, 1–16.
- Davis et al. (2005) Davis S. W., Blaes O. M., Hubeny I. & Turner N. J. (2005). Relativistic Accretion Disk Models of High-State Black Hole X-Ray Binary Spectra. ApJ, 621, 372–387.
- de Marco et al. (2009) de Marco B., Iwasawa K., Cappi M., Dadina M., Tombesi F., Ponti G., Celotti A. & Miniutti G. (2009). Probing variability patterns of the Fe K line complex in bright nearby AGNs. A&A, 507, 159–169.
- den Herder et al. (2001) den Herder J. W., Brinkman A. C., Kahn S. M., Branduardi-Raymont G., Thomsen K., Aarts H., Audard M., Bixler J. V., den Boggende A. J., Cottam J., Decker T., Dubbeldam L., Erd C., Goulooze H., Güdel M., Guttridge P., Hailey C. J., Janabi K. A., Kaastra J. S., de Korte P. A. J., van Leeuwen B. J., Mauche C., McCalden A. J., Mewe R., Naber A., Paerels F. B., Peterson J. R., Rasmussen A. P., Rees K., Sakelliou I., Sako M., Spodek J., Stern M., Tamura T., Tandy J., de Vries C. P., Welch S. & Zehnder A. (2001). The Reflection Grating Spectrometer on board XMM-Newton. A&A, 365, L7–L17.
- Díaz Trigo et al. (2007) Díaz Trigo M., Parmar A. N., Miller J., Kuulkers E. & Caballero-García M. D. (2007). XMM-Newton and INTEGRAL spectroscopy of the microquasar GRO J1655-40 during its 2005 outburst. A&A, 462, 657–666.
- Done & Diaz Trigo (2009) Done C. & Diaz Trigo M. (2009). A re–analysis of the iron line in the XMM-Newton data from the low/hard state in GX339–4. ArXiv e-prints.
- Done, Madejski & Życki (2000) Done C., Madejski G. M. & Życki P. T. (2000). The Relativistic Iron Line Profile in the Seyfert 1 Galaxy IC 4329A. ApJ, 536, 213–224.
- Dove et al. (1997) Dove J. B., Wilms J., Maisack M. & Begelman M. C. (1997). Self-Consistent Thermal Accretion Disk Corona Models for Compact Objects. ApJ, 487, 759.
- Dovčiak, Karas & Yaqoob (2004) Dovčiak M., Karas V. & Yaqoob T. (2004). An Extended Scheme for Fitting X-Ray Data with Accretion Disk Spectra in the Strong Gravity Regime. ApJS, 153, 205–221.
- Dovčiak et al. (2004a) Dovčiak M., Karas V., Martocchia A., Matt G. & Yaqoob T. (2004a). An XSPEC model to explore spectral features from black-hole sources. In S. Hledík & Z. Stuchlík, editors, RAGtime 4/5: Workshops on black holes and neutron stars, pages 33–73. Opava: Silesian University.
- Dovčiak et al. (2004b) Dovčiak M., Bianchi S., Guainazzi M., Karas V. & Matt G. (2004b). Relativistic spectral features from X-ray-illuminated spots and the measure of the black hole mass in active galactic nuclei. MNRAS, 350, 745–755.
- Dovčiak et al. (2008) Dovčiak M., Muleri F., Goosmann R. W., Karas V. & Matt G. (2008). Thermal disc emission from a rotating black hole: X-ray polarization signatures. MNRAS, 391, 32–38.
- Dovčiak (2004) Dovčiak M. (2004). Radiation of Accretion Discs in Strong Gravity. PhD Thesis (Prague: Charles University), arXiv: astro-ph/0411605.
- Dumont, Abrassart & Collin (2000) Dumont A.-M., Abrassart A. & Collin S. (2000). A code for optically thick and hot photoionized media. A&A, 357, 823–838.
- Eckart & Genzel (1996) Eckart A. & Genzel R. (1996). Observations of stellar proper motions near the Galactic Centre. Nature, 383, 415–417.
- Einstein (1916) Einstein A. (1916). Die Grundlage der allgemeinen Relativitätstheorie. Annalen der Physik, 354, 769–822.
- Elvis (2000) Elvis M. (2000). A Structure for Quasars. ApJ, 545, 63–76.
- Elvis, Risaliti & Zamorani (2002) Elvis M., Risaliti G. & Zamorani G. (2002). Most Supermassive Black Holes Must Be Rapidly Rotating. ApJ, 565, L75–L77.
- Esin, McClintock & Narayan (1997) Esin A. A., McClintock J. E. & Narayan R. (1997). Advection-dominated Accretion and the Spectral States of Black Hole X-Ray Binaries: Application to Nova MUSCAE 1991. ApJ, 489, 865.
- Fabian & Vaughan (2003) Fabian A. C. & Vaughan S. (2003). The iron line in MCG-6-30-15 from XMM-Newton: evidence for gravitational light bending? MNRAS, 340, L28–L32.
- Fabian et al. (1989) Fabian A. C., Rees M. J., Stella L. & White N. E. (1989). X-ray fluorescence from the inner disc in Cygnus X-1. MNRAS, 238, 729–736.
- Fabian et al. (2002) Fabian A. C., Vaughan S., Nandra K., Iwasawa K., Ballantyne D. R., Lee J. C., De Rosa A., Turner A. & Young A. J. (2002). A long hard look at MCG-6-30-15 with XMM-Newton. MNRAS, 335, L1–L5.
- Fabian et al. (2009) Fabian A. C., Zoghbi A., Ross R. R., Uttley P., Gallo L. C., Brandt W. N., Blustin A. J., Boller T., Caballero-Garcia M. D., Larsson J., Miller J. M., Miniutti G., Ponti G., Reis R. C., Reynolds C. S., Tanaka Y. & Young A. J. (2009). Broad line emission from iron K- and L-shell transitions in the active galaxy 1H0707-495. Nature, 459, 540–542.
- Ferrarese & Merritt (2000) Ferrarese L. & Merritt D. (2000). A Fundamental Relation between Supermassive Black Holes and Their Host Galaxies. ApJ, 539, L9–L12.
- Fuerst & Wu (2004) Fuerst S. V. & Wu K. (2004). Radiation transfer of emission lines in curved space-time. A&A, 424, 733–746.
- Fukue & Akizuki (2006) Fukue J. & Akizuki C. (2006). Relativistic Radiative Flow in a Luminous Disk II. PASJ, 58, 1073–1079.
- Gabriel et al. (2004) Gabriel C., Denby M., Fyfe D. J., Hoar J., Ibarra A., Ojero E., Osborne J., Saxton R. D., Lammers U. & Vacanti G. (2004). The XMM-Newton SAS - Distributed Development and Maintenance of a Large Science Analysis System: A Critical Analysis. In F. Ochsenbein, M. G. Allen, & D. Egret, editor, Astronomical Data Analysis Software and Systems (ADASS) XIII, volume 314 of Astronomical Society of the Pacific Conference Series, page 759.
- Galeev, Rosner & Vaiana (1979) Galeev A. A., Rosner R. & Vaiana G. S. (1979). Structured coronae of accretion disks. ApJ, 229, 318–326.
- Gallo et al. (2004) Gallo E., Corbel S., Fender R. P., Maccarone T. J. & Tzioumis A. K. (2004). A transient large-scale relativistic radio jet from GX 339-4. MNRAS, 347, L52–L56.
- Gebhardt et al. (2000) Gebhardt K., Bender R., Bower G., Dressler A., Faber S. M., Filippenko A. V., Green R., Grillmair C., Ho L. C., Kormendy J., Lauer T. R., Magorrian J., Pinkney J., Richstone D. & Tremaine S. (2000). A Relationship between Nuclear Black Hole Mass and Galaxy Velocity Dispersion. ApJ, 539, L13–L16.
- Genzel et al. (2003) Genzel R., Schödel R., Ott T., Eckart A., Alexander T., Lacombe F., Rouan D. & Aschenbach B. (2003). Near-infrared flares from accreting gas around the supermassive black hole at the Galactic Centre. Nature, 425, 934–937.
- George & Fabian (1991) George I. M. & Fabian A. C. (1991). X-ray reflection from cold matter in active galactic nuclei and X-ray binaries. MNRAS, 249, 352–367.
- Ghez et al. (1998) Ghez A. M., Klein B. L., Morris M. & Becklin E. E. (1998). High Proper-Motion Stars in the Vicinity of Sagittarius A*: Evidence for a Supermassive Black Hole at the Center of Our Galaxy. ApJ, 509, 678–686.
- Ghez et al. (2005) Ghez A. M., Salim S., Hornstein S. D., Tanner A., Lu J. R., Morris M., Becklin E. E. & Duchêne G. (2005). Stellar Orbits around the Galactic Center Black Hole. ApJ, 620, 744–757.
- Ghisellini, Haardt & Matt (1994) Ghisellini G., Haardt F. & Matt G. (1994). The Contribution of the Obscuring Torus to the X-Ray Spectrum of Seyfert Galaxies - a Test for the Unification Model. MNRAS, 267, 743.
- Gierliński & Done (2006) Gierliński M. & Done C. (2006). Energy-dependent variability and the origin of the soft X-ray excess in active galactic nuclei. MNRAS, 371, L16–L20.
- Gierliński et al. (2008) Gierliński M., Middleton M., Ward M. & Done C. (2008). A periodicity of ~1hour in X-ray emission from the active galaxy RE J1034+396. Nature, 455, 369–371.
- Gillessen et al. (2009) Gillessen S., Eisenhauer F., Trippe S., Alexander T., Genzel R., Martins F. & Ott T. (2009). Monitoring Stellar Orbits Around the Massive Black Hole in the Galactic Center. ApJ, 692, 1075–1109.
- Goosmann et al. (2007) Goosmann R. W., Mouchet M., Czerny B., Dovčiak M., Karas V., Róžańska A. & Dumont A.-M. (2007). Iron lines from transient and persisting hot spots on AGN accretion disks. A&A, 475, 155–168.
- Greenhill et al. (2002) Greenhill L. J., Ellingsen S. P., Norris R. P., McGregor P. J., Gough R. G., Sinclair M. W., Rayner D. P., Phillips C. J., Herrnstein J. R. & Moran J. M. (2002). A Search for H2O Maser Emission in Southern Active Galactic Nuclei and Star-forming Galaxies: Discovery of a Maser in the Edge-on Galaxy IRAS F01063-8034. ApJ, 565, 836–848.
- Guainazzi (2003) Guainazzi M. (2003). The history of the iron Kα line profile in the Piccinotti AGN ESO 198-G24. A&A, 401, 903–910.
- Guainazzi (2009) Guainazzi M. (2009). General Relativity studies through X-ray spectroscopy of the Fe (and others) Kα fluorescent lines. Ap&SS, 320, 129–134.
- Guainazzi et al. (1999) Guainazzi M., Matt G., Molendi S., Orr A., Fiore F., Grandi P., Matteuzzi A., Mineo T., Perola G. C., Parmar A. N. & Piro L. (1999). BeppoSAX confirms extreme relativistic effects in the X-ray spectrum of MCG-6-30-15. A&A, 341, L27–L30.
- Guainazzi, Bianchi & Dovčiak (2006) Guainazzi M., Bianchi S. & Dovčiak M. (2006). Statistics of relativistically broadened Fe K lines in AGN. Astronomische Nachrichten, 327, 1032.
- Guilbert & Rees (1988) Guilbert P. W. & Rees M. J. (1988). ’Cold’ material in non-thermal sources. MNRAS, 233, 475–484.
- Haardt (1993) Haardt F. (1993). Anisotropic Comptonization in thermal plasmas - Spectral distribution in plane-parallel geometry. ApJ, 413, 680–693.
- Haardt & Maraschi (1991) Haardt F. & Maraschi L. (1991). A two-phase model for the X-ray emission from Seyfert galaxies. ApJ, 380, L51–L54.
- Haardt, Maraschi & Ghisellini (1994) Haardt F., Maraschi L. & Ghisellini G. (1994). A model for the X-ray and ultraviolet emission from Seyfert galaxies and galactic black holes. ApJ, 432, L95–L99.
- Hiemstra et al. (2009) Hiemstra B., Soleri P., Méndez M., Belloni T., Mostafa R. & Wijnands R. (2009). Discovery of a broad iron line in the black hole candidate Swift J1753.5-0127, and the disc emission in the low/hard state revisited. MNRAS, 394, 2080–2088.
- Horák & Karas (2006) Horák J. & Karas V. (2006). Twin-peak quasiperiodic oscillations as an internal resonance. A&A, 451, 377–386.
- Houck & Denicola (2000) Houck J. C. & Denicola L. A. (2000). ISIS: An Interactive Spectral Interpretation System for High Resolution X-Ray Spectroscopy. In N. Manset, C. Veillet, & D. Crabtree, editor, Astronomical Data Analysis Software and Systems IX, volume 216 of Astronomical Society of the Pacific Conference Series, page 591.
- Hynes et al. (2003) Hynes R. I., Steeghs D., Casares J., Charles P. A. & O’Brien K. (2003). Dynamical Evidence for a Black Hole in GX 339-4. ApJ, 583, L95–L98.
- Ichimaru (1977) Ichimaru S. (1977). Bimodal behavior of accretion disks - Theory and application to Cygnus X-1 transitions. ApJ, 214, 840–855.
- Iwasawa et al. (1996) Iwasawa K., Fabian A. C., Reynolds C. S., Nandra K., Otani C., Inoue H., Hayashida K., Brandt W. N., Dotani T., Kunieda H., Matsuoka M. & Tanaka Y. (1996). The variable iron K emission line in MCG-6-30-15. MNRAS, 282, 1038–1048.
- Iwasawa et al. (1998) Iwasawa K., Fabian A. C., Brandt W. N., Kunieda H., Misaki K., Terashima Y. & Reynolds C. S. (1998). Detection of an X-ray periodicity in the Seyfert galaxy IRAS 18325-5926. MNRAS, 295, L20–L24.
- Iwasawa et al. (1999) Iwasawa K., Fabian A. C., Young A. J., Inoue H. & Matsumoto C. (1999). Variation of the broad X-ray iron line in MCG-6-30-15 during a flare. MNRAS, 306, L19–L24.
- Jansen et al. (2001) Jansen F., Lumb D., Altieri B., Clavel J., Ehle M., Erd C., Gabriel C., Guainazzi M., Gondoin P., Much R., Munoz R., Santos M., Schartel N., Texier D. & Vacanti G. (2001). XMM-Newton observatory. I. The spacecraft and operations. A&A, 365, L1–L6.
- Kaaret et al. (2001) Kaaret P., Prestwich A. H., Zezas A., Murray S. S., Kim D., Kilgard R. E., Schlegel E. M. & Ward M. J. (2001). Chandra High-Resolution Camera observations of the luminous X-ray source in the starburst galaxy M82. MNRAS, 321, L29–L32.
- Kaastra, Mewe & Nieuwenhuijzen (1996) Kaastra J. S., Mewe R. & Nieuwenhuijzen H. (1996). SPEX: a new code for spectral analysis of X & UV spectra. In K. Yamashita & T. Watanabe, editors, UV and X-ray Spectroscopy of Astrophysical and Laboratory Plasmas, pages 411–414.
- Kalberla et al. (2005) Kalberla P. M. W., Burton W. B., Hartmann D., Arnal E. M., Bajaja E., Morras R. & Pöppel W. G. L. (2005). The Leiden/Argentine/Bonn (LAB) Survey of Galactic HI. Final data release of the combined LDS and IAR surveys with improved stray-radiation corrections. A&A, 440, 775–782.
- Kallman & Bautista (2001) Kallman T. & Bautista M. (2001). Photoionization and High-Density Gas. ApJS, 133, 221–253.
- Karas (2006) Karas V. (2006). Theoretical aspects of relativistic spectral features. Astronomische Nachrichten, 327, 961–968.
- Karas, Vokrouhlický & Polnarev (1992) Karas V., Vokrouhlický D. & Polnarev A. G. (1992). In the vicinity of a rotating black hole - A fast numerical code for computing observational effects. MNRAS, 259, 569–575.
- Karas, Martocchia & Šubr (2001) Karas V., Martocchia A. & Šubr L. (2001). Variable Line Profiles Due to Non-Axisymmetric Patterns in an Accretion Disc around a Rotating Black Hole. PASJ, 53, 189–199.
- Kerr (1963) Kerr R. P. (1963). Gravitational Field of a Spinning Mass as an Example of Algebraically Special Metrics. Physical Review Letters, 11, 237–238.
- King (2004) King A. R. (2004). Ultraluminous X-ray sources and star formation. MNRAS, 347, L18–L20.
- King & Kolb (1999) King A. R. & Kolb U. (1999). The evolution of black hole mass and angular momentum. MNRAS, 305, 654–660.
- Kojima (1991) Kojima Y. (1991). The effects of black hole rotation on line profiles from accretion discs. MNRAS, 250, 629–632.
- Kormendy & Richstone (1995) Kormendy J. & Richstone D. (1995). Inward Bound—The Search For Supermassive Black Holes In Galactic Nuclei. ARA&A, 33, 581.
- Krongold et al. (2007) Krongold Y., Nicastro F., Elvis M., Brickhouse N., Binette L., Mathur S. & Jiménez-Bailón E. (2007). The Compact, Conical, Accretion-Disk Warm Absorber of the Seyfert 1 Galaxy NGC 4051 and Its Implications for IGM-Galaxy Feedback Processes. ApJ, 659, 1022–1039.
- Lamastra, Perola & Matt (2006) Lamastra A., Perola G. C. & Matt G. (2006). A model for the X-ray absorption in Compton-thin AGN. A&A, 449, 551–558.
- Landau & Lifshitz (1959) Landau L. D. & Lifshitz E. M. (1959). Fluid mechanics.
- Laor (1991) Laor A. (1991). Line profiles from a disk around a rotating black hole. ApJ, 376, 90–94.
- Laplace (1799) Laplace P. S. (1799). Beweis des Satzes, dass die anziehende Kraft bey einem Weltkörper so gross seyn könne, dass das Licht davon nicht ausströmen kann. Allgemeine Geographische Ephemeriden (Weimar), 4(1). English translation in Stephani (2003).
- Lasota et al. (1996) Lasota J., Abramowicz M. A., Chen X., Krolik J., Narayan R. & Yi I. (1996). Is the Accretion Flow in NGC 4258 Advection Dominated? ApJ, 462, 142.
- Lee et al. (2002) Lee J. C., Iwasawa K., Houck J. C., Fabian A. C., Marshall H. L. & Canizares C. R. (2002). The Shape of the Relativistic Iron K Line from MCG -6-30-15 Measured with the Chandra High Energy Transmission Grating Spectrometer and the Rossi X-Ray Timing Explorer. ApJ, 570, L47–L50.
- Li et al. (2005) Li L., Zimmerman E. R., Narayan R. & McClintock J. E. (2005). Multitemperature Blackbody Spectrum of a Thin Accretion Disk around a Kerr Black Hole: Model Computations and Comparison with Observations. ApJS, 157, 335–370.
- Lightman & Shapiro (1975) Lightman A. P. & Shapiro S. L. (1975). Spectrum and polarization of X-rays from accretion disks around black holes. ApJ, 198, L73–L75.
- Lightman & White (1988) Lightman A. P. & White T. R. (1988). Effects of cold matter in active galactic nuclei - A broad hump in the X-ray spectra. ApJ, 335, 57–66.
- Liu & Taam (2009) Liu B. F. & Taam R. E. (2009). Application of the Disk Evaporation Model to Active Galactic Nuclei. ApJ, 707, 233–242.
- Longinotti et al. (2008) Longinotti A. L., de La Calle I., Bianchi S., Guainazzi M. & Dovčiak M. (2008). FERO (Finding Extreme Relativistic Objects): statistics of relativistic broad Fe Kalpha lines in AGN. Memorie della Societa Astronomica Italiana, 79, 259.
- Lu & Wang (2000) Lu Y. & Wang T. (2000). Possible Evidence for a Truncated Thin Disk in Seyfert 1 Galaxy NGC 4593. ApJ, 537, L103–L106.
- Magorrian et al. (1998) Magorrian J., Tremaine S., Richstone D., Bender R., Bower G., Dressler A., Faber S. M., Gebhardt K., Green R., Grillmair C., Kormendy J. & Lauer T. (1998). The Demography of Massive Dark Objects in Galaxy Centers. AJ, 115, 2285–2305.
- Marconi et al. (2004) Marconi A., Risaliti G., Gilli R., Hunt L. K., Maiolino R. & Salvati M. (2004). Local supermassive black holes, relics of active galactic nuclei and the X-ray background. MNRAS, 351, 169–185.
- Markowitz et al. (2008) Markowitz A., Reeves J. N., Miniutti G., Serlemitsos P., Kunieda H., Yaqoob T., Fabian A. C., Fukazawa Y., Mushotzky R., Okajima T., Gallo L. C., Awaki H. & Griffiths R. E. (2008). The Suzaku Observation of NGC3516: Complex Absorption and the Broad and Narrow FeK Lines. PASJ, 60, 277.
- Markowitz et al. (2009) Markowitz A., Reeves J. N., George I. M., Braito V., Smith R., Vaughan S., Arévalo P. & Tombesi F. (2009). A Comprehensive X-Ray Spectral Analysis of the Seyfert 1.5 NGC 3227. ApJ, 691, 922–945.
- Markowitz & Reeves (2009) Markowitz A. G. & Reeves J. N. (2009). A Suzaku Observation of NGC 4593: Illuminating the Truncated Disk. ApJ, 705, 496–508.
- Martocchia, Karas & Matt (2000) Martocchia A., Karas V. & Matt G. (2000). Effects of Kerr space-time on spectral features from X-ray illuminated accretion discs. MNRAS, 312, 817–826.
- Martocchia, Matt & Karas (2002) Martocchia A., Matt G. & Karas V. (2002). On the origin of the broad, relativistic iron line of MCG-6-30-15 observed by XMM-Newton. A&A, 383, L23–L26.
- Mason et al. (2001) Mason K. O., Breeveld A., Much R., Carter M., Cordova F. A., Cropper M. S., Fordham J., Huckle H., Ho C., Kawakami H., Kennea J., Kennedy T., Mittaz J., Pandel D., Priedhorsky W. C., Sasseen T., Shirey R., Smith P. & Vreux J. (2001). The XMM-Newton optical/UV monitor telescope. A&A, 365, L36–L44.
- Matt, Perola & Piro (1991) Matt G., Perola G. C. & Piro L. (1991). The iron line and high energy bump as X-ray signatures of cold matter in Seyfert 1 galaxies. A&A, 247, 25–34.
- Matt et al. (1992) Matt G., Perola G. C., Piro L. & Stella L. (1992). Iron K-alpha line from X-ray illuminated relativistic disks. A&A, 257, 63–68.
- Matt, Fabian & Ross (1993) Matt G., Fabian A. C. & Ross R. R. (1993). Iron K-alpha lines from X-ray photoionized accretion discs. MNRAS, 262, 179–186.
- Matt et al. (2005) Matt G., Porquet D., Bianchi S., Falocco S., Maiolino R., Reeves J. N. & Zappacosta L. (2005). A changing inner radius in the accretion disc of Q0056-363? A&A, 435, 857–861.
- McHardy et al. (2006) McHardy I. M., Koerding E., Knigge C., Uttley P. & Fender R. P. (2006). Active galactic nuclei as scaled-up Galactic black holes. Nature, 444, 730–732.
- Meyer, Liu & Meyer-Hofmeister (2000) Meyer F., Liu B. F. & Meyer-Hofmeister E. (2000). Evaporation: The change from accretion via a thin disk to a coronal flow. A&A, 361, 175–188.
- Michell (1784) Michell J. (1784). On the means of discovering the distance, magnitude, etc. of the fixed stars, in consequence of the Diminution of the Velocity of their Light, in case such a Diminution should be found to take place in any of them, and such other Data should be procured from Observations, as would be farther necessary for that Purpose. Philosophical Transactions of the Royal Society of London, 74, 35.
- Mihalas (1978) Mihalas D. (1978). Stellar Atmospheres. San Francisco: W. H. Freeman and Co.
- Miller (2007) Miller J. M. (2007). Relativistic X-Ray Lines from the Inner Accretion Disks Around Black Holes. ARA&A, 45, 441–479.
- Miller et al. (2004) Miller J. M., Fabian A. C., Reynolds C. S., Nowak M. A., Homan J., Freyberg M. J., Ehle M., Belloni T., Wijnands R., van der Klis M., Charles P. A. & Lewin W. H. G. (2004). Evidence of Black Hole Spin in GX 339-4: XMM-Newton/EPIC-pn and RXTE Spectroscopy of the Very High State. ApJ, 606, L131–L134.
- Miller et al. (2006) Miller J. M., Homan J., Steeghs D., Rupen M., Hunstead R. W., Wijnands R., Charles P. A. & Fabian A. C. (2006). A Long, Hard Look at the Low/Hard State in Accreting Black Holes. ApJ, 653, 525–535.
- Miller et al. (2008) Miller J. M., Reynolds C. S., Fabian A. C., Cackett E. M., Miniutti G., Raymond J., Steeghs D., Reis R. & Homan J. (2008). Initial Measurements of Black Hole Spin in GX 339-4 from Suzaku Spectroscopy. ApJ, 679, L113–L116.
- Miller et al. (2009) Miller J. M., Reynolds C. S., Fabian A. C., Miniutti G. & Gallo L. C. (2009). Stellar-Mass Black Hole Spin Constraints from Disk Reflection and Continuum Modeling. ApJ, 697, 900–912.
- Miller, Turner & Reeves (2008a) Miller L., Turner T. J. & Reeves J. N. (2008a). An absorption origin for the X-ray spectral variability of MCG-6-30-15. A&A, 483, 437–452.
- Miller, Turner & Reeves (2008b) Miller L., Turner T. J. & Reeves J. N. (2008b). An absorption origin for the X-ray spectral variability of MCG-6-30-15. A&A, 483, 437–452.
- Miller & Colbert (2004) Miller M. C. & Colbert E. J. M. (2004). Intermediate-Mass Black Holes. International Journal of Modern Physics D, 13, 1–64.
- Miller & Hamilton (2002) Miller M. C. & Hamilton D. P. (2002). Production of intermediate-mass black holes in globular clusters. MNRAS, 330, 232–240.
- Miniutti & Fabian (2004) Miniutti G. & Fabian A. C. (2004). A light bending model for the X-ray temporal and spectral properties of accreting black holes. MNRAS, 349, 1435–1448.
- Miniutti et al. (2007) Miniutti G., Fabian A. C., Anabuki N., Crummy J., Fukazawa Y., Gallo L., Haba Y., Hayashida K., Holt S., Kunieda H., Larsson J., Markowitz A., Matsumoto C., Ohno M., Reeves J. N., Takahashi T., Tanaka Y., Terashima Y., Torii K., Ueda Y., Ushio M., Watanabe S., Yamauchi M. & Yaqoob T. (2007). Suzaku Observations of the Hard X-Ray Variability of MCG -6-30-15: the Effects of Strong Gravity around a Kerr Black Hole. PASJ, 59, 315–325.
- Mirabel (2006) Mirabel F. (2006). Microquasars. In E. J. A. Meurs & G. Fabbiano, editor, Populations of High Energy Sources in Galaxies, volume 230 of IAU Symposium, pages 85–85.
- Mirabel & Rodríguez (1998) Mirabel I. F. & Rodríguez L. F. (1998). Microquasars in our Galaxy. Nature, 392, 673–676.
- Misner, Thorne & Wheeler (1973) Misner C. W., Thorne K. S. & Wheeler J. A. (1973). Gravitation. San Francisco: W. H. Freeman and Co.
- Mitsuda et al. (1984) Mitsuda K., Inoue H., Koyama K., Makishima K., Matsuoka M., Ogawara Y., Suzuki K., Tanaka Y., Shibazaki N. & Hirano T. (1984). Energy spectra of low-mass binary X-ray sources observed from TENMA. PASJ, 36, 741–759.
- Miyakawa et al. (2009) Miyakawa T., Ebisawa K., Terashima Y., Tsuchihashi F., Inoue H. & Zycki P. (2009). Spectral Variation of the Seyfert 1 Galaxy MCG–6-30-15 Observed with Suzaku. PASJ, 61, 1355–.
- Miyoshi et al. (1995) Miyoshi M., Moran J., Herrnstein J., Greenhill L., Nakai N., Diamond P. & Inoue M. (1995). Evidence for a black hole from high rotation velocities in a sub-parsec region of NGC4258. Nature, 373, 127–129.
- Morrison & McCammon (1983) Morrison R. & McCammon D. (1983). Interstellar photoelectric absorption cross sections, 0.03-10 keV. ApJ, 270, 119–122.
- Nandra et al. (1997) Nandra K., George I. M., Mushotzky R. F., Turner T. J. & Yaqoob T. (1997). ASCA Observations of Seyfert 1 Galaxies. II. Relativistic Iron K alpha Emission. ApJ, 477, 602.
- Nandra et al. (2007) Nandra K., O’Neill P. M., George I. M. & Reeves J. N. (2007). An XMM-Newton survey of broad iron lines in Seyfert galaxies. MNRAS, 382, 194–228.
- Narayan & McClintock (2008) Narayan R. & McClintock J. E. (2008). Advection-dominated accretion and the black hole event horizon. New Astronomy Review, 51, 733–751.
- Narayan & Yi (1994) Narayan R. & Yi I. (1994). Advection-dominated accretion: A self-similar solution. ApJ, 428, L13–L16.
- Narayan, Yi & Mahadevan (1995) Narayan R., Yi I. & Mahadevan R. (1995). Explaining the spectrum of Sagittarius A∗ with a model of an accreting black hole. Nature, 374, 623–625.
- Nayakshin (2000) Nayakshin S. (2000). Magnetic Flare Origin of X-Rays in Active Galactic Nuclei: Photoionization Evidence. ApJ, 540, L37–L40.
- Nelson (2000) Nelson C. H. (2000). Black Hole Mass, Velocity Dispersion, and the Radio Source in Active Galactic Nuclei. ApJ, 544, L91–L94.
- Netzer et al. (2003) Netzer H., Kaspi S., Behar E., Brandt W. N., Chelouche D., George I. M., Crenshaw D. M., Gabel J. R., Hamann F. W., Kraemer S. B., Kriss G. A., Nandra K., Peterson B. M., Shields J. C. & Turner T. J. (2003). The Ionized Gas and Nuclear Environment in NGC 3783. IV. Variability and Modeling of the 900 Kilosecond Chandra Spectrum. ApJ, 599, 933–948.
- Niedźwiecki & Życki (2008) Niedźwiecki A. & Życki P. T. (2008). On the variability and spectral distortion of fluorescent iron lines from black hole accretion discs. MNRAS, 386, 759–780.
- Novikov & Thorne (1973) Novikov I. D. & Thorne K. S. (1973). Astrophysics of black holes. In Black Holes (Les Astres Occlus), pages 343–450.
- Osterbrock (1989) Osterbrock D. E. (1989). Astrophysics of gaseous nebulae and active galactic nuclei.
- Pecháček et al. (2005) Pecháček T., Dovčiak M., Karas V. & Matt G. (2005). The relativistic shift of narrow spectral features from black-hole accretion discs. A&A, 441, 855–861.
- Penrose (1969) Penrose R. (1969). Gravitational Collapse: the Role of General Relativity. Nuovo Cimento Rivista Serie, 1, 252.
- Piconcelli et al. (2006) Piconcelli E., Sánchez-Portal M., Guainazzi M., Martocchia A., Motch C., Schröder A. C., Bianchi S., Jiménez-Bailón E. & Matt G. (2006). 4U 1344-60: a bright intermediate Seyfert galaxy at z = 0.012 with a relativistic Fe K emission line. A&A, 453, 839–846.
- Ponti et al. (2006) Ponti G., Miniutti G., Cappi M., Maraschi L., Fabian A. C. & Iwasawa K. (2006). XMM-Newton study of the complex and variable spectrum of NGC 4051. MNRAS, 368, 903–916.
- Press (2002) Press W. H. (2002). Numerical recipes in C++ : the art of scientific computing.
- Quataert et al. (1999) Quataert E., Di Matteo T., Narayan R. & Ho L. C. (1999). Possible Evidence for Truncated Thin Disks in the Low-Luminosity Active Galactic Nuclei M81 and NGC 4579. ApJ, 525, L89–L92.
- Rees (1984) Rees M. J. (1984). Black Hole Models for Active Galactic Nuclei. ARA&A, 22, 471–506.
- Reeves et al. (2006) Reeves J. N., Fabian A. C., Kataoka J., Kunieda H., Markowitz A., Miniutti G., Okajima T., Serlemitsos P., Takahashi T., Terashima Y. & Yaqoob T. (2006). Suzaku observations of iron lines and reflection in AGN. Astronomische Nachrichten, 327, 1079.
- Reis et al. (2008) Reis R. C., Fabian A. C., Ross R. R., Miniutti G., Miller J. M. & Reynolds C. (2008). A systematic look at the very high and low/hard state of GX339-4: constraining the black hole spin with a new reflection model. MNRAS, 387, 1489–1498.
- Remillard & McClintock (2006) Remillard R. A. & McClintock J. E. (2006). X-Ray Properties of Black-Hole Binaries. ARA&A, 44, 49–92.
- Revnivtsev et al. (2004) Revnivtsev M., Sazonov S., Jahoda K. & Gilfanov M. (2004). RXTE all-sky slew survey. Catalog of X-ray sources at . A&A, 418, 927–936.
- Reynolds (1997) Reynolds C. S. (1997). An X-ray spectral study of 24 type 1 active galactic nuclei. MNRAS, 286, 513–537.
- Reynolds & Fabian (2008) Reynolds C. S. & Fabian A. C. (2008). Broad Iron-K Emission Lines as a Diagnostic of Black Hole Spin. ApJ, 675, 1048–1056.
- Reynolds & Nowak (2003) Reynolds C. S. & Nowak M. A. (2003). Fluorescent iron lines as a probe of astrophysical black hole systems. Phys. Rep., 377, 389–466.
- Reynolds, Nowak & Maloney (2000) Reynolds C. S., Nowak M. A. & Maloney P. R. (2000). A Deep X-Ray Observation of NGC 4258 and Its Surrounding Field. ApJ, 540, 143–153.
- Reynolds et al. (2004) Reynolds C. S., Brenneman L. W., Wilms J. & Kaiser M. E. (2004). Iron line spectroscopy of NGC 4593 with XMM-Newton: where is the black hole accretion disc? MNRAS, 352, 205–210.
- Rezzolla et al. (2003) Rezzolla L., Yoshida S., Maccarone T. J. & Zanotti O. (2003). A new simple model for high-frequency quasi-periodic oscillations in black hole candidates. MNRAS, 344, L37–L41.
- Risaliti, Elvis & Nicastro (2002) Risaliti G., Elvis M. & Nicastro F. (2002). Ubiquitous Variability of X-Ray-absorbing Column Densities in Seyfert 2 Galaxies. ApJ, 571, 234–246.
- Ross & Fabian (1993) Ross R. R. & Fabian A. C. (1993). The effects of photoionization on X-ray reflection spectra in active galactic nuclei. MNRAS, 261, 74–82.
- Ross & Fabian (2005) Ross R. R. & Fabian A. C. (2005). A comprehensive range of X-ray ionized-reflection models. MNRAS, 358, 211–216.
- Ross, Fabian & Young (1999) Ross R. R., Fabian A. C. & Young A. J. (1999). X-ray reflection spectra from ionized slabs. MNRAS, 306, 461–466.
- Różańska & Madej (2008) Różańska A. & Madej J. (2008). Models of the iron K fluorescent line and the Compton Shoulder in irradiated accretion disc spectra. MNRAS, 386, 1872–1880.
- Różańska et al. (2002) Różańska A., Dumont A.-M., Czerny B. & Collin S. (2002). The structure and radiation spectra of illuminated accretion discs in active galactic nuclei - I. Moderate illumination. MNRAS, 332, 799–813.
- Sazonov et al. (2007) Sazonov S., Revnivtsev M., Krivonos R., Churazov E. & Sunyaev R. (2007). Hard X-ray luminosity function and absorption distribution of nearby AGN: INTEGRAL all-sky survey. A&A, 462, 57–66.
- Sa̧dowski (2009) Sa̧dowski A. (2009). Slim Disks Around Kerr Black Holes Revisited. ApJS, 183, 171–178.
- Schnittman & Krolik (2009) Schnittman J. D. & Krolik J. H. (2009). X-ray Polarization from Accreting Black Holes: The Thermal State. ApJ, 701, 1175–1187.
- Schwarzschild (1916) Schwarzschild K. (1916). On the Gravitational Field of a Mass Point According to Einstein’s Theory. Abh. Konigl. Preuss. Akad. Wissenschaften Jahre 1906,92, Berlin,1907, pages 189–196.
- Seyfert (1943) Seyfert C. K. (1943). Nuclear Emission in Spiral Nebulae. ApJ, 97, 28.
- Shakura & Sunyaev (1973) Shakura N. I. & Sunyaev R. A. (1973). Black holes in binary systems. Observational appearance. A&A, 24, 337–355.
- Shapiro & Teukolsky (1983) Shapiro S. L. & Teukolsky S. A. (1983). Book-Review - Black-Holes White Dwarfs and Neutron Stars. Journal of the British Astronomical Association, 93, 276.
- Shapiro, Lightman & Eardley (1976) Shapiro S. L., Lightman A. P. & Eardley D. M. (1976). A two-temperature accretion disk model for Cygnus X-1 - Structure and spectrum. ApJ, 204, 187–199.
- Shimura & Takahara (1995) Shimura T. & Takahara F. (1995). On the spectral hardening factor of the X-ray emission from accretion disks in black hole candidates. ApJ, 445, 780–788.
- Shu et al. (2010) Shu X. W., Yaqoob T., Murphy K. D., Braito V., Wang J. X. & Zheng W. (2010). NGC 2992 in an X-ray High State Observed by XMM-Newton: Response of the Relativistic Fe K Line to the Continuum. ApJ, 713, 1256–1265.
- Silant’ev & Gnedin (2008) Silant’ev N. A. & Gnedin Y. N. (2008). Polarization of radiation of point-like source reflected from turbulent magnetized atmosphere. A&A, 481, 217–228.
- Soltan (1982) Soltan A. (1982). Masses of quasars. MNRAS, 200, 115–122.
- Soria & Ghosh (2009) Soria R. & Ghosh K. K. (2009). Different Types of Ultraluminous X-Ray Sources in NGC 4631. ApJ, 696, 287–297.
- Stella & Vietri (1998) Stella L. & Vietri M. (1998). Lense-Thirring Precession and Quasi-periodic Oscillations in Low-Mass X-Ray Binaries. ApJ, 492, L59.
- Stephani (2003) Stephani H. (2003). LaPlace, Weimar, Schiller and the birth of black hole theory. ArXiv General Relativity and Quantum Cosmology e-prints.
- Stern et al. (1995) Stern B. E., Poutanen J., Svensson R., Sikora M. & Begelman M. C. (1995). On the Geometry of the X-Ray–Emitting Region in Seyfert Galaxies. ApJ, 449, L13.
- Streblyanska et al. (2005) Streblyanska A., Hasinger G., Finoguenov A., Barcons X., Mateos S. & Fabian A. C. (2005). XMM-Newton observations of the Lockman Hole. III. A relativistic Fe line in the mean X-ray spectra of type-1 and type-2 AGN. A&A, 432, 395–400.
- Strohmayer & Mushotzky (2009) Strohmayer T. E. & Mushotzky R. F. (2009). Evidence for an Intermediate-mass Black Hole in NGC 5408 X-1. ApJ, 703, 1386–1393.
- Strüder et al. (2001) Strüder L., Briel U., Dennerl K., Hartmann R., Kendziorra E., Meidinger N., Pfeffermann E., Reppin C., Aschenbach B., Bornemann W., Bräuninger H., Burkert W., Elender M., Freyberg M., Haberl F., Hartner G., Heuschmann F., Hippmann H., Kastelic E., Kemmer S., Kettenring G., Kink W., Krause N., Müller S., Oppitz A., Pietsch W., Popp M., Predehl P., Read A., Stephan K. H., Stötter D., Trümper J., Holl P., Kemmer J., Soltau H., Stötter R., Weber U., Weichert U., von Zanthier C., Carathanassis D., Lutz G., Richter R. H., Solc P., Böttcher H., Kuster M., Staubert R., Abbey A., Holland A., Turner M., Balasini M., Bignami G. F., La Palombara N., Villa G., Buttler W., Gianini F., Lainé R., Lumb D. & Dhez P. (2001). The European Photon Imaging Camera on XMM-Newton: The pn-CCD camera. A&A, 365, L18–L26.
- Stuchlík (1980) Stuchlík Z. (1980). Equatorial circular orbits and the motion of the shell of dust in the field of a rotating naked singularity. Bulletin of the Astronomical Institutes of Czechoslovakia, 31, 129–144.
- Stuchlík et al. (2005) Stuchlík Z., Slaný P., Török G. & Abramowicz M. A. (2005). Aschenbach effect: Unexpected topology changes in the motion of particles and fluids orbiting rapidly rotating Kerr black holes. Phys. Rev. D, 71(2), 024037.
- Stuhlinger et al. (2006) Stuhlinger M., Altieri B., Esquej M. P., Kirsch M. G. F., Metcalfe L., Pollock A. M. T., Saxton R. D., Smith M. J. S., Talavera A., Sembay S., Read A. M., Baskill D., Haberl F., Freyberg M., Dennerl K., Kaastra J., den Herder J. W., de Vries C. & Vink J. (2006). Status of the XMM-Newton Cross-Calibration with SASv6.5.0. In A. Wilson, editor, The X-ray Universe 2005, volume 604 of ESA Special Publication, page 937.
- Svoboda (2009) Svoboda J. (2009). Role of limb brightening in the angular momentum determination of accreting black holes. In High Resolution X-ray Spectroscopy: Towards IXO.
- Svoboda et al. (2008a) Svoboda J., Dovčiak M., Goosmann R. W. & Karas V. (2008a). Comparison of relativistic iron line models. In J. Šafránková & J. Pavlů, editors, WDS’08 Proceedings of Contributed Papers, pages 204–212. (arXiv: astro-ph/0901.0670).
- Svoboda et al. (2008b) Svoboda J., Dovčiak M., Goosmann R. W. & Karas V. (2008b). The comparison of the relativistic iron line models. In Microquasars and Beyond.
- Svoboda et al. (2009) Svoboda J., Dovčiak M., Goosmann R. & Karas V. (2009). Role of emission angular directionality in spin determination of accreting black holes with a broad iron line. A&A, 507, 1–17.
- Svoboda, Guainazzi & Karas (2010) Svoboda J., Guainazzi M. & Karas V. (2010). Warm absorber and truncated accretion disc in IRAS 05078+1626. A&A, 512, A62.
- Takata et al. (1994) Takata T., Yamada T., Saito M., Chamaraux P. & Kazes I. (1994). Search and redshift survey for IRAS galaxies behind the Northern Milky Way. A&AS, 104, 529–555.
- Tanaka et al. (1995) Tanaka Y., Nandra K., Fabian A. C., Inoue H., Otani C., Dotani T., Hayashida K., Iwasawa K., Kii T., Kunieda H., Makino F. & Matsuoka M. (1995). Gravitationally redshifted emission implying an accretion disk and massive black hole in the active galaxy MCG-6-30-15. Nature, 375, 659–661.
- Thorne (1974) Thorne K. S. (1974). Disk-Accretion onto a Black Hole. II. Evolution of the Hole. ApJ, 191, 507–520.
- Thorne & Price (1975) Thorne K. S. & Price R. H. (1975). Cygnus X-1 - an interpretation of the spectrum and its variability. ApJ, 195, L101–L105.
- Titarchuk, Lapidus & Muslimov (1998) Titarchuk L., Lapidus I. & Muslimov A. (1998). Mechanisms for High-Frequency Quasi-periodic Oscillations in Neutron Star and Black Hole Binaries. ApJ, 499, 315.
- Török et al. (2005) Török G., Abramowicz M. A., Kluźniak W. & Stuchlík Z. (2005). The orbital resonance model for twin peak kHz quasi periodic oscillations in microquasars. A&A, 436, 1–8.
- Tueller et al. (2008) Tueller J., Mushotzky R. F., Barthelmy S., Cannizzo J. K., Gehrels N., Markwardt C. B., Skinner G. K. & Winter L. M. (2008). Swift BAT Survey of AGNs. ApJ, 681, 113–127.
- Turner et al. (2001) Turner M. J. L., Abbey A., Arnaud M., Balasini M., Barbera M., Belsole E., Bennie P. J., Bernard J. P., Bignami G. F., Boer M., Briel U., Butler I., Cara C., Chabaud C., Cole R., Collura A., Conte M., Cros A., Denby M., Dhez P., Di Coco G., Dowson J., Ferrando P., Ghizzardi S., Gianotti F., Goodall C. V., Gretton L., Griffiths R. G., Hainaut O., Hochedez J. F., Holland A. D., Jourdain E., Kendziorra E., Lagostina A., Laine R., La Palombara N., Lortholary M., Lumb D., Marty P., Molendi S., Pigot C., Poindron E., Pounds K. A., Reeves J. N., Reppin C., Rothenflug R., Salvetat P., Sauvageot J. L., Schmitt D., Sembay S., Short A. D. T., Spragg J., Stephen J., Strüder L., Tiengo A., Trifoglio M., Trümper J., Vercellone S., Vigroux L., Villa G., Ward M. J., Whitehead S. & Zonca E. (2001). The European Photon Imaging Camera on XMM-Newton: The MOS cameras : The MOS cameras. A&A, 365, L27–L35.
- Turner & Miller (2009) Turner T. J. & Miller L. (2009). X-ray absorption and reflection in active galactic nuclei. A&A Rev., 17, 47–104.
- Turner et al. (1997) Turner T. J., George I. M., Nandra K. & Mushotzky R. F. (1997). ASCA Observations of Type 2 Seyfert Galaxies. I. Data Analysis Results. ApJS, 113, 23.
- Turner et al. (1999) Turner T. J., George I. M., Nandra K. & Turcan D. (1999). On X-Ray Variability in Seyfert Galaxies. ApJ, 524, 667–673.
- Turner et al. (2002) Turner T. J., Mushotzky R. F., Yaqoob T., George I. M., Snowden S. L., Netzer H., Kraemer S. B., Nandra K. & Chelouche D. (2002). Narrow Components within the Fe K Profile of NGC 3516: Evidence of the Importance of General Relativistic Effects? ApJ, 574, L123–L127.
- Turner et al. (2006) Turner T. J., Miller L., George I. M. & Reeves J. N. (2006). Evidence for orbital motion of material close to the central black hole of Mrk 766. A&A, 445, 59–67.
- Urry & Padovani (1995) Urry C. M. & Padovani P. (1995). Unified Schemes for Radio-Loud Active Galactic Nuclei. PASP, 107, 803.
- Uttley (2008) Uttley P. (2008). Astrophysics: Heartbeat of an active galaxy. Nature, 455, 294–295.
- Uttley & McHardy (2005) Uttley P. & McHardy I. M. (2005). X-ray variability of NGC 3227 and 5506 and the nature of active galactic nucleus ‘states’. MNRAS, 363, 586–596.
- van der Klis (2006) van der Klis M. (2006). Rapid X-ray Variability, pages 39–112.
- Vaughan & Fabian (2004) Vaughan S. & Fabian A. C. (2004). A long hard look at MCG-6-30-15 with XMM-Newton- II. Detailed EPIC analysis and modelling. MNRAS, 348, 1415–1438.
- Vestergaard & Osmer (2009) Vestergaard M. & Osmer P. S. (2009). Mass Functions of the Active Black Holes in Distant Quasars from the Large Bright Quasar Survey, the Bright Quasar Survey, and the Color-selected Sample of the SDSS Fall Equatorial Stripe. ApJ, 699, 800–816.
- Viergutz (1993) Viergutz S. U. (1993). Image generation in Kerr geometry. I. Analytical investigations on the stationary emitter-observer problem. A&A, 272, 355.
- Volonteri et al. (2005) Volonteri M., Madau P., Quataert E. & Rees M. J. (2005). The Distribution and Cosmic Evolution of Massive Black Hole Spins. ApJ, 620, 69–77.
- Walborn (1973) Walborn N. R. (1973). The Spectrum of HDE 226868 (=CYGNUS X-1). ApJ, 179, L123.
- Wang, Wei & He (2006) Wang J., Wei J. Y. & He X. T. (2006). A Sample of IRAS Infrared-selected Seyfert 1.5 Galaxies: Infrared Color (60, 25)-dominated Eigenvector 1. ApJ, 638, 106–119.
- Webster & Murdin (1972) Webster B. L. & Murdin P. (1972). Cygnus X-1-a Spectroscopic Binary with a Heavy Companion ? Nature, 235, 37–38.
- Wilms, Allen & McCray (2000) Wilms J., Allen A. & McCray R. (2000). On the Absorption of X-Rays in the Interstellar Medium. ApJ, 542, 914–924.
- Wilms et al. (2001) Wilms J., Reynolds C. S., Begelman M. C., Reeves J., Molendi S., Staubert R. & Kendziorra E. (2001). XMM-EPIC observation of MCG-6-30-15: direct evidence for the extraction of energy from a spinning black hole? MNRAS, 328, L27–L31.
- Yamada et al. (2009) Yamada S., Makishima K., Uehara Y., Nakazawa K., Takahashi H., Dotani T., Ueda Y., Ebisawa K., Kubota A. & Gandhi P. (2009). Is the Black Hole in GX 339-4 Really Spinning Rapidly? ApJ, 707, L109–L113.
- Young et al. (2005) Young A. J., Lee J. C., Fabian A. C., Reynolds C. S., Gibson R. R. & Canizares C. R. (2005). A Chandra HETGS Spectral Study of the Iron K Bandpass in MCG -6-30-15: A Narrow View of the Broad Iron Line. ApJ, 631, 733–740.
- Yu & Tremaine (2002) Yu Q. & Tremaine S. (2002). Observational constraints on growth of massive black holes. MNRAS, 335, 965–976.
- Yuan (2001) Yuan F. (2001). Luminous hot accretion discs. MNRAS, 324, 119–127.
- Yuan & Narayan (2004) Yuan F. & Narayan R. (2004). On the Nature of X-Ray-Bright, Optically Normal Galaxies. ApJ, 612, 724–728.
- Zakharov & Repin (2004) Zakharov A. F. & Repin S. V. (2004). The iron Kalpha-line diagnostics of the rotating black hole metric in Seyfert galaxies. Advances in Space Research, 34, 2544–2549.
- Zhang, Cui & Chen (1997) Zhang S. N., Cui W. & Chen W. (1997). Black Hole Spin in X-Ray Binaries: Observational Consequences. ApJ, 482, L155.
- Ziółkowski (2008) Ziółkowski J. (2008). Masses of Black Holes in the Universe. Chinese Journal of Astronomy and Astrophysics Supplement, 8, 273–280.
- Życki & Czerny (1994) Życki P. T. & Czerny B. (1994). The Iron K-Alpha Line from a Partially Ionized Reflecting Medium in an Active Galactic Nucleus. MNRAS, 266, 653.