A COMPARISON BETWEEN THE HALF-LIGHT RADII, LUMINOSITIES, AND UBV COLORS OF GLOBULAR CLUSTERS IN M31 AND THE GALAXY
Abstract
The Milky Way System and the Andromeda galaxy experienced radically different evolutionary histories. Nevertheless, it is found that these two galaxies ended up with globular cluster systems in which individual clusters have indistinguishable distributions of half-light radii. Furthermore globulars in both M31 and the Galaxy are found to have radii that are independent of their luminosities. In this respect globular clusters differ drastically from early-type galaxies in which half-light radius and luminosity are tightly correlated. Metal-rich globular clusters in M31 occupy a slightly larger volume than do those in the Galaxy. The specific globular cluster frequency in the Andromeda galaxy is found to he significantly higher than it is in the Milky Way System. The present discussion is based on the 107 Galactic globular clusters, and 200 putative globulars in M31, for which UBV photometry was available.
Online material: machine readable tables.
1 INTRODUCTION
A number of lines of evidence (van den Bergh 2006, Hammer et al. 2007, Brown et al. 2008) indicate that the Milky Way system likely had a relatively quiescent formation history, whereas the Andromeda galaxy appears to have had a more eventful merger-dominated evolution. It is widely believed (e.g. Larsen 2010) that many globular clusters form during the bursts of star formation that accompany merger events. This suggests that the different evolutionary histories of M31 and the Galaxy might be reflected in systematic differences between their globular cluster systems. Some spice is added to this problem by the fact that the Galaxy may have a more massive dark matter halo than M31, even though the Andromeda galaxy has a larger stellar mass than does the Milky Way System (Watkins et al. 2010). To look into these questions in more detail the present paper compares available information on the globular cluster systems in these two spiral galaxies.
Data on the integrated UBV colors of the majority of galactic globular clusters have been compiled by Harris (1996) and were updated at www.physics.mcmaster.ca/Globular.html. It is the purpose of the present paper to provide comparable UBV data for those clusters in the Andromeda galaxy which Peacock et al. (2010) have recently flagged as “old globular clusters”. A complete listing of information on these old clusters is given at htttp://astro.soton.ac.uk/ m.b.peacock/m31gc.html. Peacock used the following criteria for includsion of an object in his listing of old globular clusters: (1) All objects are previously identified in other catalogs, (2) previously published spectroscopy (or HST observations) confirm that they are not background galaxies, (3) colors are consistent with these objects being old clusters. This age cut is based on g-r color. Finally (4) preliminary spectral energy distributions obtained so far confirm that most of these objects are genuinely older than 10 Gyr. Data for these clusters in M31, transformed to the UBV system, are listed in Table 1. Color transformations from the ugr system to the UBV system were drawn from Jester et al. (2005) and Peacock et al. (2010). Values based on color indexes that are uncertain by more than 0.050 mag are followed by a colon (:). Applying the transformations used by Jester et al. to the colors of globular clusters may introduce slightly larger errors than those obtained from objects having the energy distributions of single stars. The actual transformation equations used were the following:
V = g - 0.59(g-r) - 0.01, (1)
B-V = [(g-r) + 0.22]/ 1.02, (2)
U-B = [(u-g) - 1.13]/ 1.28. (3) Also given in the table is the reddening-free parameter
Q = U-B - 0.72(B-V) (4) introduced by Johnson & Morgan (1953). Van den Bergh (1967) has shown that this parameter is related to the intrinsic color of a globular cluster by
= Q + 1.00. (5)
This relation allows one to determine the reddening values, and hence the absolute magnitudes, of individual globular clusters in M31. The cluster absolute magnitudes and half-light radii listed in Table 1 were calculated assuming a distance to M31 of 780 kpc (McConnachie et al. 2005) and using the equation
= 3.1 E(B-V) (6)
to describe the relation between the total and selective absorption in the
Andromeda galaxy. For a very small number of objects with negative E(B-V)
values the foreground absorption was assumed to be zero. All of the objects in
this class have uncertain (:) photometry.
While the present paper was being written Wang et al. (2010) published a
less extensive catalog of UBV data in M31, which was based on the data of
Galleti et al. (2004, 2006, 2007) and Barmby et al. (2000). A comparison
between these sets of UBV data shows good agreement. The mean observed differences
in the sense Wang - van den Bergh are +0.02 0.02 mag in V, -0.07 0.03 mag in B-V and 0.00 0.04 mag in U - B.
Data on 200 putative globular clusters in the Andromeda galaxy, for which both half-light radii and UBV data are are available, have been collected in Table 1. In Table 2 similar information is provided for 107 Galactic globular clusters. The latter data were drawn from the updated version of Harris (1996) and from Mackey & van den Bergh (2005). The data in both of these tables are, of course, most incomplete for intrinsically faint globulars. The Andromeda galaxy is seen to contain 16 clusters brighter than = -10.0, compared to only 2 such clusters in the Milky Way System. The corresponding figures for clusters with -9.99 -9.00 and -8.99 -8.00 are 35 and 10, and 88 and 26, respectively. If the luminosity distributions of the globular clusters are similar in these two galaxies, then these results indicate that the M31 cluster system contains about four times as many globular clusters as does its Galactic counterpart.
2 CLUSTER HALF-LIGHT RADII
A number of investigations of the dynamical evolution of globular clusters (Spitzer & Thuan 1972, Lightman & Shapiro 1978, Murphy, Cohn & Hut 1990, Aarseth & Heggie 1998) have shown that the half-light radii of such clusters evolve very little over periods as long as ten cluster relaxation times. The cluster half-light radius is therefore a useful parameter for the study of possible intrinsic differences between the globular clusters in different galaxies. In the discussion given below use will be made of the median of the half-light radii of various data sets. Beers et al. (1990) have shown that this parameter is of comparable accuracy to more complicated metrics for populations with n 100. The possibility that the radii of globular clusters might be a useful parameter for the estimation of distances to clusters was first hinted at by Shapley and Sawyer (1927). The fact that the radii of globular clusters are in fact (at least within the main body of the Milky Way) independent of their luminosities was first established by van den Bergh & Morbey (1984). This conclusion is confirmed by the data on the globular clusters in the Andromeda galaxy and in the Milky Way System that are discussed below. The result that the half-light radii of globular clusters associated with early-type galaxies are independent of globular cluster luminosity has also been confirmed over a range of 2 magnitudes by Jordán et al. (2005) in the Virgo cluster and, more recently, over a range of 3 magnitudes in the Fornax cluster (Masters et al. 2010).
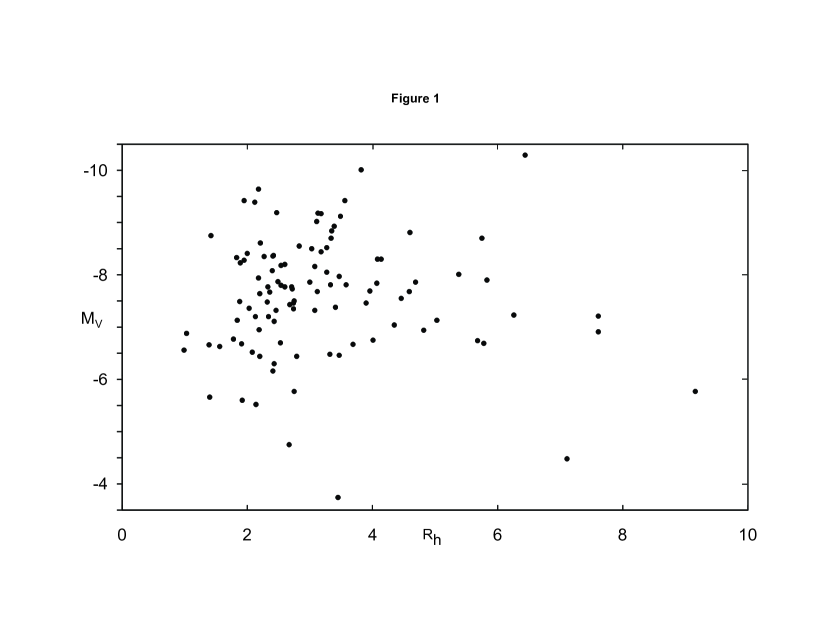
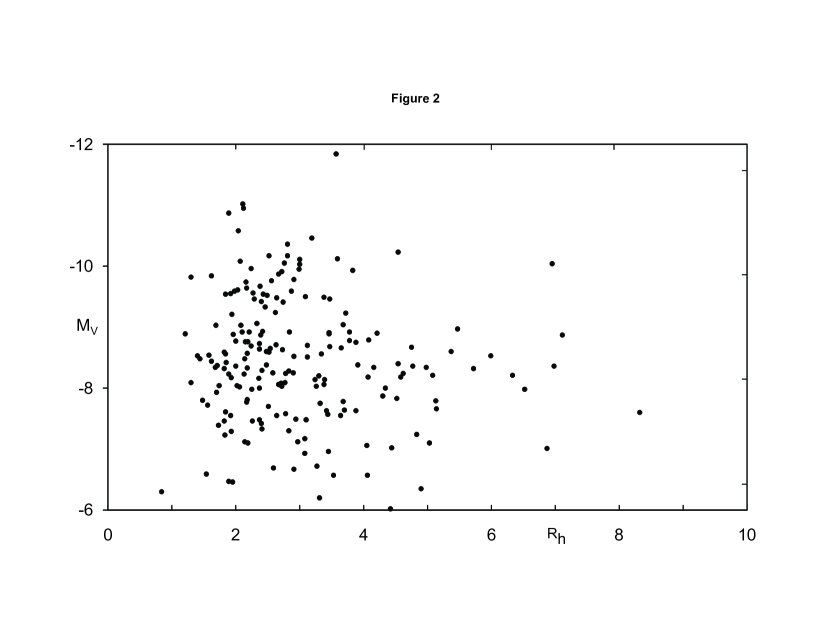
Figure 1 shows a plot of the versus relation for the 107 Galactic globular cluster in our sample. A similar plot for the 200 putative globular clusters in the Andromeda galaxy is shown in Figure 2. Due to observational selection effects the M31 cluster sample is highly incomplete for clusters fainter than -7. Inspection of Figure 2 hints at the possibility that clusters in the Andromeda galaxy with large radii are more common among clusters fainter than = -9.0 than they are among more luminous ones. However, a Kolmogorov-Smirnov test shows that this apparent effect is only significant at the 95% level. Figure 1 shows no corresponding effect among Galactic globular clusters. The discovery of a few very extended globular clusters (Huxor et al. 2008, and references therein) in M31 suggests that it would be most useful to discuss the cluster half-light radii in terms of their median, rather than in terms of their mean radii. This view is supported by the observation (e.g. Harris 2010) that the distribution of the effective radii of globular clusters in many galaxies has a tail that extends to large radii. Data on the median radii of the globular clusters in M31 and in the Galaxy are collected in Table 3. Neither in Andromeda, nor in the Milky Way do these data suggest clear-cut evidence for a dependence of radii of globular clusters on their luminosity. In this respect globular clusters differ radically from early-type galaxies (Giuricin et al. 1988 , Nair et al. 2010), in which radii and luminosities are (in all environments) tightly correlated. Furthermore, at any given magnitude level, the data in Table 3 show no hint for systematic differences between the median radii of globular clusters in M31 and in the Galaxy. Since there appears to be little or no correlation between the radii of globular clusters and their half-light radii it is legitimate to inter-compare the half-light radii of the total cluster populations in M31 and in the Galaxy, even though the clusters are sampled to differing luminosity limits in these two galaxies. The median half-light radii for these two galaxies are found to be: = 2.74 pc for 107 globulars in the Galaxy, compared to = 2.67 pc for 200 putative globular clusters in M31. A Kolmogorov-Smirnov test show no statistically significant difference between the distribution of the half-light radii of the clusters in M31 and of those in the Galaxy. It is of particular interest to note that these values appear to be indistinguishable from the corresponding values for the globular cluster systems surrounding the luminous early-type galaxies in the Virgo and Fornax clusters that have recently been studied by Jordán et al. (2005) and by Masters et al. (2010) respectively. The surprising conclusion from these results is that globular clusters surrounding galaxies, that were assembled in a wide variety of environments, appear to have ended up with similar radii.
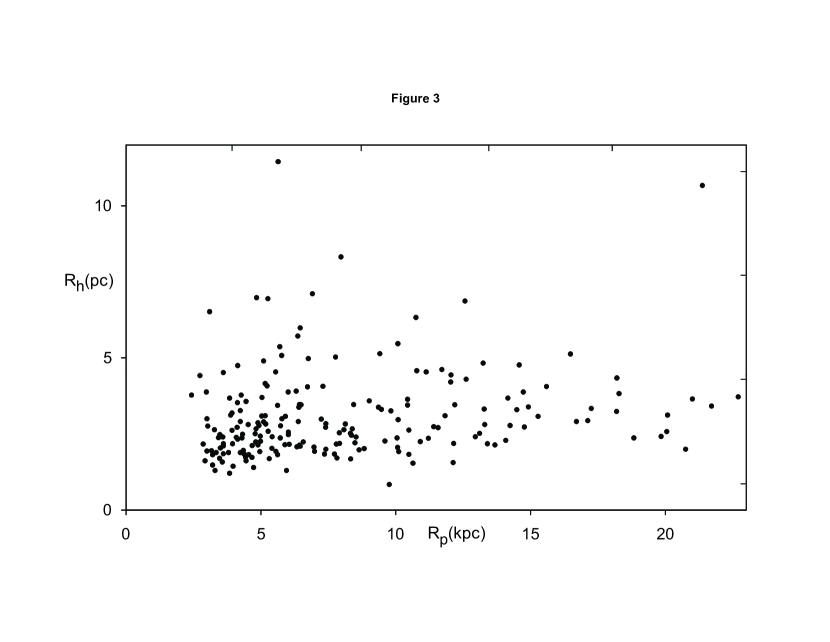
Figure 3 shows a plot of the half-light radii of the M31 globular clusters as a function of their projected distance from the nucleus of that galaxy. These data show that the radii of clusters increase slightly with increasing distance from the nucleus of M31. For 63 globulars with a projected nuclear distance 5.0 kpc the median half-light radius is 2.35 pc, compared to a median of 3.11 pc for those 58 clusters that are situated at a projected distance 10.0 kpc from the nucleus of M31. It seems likely that this 32% increase in radius is related to the well-known fact that blue globular clusters are, on average, larger than red ones. For example Masters et al. (2010) find that the half-light radii of red globular cluster surrounding early type galaxies have = 2.8 0.3 pc , compared to = 3.4 0.4 pc for blue globular clusters, a 21% difference. A caveat is that the results presented above refer to globular clusters of above-average luminosity. One therefore cannot yet rule out the possibility that different relationships might exist for clusters of below-average luminosity.
3 LUMINOSITY-RADIUS RELATION
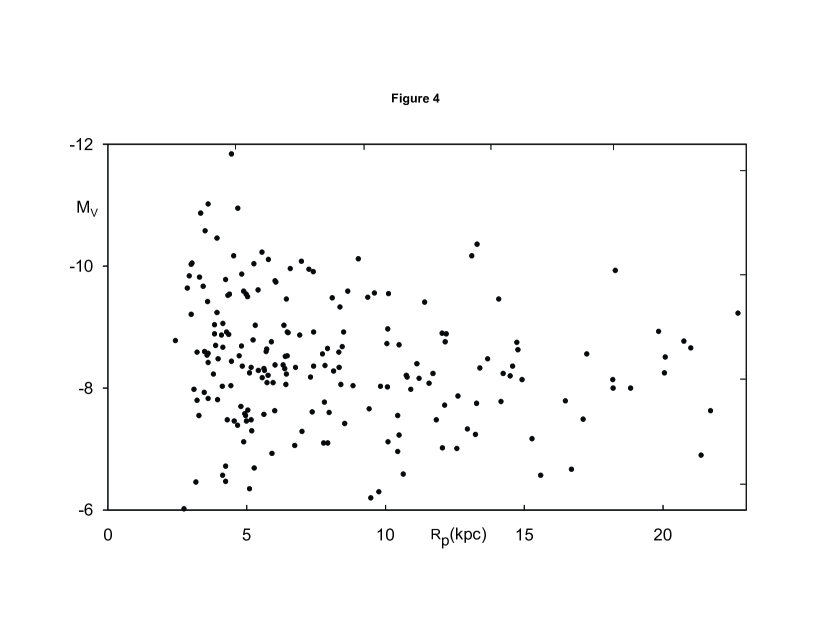
Figure 4 shows a plot of the luminosities of globular clusters as a function of their projected distance from the nucleus of M31. This figure shows that the globular clusters in the central region of the Andromeda galaxy appear to be systematically more luminous that those located at greater distances from the nucleus of M31. A K-S test shows a 95% probability that the difference between the radial distributions of clusters with -9.0, and those with -9.0, is real. Since the present sample contains few clusters at 2.5 kpc it appears unlikely that the observed effect is due to observational selection against relatively faint clusters in the bright central bulge of M31. Possibly the excess of luminous globular clusters, at small nuclear distances, is due to preferential formation of massive clusters in high-density regions. Alternatively the most massive clusters might have been dragged inwards by tidal friction. A similar plot of versus Galactocentric distance for the globular clusters in the Milky Way System is shown as Figure 4.8 in the monograph by van den Bergh (2000, p.62). Because of differing selection effects a direct comparison between the Galaxy and M31 is difficult. In particular it is not yet possible to say if M31 shares the excess of intrinsically very faint Galactic globular clusters that is seen at 20 kpc.
4 METALLICITY VERSUS Q RELATION
The correlation between the published values of the metallicity parameter [Fe/H] and the reddening-free index Q for Galactic globular clusters exhibits considerable scatter. This is, no doubt, due to (1) observational errors in the determinations of [Fe/H], and (2) errors in the observed globular cluster colors. Such errors are particularly large for the U-B measurements of faint clusters that are superposed on rich star fields. Finally, (3) “second parameter” effects on the horizontal branches of the color-magnitude diagrams of individual globular clusters will introduce an intrinsic dispersion in the cluster color versus metallicity relation. Average Q values for different metallicity bins are listed in Table 4. The data in the table may be approximated by the relation
Q -0.17 + 0.11 [Fe/H]. (7)
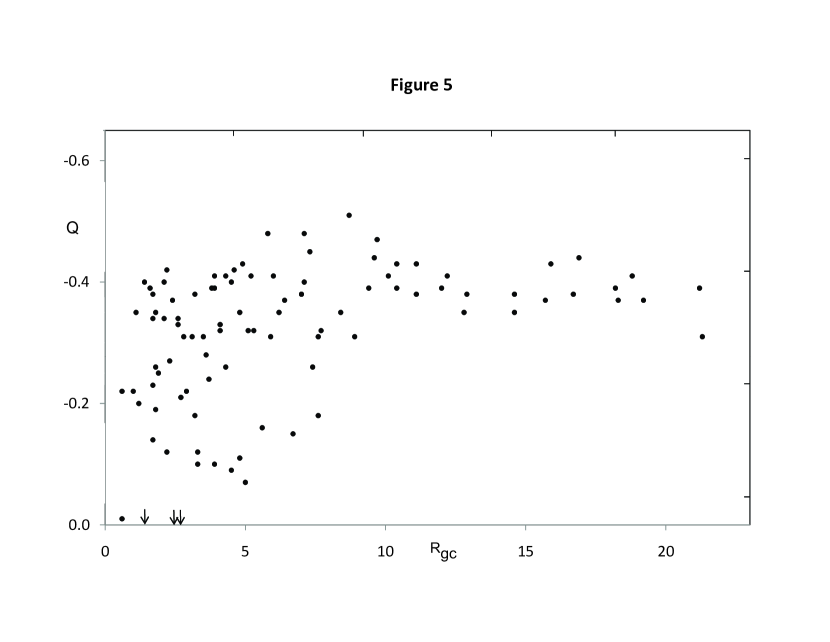
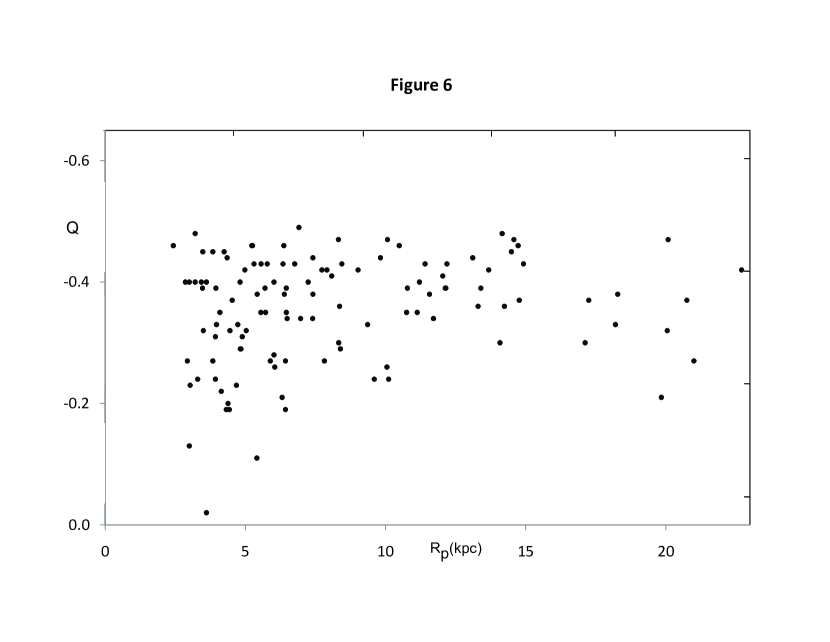
However, the reader is cautioned that there is no a-priori reason to believe that the relation between the metallicity parameter [Fe/H] and the the reddening-free color index Q or a globular cluster is, in fact, linear. Spectroscopic data on individual globular clusters in M31, which have a wide range in accuracy, have been published by Perrett et al. (2002). These data are found to be consistent with Equation 7, which was derived for Galactic globulars. Inspection of Figure 5 shows that metal-poor Galactic globular clusters with Q -0.35 occur at all Galactocentric radii. On the other hand clusters with Q -0.35 are almost entirely confined to the region with 8 kpc. Finally the four (presumably most metal-rich clusters) with Q -0.05 are all situated at 3 kpc. Figure 6 shows a broadly similar situation for the projected nuclear distances of clusters in M31. Metal-poor clusters with Q -0.35 are found at all projected nuclear distances, whereas the more metal-rich clusters with Q - 0.35 all have projected nuclear distances 10 kpc. Finally the three M31 clusters with the largest Q values, which are presumably the most metal-rich, are all situated at 6 kpc. Even though M31 and the Galaxy had very different evolutionary histories the radial dependence of metallicity appears to be quite similar in these two galaxies. The projected nuclear distance is always smaller than the true nuclear distance. The data discussed above therefore show that the zône containing metal-rich clusters in M31 extends to slightly larger nuclear distances than is the case in the Galaxy.
For the M31 clusters listed in Table 1 the median value of Q = -0.37, compared to a median value of Q = -0.35 for for the Galactic globulars in Table 7. From Equation 7 one then obtains median values of [Fe/H] = -1.64 and [Fe/H] = - 1.82 for the Galaxy and M31, respectvely. A K-S test shows that the distribution of Q values in M31 does not differ, at a statistically significant level, from that of the globular clusters in the Galaxy.
For the M31 clusters listed in Table 1 the median value of Q = -0.37, compared to a median value of Q = -0.35 for for the Galactic globulars in Table 2. From Equation 2 one then obtains median values of [Fe/H] = -1.64 and [Fe/H] = - 1.82 for the Galaxy and M31, respectively.
A K-S test shows that the distribution of Q values in M31 does not differ at a statistically significant level, from that of the globular clusters in the Galaxy. However, one should not read too much into this result because both the Galactic and M31 samples are strongly biased by the requirement that UBV photometry be available. This selection criterion introduces a strong bias against metal-rich clusters which are faint (and therefore difficult to observe) in the U band of the UBV system.
It is of some interest to compare the present compilation of reddening data in M31 with a similar listing given recently by Fan et al. (2008). Such a comparison shows that the reddening values adopted in Table 1 are systematically larger by 0.10 1 0.01 mag than are those obtained by Fan et al. The reason for this difference is not yet clear. After correcting for this systematic difference the rms difference between the present individual reddening values, and those adopted by Fan et al. is 0.08 mag.
5 X-RAY SOURCES IN M31 CLUSTERS
In a recent paper Peacock et al. (2010) have identified 45 X-ray sources that appear to be associated with M31 globular clusters. These authors speculate that high stellar collision rates are the dominant factor that determines whether a globular cluster will contain an X-ray binary. This hypothesis is strongly supported by the present data which show that the 17 M31 globulars in our catalog that contain an X-ray source have a median radius = 2.03 pc, which is significantly smaller than the value = 2.67 for all M31 globular clusters in our sample. A K-S test shows that there is only a0.01% chance that the X-ray and non X-ray clusters in M31 were drawn from the same parent distribution of sizes. The only object in the Peacock et al. sample that does not appear to be compact is the cluster B375 = G307, which has a half-light radius = 5.14 pc. Furthermore, the X-ray clusters in our sample are typically a full magnitude brighter than their non X-ray counterparts. A K-S test shows that this difference is significant at the 99.5% confidence level. It is therefore concluded that the X-ray clusters in our M31 sample are both smaller, and more luminous, than those which do not contain an X-ray source. Both of these results support a model in which the collision rate in globular clusters determines whether a cluster will contain an X-ray binary.
6 CONCLUSIONS
In both M31 and in the Galaxy the half-light radii of globular clusters are found to be independent of their luminosities. In this respect globulars differ dramatically from early-type galaxies in which radii and luminosities are tightly correlated in all environments.
The median half-light radius of clusters in M31 is found to be = 2.67 pc in M31, compared to = 2.74 pc in the Galaxy.
In both M31, and the Galaxy, the half-light radii of the metal-poor clusters are found to be systematically larger than those of metal-rich clusters.
The sizes of metal-poor globular clusters in both the Galaxy and M31 are found to increase with distance from the nucleus. It follows that the difference between the radii of metal-rich and metal-poor globular clusters is not just due to differing metallicity.
The distribution of the half-light radii of putative globular clusters in M31 is statistically indistinguishable from that of the distribution of the radii of Galactic globular clusters.
In both galaxies the most metal-rich clusters are concentrated at small galactocentric distances. However, the region containing metal-rich clusters is slightly larger in M31 than it is in the Galaxy.
At 95% confidence it is found that the most luminous globulars in M31 are more concentrated towards the the center of this galaxy than are clusters of lesser luminosity.
The specific frequency of globular clusters in M31 appears to be three or four times greater than it is in the Galaxy. The excess of M31 clusters per unit mass seems to be even greater than this.
The half-light radii of globular clusters in M31 and in the Galaxy seem to be very similar to those of the globulars surrounding luminous early-type galaxies in the Virgo and Fornax clusters. This suggests that the radii with which clusters are formed in early-type galaxies are broadly independent of environment.
7 APPENDIX
It is of some interest to compare the radii of Galactic globular clusters with those of the globular clusters that are known to be associated with the dwarf spheroidal companions of Milky Way system. Listed below in Table 5 are data on the half-light radii of the five globular clusters associated with the Fornax dwarf, taken from van den Bergh & Mackey (2004) and information on the half-light radii of seven globular clusters which Law & Majewski (2010) assign with, high or moderate, confidence to the Sagittarius dwarf. The most striking feature of the data in this table is that all 12 of these clusters have radii that are larger than the median half-light radius of Galactic globular clusters. The median radius of the clusters in Table 5 is = 6.8 pc, which is 2.5x larger than the = 2.74 pc median radius of all Galactic globular clusters in Table 2. Of the six globulars with 6.8 pc in Table 2, two are likely associated with the Sagittarius dwarf. This suggests that: (1) satellite clusters of disrupted dwarf companions probably provided a significant contribution to total population of large Galactic globular clusters, and (2) that only a few mergers with Sagittarius-like dwarfs took place during the assembly of the Milky Way system.
It is a pleasure to thank Mark Peacock for a listing of projected galactocentric distances for the globular clusters in M31. I also thank Alan McConnachie for reading the draft manuscript. I am also indebted to Bill and Gretchen Harris for exchanges of e-mails and to Brenda Parrish and Jason Shrivell for technical support.
References
- (1)
- (2) Aarseth, S. J. & Heggie, D. C. 1998, MNRAS, 297, 794
- (3) Barmby, P., Huchra, J.,Forbes, D., Schroder, L. & Grillmair, C. AJ, 119, 727
- (4) Beers, T. C., Flynn, K. & Gebhardt, K, 1990, AJ, 100, 32
- (5) Brown, T. M. et al. 2008, ApJ, 685, L121
- (6) Galleti, S., Frederici, L.,Bellazzini, M., Fusi Pecci, F & Macrina, S. 2004, A&A, 416, 917
- (7) Galleti,S., Frederici, L., Bellazzini, M., Buzzoni, A., Fusi Pecci, F. 2006, A&A, 456, 985
- (8) Galleti,S., Bellazzini, M., Frederici, L.,Buzzoni, A & Fusi Pecci, F. 2007, A&A, 471, 127
- (9) Giuricin, G., Mardirossian, F. & Mezzetti, M 1988, A&AS, 72, 151
- (10) Hammer, F., Puech, M. Chemin, L., Flores, H. & Lehnert, M. D. 2007, ApJ, 662, 322
- (11) Harris, W. E. 1996 AJ, 112, 1487
- (12) Harris, W. E. 2010, Phil. Trans. R. Soc. A 368, 889
- (13) Huxor, A. P., Tanvir, N. R., Ferguson, A. M. N., Irwin, M. J., Ibata, R., Bridges, T. & Lewis, G. F. 2008, MNRAS, 385, 1989
- (14) Jester, S. et al. 2005, AJ, 130, 873
- (15) Johnson, H. L. & Morgan, W. W. 1953, ApJ, 117, 313
- (16) Jordán, A. et al. 2005, ApJ, 634, 1002.
- (17) Larsen, S. S. 2010, Phil. Trans. R. Soc. A 368, 867
- (18) Lightman, A. P., & Shapiro, S. L. 1978, Rev. Mod. Phys., 50, 437
- (19) Mackey, A. D. & van den Bergh, S. 2005, MNRAS, 360, 631
- (20) Masters, K. L. et al. 2010, AJ (in press = arXiv:1003.3450)
- (21) McLaughlin, D. E., Barmby, P., Harris, W. E., Forbes, D. A. & Harris, G. L. H. 2008, MNRAS, 384, 563
- (22) Murphy, B. W., Cohn, H. N. & Hut, P. 1990, MNRAS, 245, 355
- (23) Nair, P. B., van den Bergh, S. & Abraham, R. G. 2010, ApJ (in press = arXiv:1004.1107)
- (24) Peacock, M. B., Maccarone, T. J., Kundu, A., & Aepf, S. E. & R. 2010, MNRAS (in press = arXiv:1006.0449
- (25) Shapley, H. & Sawyer, H. B. 1927, Harvard Obs Bull No. 852, p.22
- (26) Spitzer, L. & Thuan, T. X. 1972, ApJ, 175, 31
- (27) van den Bergh, S. 1967, AJ, 72, 70
- (28) van den Bergh, S. 2000, The Galaxies of the Local Group (Cambridge: Cambridge University Press)
- (29) van den Bergh, S. 2006, in The Local Group as an Astrophysical Laboratory, Eds. M. Livio & T. M. Brown (Cambridge: Cambridge University Press), p.1
- (30) van den Bergh, S. & Mackey, A. D. 2004, MNRAS, 354, 713
- (31) van den Bergh, S. & Morbey, C. L. 1984, Astron. Expr, 1, 1
- (32) Wang, S., Fan, Z., Ma, J., de Grijs, R. & Zhou, X. 2010, AJ (in press = arXiv: 1001.3939)
- (33)
| Cluster ID | V | B-V | U-B | Q | E(B-V) | |||
|---|---|---|---|---|---|---|---|---|
| B292-G010 | 17.16 | 0.76 | 0.25 | -0.30 | 0.06 | 16.74 | -7.49 | 2.94 |
| B293-G011 | 16.27 | 0.75 | 0.17 | -0.37 | 0.12 | 15.99 | -8.56 | 3.34 |
| B295-G014 | 16.66 | 0.76 | 0.08 | -0.47 | 0.23 | 15.95 | -8.51 | 3.12 |
| B298-G021 | 16.47 | 0.72 | 0.16 | -0.36 | 0.08 | 16.22 | -8.24 | 2.78 |
| B301-G022 | 17.05 | 0.95 | 0.36 | -0.32 | 0.27 | 16.21 | -8.25 | 2.58 |
| B302-G023 | 16.75: | 0.76 | 0.16 | -0.39 | 0.15 | 16.28: | -8.18: | 4.58 |
| B304-G028 | 16.81 | 0.80 | 0.14 | -0.44 | 0.24 | 16.43 | -8.03 | 3.26 |
| B305-D024 | 17.79 | 0.80 | 0.50: | -0.08: | -0.12: | 17.79 | -6.67: | 2.91 |
| B306-G029 | 16.21 | 1.32 | 0.59 | -0.36 | 0.68 | 14.10 | -10.36 | 2.81 |
| B307-G030 | 17.22 | 0.80 | 0.39: | -0.19: | -0.01: | 17.22: | -7.24: | 4.83 |
| B309-G031 | 17.48 | 0.90 | 0.29: | -0.36: | 0.26: | 16.67: | -7.79: | 5.13 |
| B436 | 18.17: | 0.94 | 0.53: | -0.15: | 0.09: | 17.89: | -6.57: | 4.06 |
| B311-G033 | 15.41 | 0.92 | 0.22 | -0.44 | 0.36 | 14.29 | -10.17 | 2.52 |
| B312-G035 | 15.49 | 0.95 | 0.26 | -0.42 | 0.37 | 14.34 | -10.12 | 3.59 |
| B313-G036 | 16.24 | 1.08 | 0.45 | -0.33 | 0.41 | 14.97 | -9.49 | 3.38 |
| B001-G039 | 17.00 | 1.16 | 0.53: | -0.31: | 0.47: | 15.54: | -8.92: | 2.21 |
| B316-G040 | 16.78 | 0.82 | 0.24 | -0.35 | 0.17 | 16.25 | -8.21 | 6.33 |
| B002-G043 | 17.54 | 0.72 | 0.12: | -0.40: | 0.12: | 17.17: | -7.29: | 1.93 |
| B003-G045 | 17.59 | 0.78 | 0.28: | -0.28: | 0.06: | 17.40: | -7.06: | 4.05 |
| B004-G050 | 16.94 | 0.96 | 0.42 | -0.27 | 0.23 | 16.23 | -8.23 | 2.13 |
| B005-G052 | 15.64 | 1.00 | 0.48 | -0.24 | 0.24 | 14.90 | -9.56 | 2.27 |
| B006-G058 | 15.46 | 0.96 | 0.50 | -0.19 | 0.15 | 15.00 | -9.46 | 3.47 |
| B333 | 18.75: | 0.94: | 0.01: | -0.67: | 0.61: | 16.86 | -7.60: | 8.32 |
| B008-G060 | 16.77 | 0.96 | 0.52: | -0.17: | 0.13: | 16.37: | -8.09: | 2.77 |
| B009-G061 | 16.87 | 0.81 | 0.14 | -0.44 | 0.25 | 16.10 | -8.36 | 2.00 |
| B010-G062 | 16.64 | 0.86 | 0.23 | -0.39 | 0.25 | 15.86 | -8.60 | 5.37 |
| B011-G063 | 16.68 | 0.83 | 0.18 | -0.42 | 0.25 | 15.90 | -8.56 | 1.84 |
| B012-G064 | 15.06 | 0.80 | 0.15 | -0.43 | 0.23 | 14.35 | -10.11 | 3.00 |
| H16 | 17.56: | 0.70: | 0.29: | -0.21: | -0.09: | 17.56: | -6.90: | 10.67 |
| B013-G065 | 17.18: | 0.95: | 0.33: | -0.35: | 0.30: | 16.25: | -8.21: | 5.08 |
| B335-V013 | 17.75: | 1.29: | 0.49: | -0.44: | 0.73: | 15.49: | -8.97: | 5.47 |
| B015-V204 | 17.91 | 1.38 | 0.78 | -0.21 | 0.59 | 16.08 | -8.38 | 3.91 |
| B016-G066 | 17.50 | 1.01 | 0.67: | -0.06: | 0.07: | 17.77: | -6.69: | 2.59 |
| DA038 | 18.69 | 0.82 | 0.27: | -0.32: | 0.14: | 18.26: | -6.20: | 3.31 |
| B336-G067 | 17.81 | 0.75 | 0.07: | -0.47: | 0.22: | 17.13: | -7.33: | 2.41 |
| B337-G068 | 16.75 | 0.83 | 0.18 | -0.42 | 0.25 | 15.98 | -8.48 | 2.14 |
| B017-G070 | 15.90 | 1.17 | 0.52 | -0.32 | 0.49 | 14.96 | -9.50 | 3.09 |
| B019-G072 | 14.96 | 0.98 | 0.42 | -0.29 | 0.27 | 14.59 | -9.87 | 2.67 |
| B020-G073 | 14.87 | 0.90 | 0.31 | -0.34 | 0.24 | 14.55 | -9.91 | 2.72 |
| B021-G075 | 17.38: | 1.24: | 0.55: | -0.34: | 0.58: | 16.21: | -8.25: | 2.90 |
| B022-G074 | 17.40 | 0.77 | 0.19: | -0.36: | 0.13: | 17.34: | -7.12: | 2.14 |
| B339-G077 | 16.86 | 0.94 | 0.49: | -0.19: | 0.13: | 16.46: | -8.00: | 2.37 |
| B023-G078 | 14.20 | 1.19 | 0.54 | -0.32 | 0.51 | 12.62 | -11.84 | 3.57 |
| B247 | 17.22: | 0.94: | 0.28: | -0.40: | 0.34: | 16.17: | -8.29 | 11.45 |
| B341-G081 | 16.32 | 0.93 | 0.41 | -0.26 | 0.19 | 15.73 | -8.73 | 2.37 |
| B024-G082 | 16.83 | 0.97 | 0.43 | -0.27 | 0.24 | 16.09 | -8.37 | 1.71 |
| B025-G084 | 16.79 | 1.01 | 0.30 | -0.43 | 0.44 | 15.43 | -9.03 | 1.69 |
| B027-G087 | 15.63 | 0.90 | 0.25 | -0.40 | 0.30 | 14.70 | -9.76 | 2.56 |
| B026-G086 | 17.51 | 1.05 | 0.64: | -0.12: | 0.17: | 16.98: | -7.48: | 2.37 |
| B028-G088 | 16.91 | 0.86 | 0.24 | -0.38 | 0.24 | 16.17 | -8.29 | 2.41 |
| B020D-G089 | 17.53: | 1.16 | 0.44: | -0.40: | 0.56: | 15.79: | -8.67: | 4.75 |
| B029-G090 | 16.68 | 1.07 | 0.66: | -0.11: | 0.18: | 16.12: | -8.34: | 4.16 |
| B032-G093 | 17.59: | 1.22: | 0.56: | -0.32: | 0.54: | 15.92: | -8.54: | 1.58 |
| SK026A | 19.37: | 1.03: | 0.38: | -0.36: | 0.39: | 18.16: | -6.30: | 0.84 |
| B033-G095 | 17.88: | 1.01: | 0.26: | -0.47: | 0.48: | 16.88: | -7.58: | 2.78 |
| B034-G096 | 15.43 | 0.97 | 0.44 | -0.26 | 0.23 | 14.72 | -9.74 | 2.16 |
| B457-G097 | 16.97 | 0.81 | 0.11 | -0.47 | 0.28 | 16.10 | -8.36 | 4.77 |
| B035 | 17.42 | 0.98 | 0.33: | -0.36: | 0.34: | 16.37: | -8.09: | 1.30 |
| B036 | 17.41: | 1.04 | 0.41: | -0.34: | 0.38: | 16.23: | -8.23: | 1.89 |
| B037-V327 | 16.77: | 2.18 | 0.95: | -0.62: | 1.80: | 11.19: | -13.27: | 3.88 |
| B038-G098 | 16.49 | 1.00 | 0.32 | -0.40 | 0.40 | 15.25 | -9.21 | 1.94 |
| B039-G101 | 15.99 | 1.28 | 0.69 | -0.23 | 0.51 | 14.41 | -10.05 | 2.76 |
| B041-G103 | 18.44: | 0.68 | 0.28: | -0.21: | -0.11: | 18.44: | -6.02 | 4.42 |
| B042-G104 | 16.19 | 1.61 | 0.93: | -0.23: | 0.84: | 13.59: | -10.87: | 1.89 |
| B343-G105 | 16.26 | 0.77 | 0.18 | -0.37 | 0.14 | 15.83 | -8.63 | 2.73 |
| B045-G108 | 15.77 | 0.98 | 0.40 | -0.31 | 0.29 | 14.87 | -9.59 | 2.87 |
| B046-G109 | 17.87 | 0.85 | 0.13: | -0.48: | 0.33: | 16.85: | -7.61: | 1.84 |
| B047-G111 | 17.42 | 0.84 | 0.11: | -0.49: | 0.33: | 16.40: | -8.06 | 3.38 |
| B050-G113 | 16.79 | 0.93 | 0.48 | -0.19 | 0.12 | 16.42 | -8.04 | 1.74 |
| SK035A | 19.71: | 1.46: | -0.05: | -1.10: | 1.56: | 14.87: | -9.59: | 1.98 |
| B054-G115 | 18.21: | 0.99 | 0.63: | -0.08: | 0.07: | 17.99: | -6.47: | 1.89 |
| B056-G117 | 17.22 | 1.06 | 0.67: | -0.09: | 0.15: | 16.76: | -7.70: | 2.51 |
| B057-G118 | 17.53 | 0.55 | 0.13: | -0.27: | -0.18: | 17.53: | -6.93: | 3.08 |
| B058-G119 | 14.97 | 0.85 | 0.27 | -0.34 | 0.19 | 14.38 | -10.08 | 2.07 |
| B060-G121 | 16.71 | 0.79 | 0.09 | -0.48 | 0.27 | 15.87 | -8.59 | 1.82 |
| B061-G122 | 16.62 | 1.25 | 0.64: | -0.26: | 0.51: | 15.04: | -9.42: | 2.40 |
| B063-G124 | 15.68 | 1.26 | 0.59 | -0.32 | 0.58 | 13.88 | -10.58 | 2.04 |
| B065-G126 | 16.86 | 0.86 | 0.33 | -0.29 | 0.15 | 16.40 | -8.06 | 2.67 |
| B344-G127 | 15.87 | 0.88 | 0.27 | -0.36 | 0.24 | 15.13 | -9.33 | 2.46 |
| B067-G129 | 17.22 | 0.78 | 0.16 | -0.40 | 0.18 | 16.66 | -7.80 | 1.48 |
| B068-G130 | 16.30 | 1.25 | 0.71 | -0.19 | 0.44 | 14.94 | -9.52 | 2.49 |
| B257-V219 | 17.76 | 1.42 | 0.88: | -0.14: | 0.56: | 16.02: | -8.44: | 1.62 |
| B461-G131 | 17.38 | 0.93 | 0.31: | -0.36: | 0.29: | 16.48: | -7.98: | 2.25 |
| B073-G134 | 15.96 | 0.96 | 0.47 | -0.22 | 0.18 | 15.40 | -9.06 | 2.33 |
| B074-G135 | 16.62 | 0.84 | 0.22 | -0.38 | 0.22 | 15.94 | -8.52 | 2.91 |
| B076-G138 | 16.78 | 0.91 | 0.26 | -0.40 | 0.31 | 15.82 | -9.64 | 2.17 |
| B345-G143 | 16.69 | 0.79 | 0.18 | -0.39 | 0.18 | 16.13 | -8.33 | 2.18 |
| B462 | 18.03 | 0.77 | 0.15: | -0.40: | 0.17: | 17.50: | -6.96: | 3.45 |
| B082-G144 | 15.49 | 1.64 | 1.16 | -0.02 | 0.66 | 13.44 | -11.02 | 2.11 |
| B083-G146 | 17.05 | 0.87 | 0.20 | -0.43 | 0.30 | 16.12 | -8.34 | 4.98 |
| B085-G147 | 16.83 | 0.84 | 0.13 | -0.47 | 0.31 | 15.87 | -8.59 | 2.52 |
| B090 | 18.43 | 0.91 | 0.43: | -0.23: | 0.14: | 18.00: | -6.46: | 1.95 |
| B347-G154 | 16.40 | 0.77 | 0.12 | -0.43 | 0.20 | 15.78 | -8.68 | 3.47 |
| B348-G153 | 16.93 | 0.96 | 0.39 | -0.30 | 0.26 | 16.12 | -8.34 | 1.68 |
| B094-G156 | 15.51 | 0.99 | 0.51 | -0.20 | 0.19 | 14.92 | -9.54 | 1.84 |
| B098 | 16.25 | 0.95 | 0.41 | -0.27 | 0.22 | 15.57 | -8.89 | 1.21 |
| B350-G162 | 16.60 | 0.78 | 0.22 | -0.34 | 0.12 | 16.22 | -8.24 | 4.62 |
| B100-G163 | 17.76 | 0.98 | 0.39: | -0.32: | 0.30: | 16.83: | -7.63: | 3.88 |
| B110-G172 | 15.18 | 0.91 | 0.39 | -0.27 | 0.18 | 14.62 | -9.84 | 1.62 |
| B111-G173 | 16.78 | 0.84 | 0.20 | -0.40 | 0.24 | 16.04 | -8.42 | 1.85 |
| B117-G176 | 16.36 | 0.81 | 0.14 | -0.44 | 0.25 | 15.58 | -8.88 | 1.96 |
| SK052A | 18.41: | 0.84: | 0.10: | -0.50: | 0.34: | 17.36: | -7.10: | 2.19 |
| B351-G179 | 17.55 | 0.85 | 0.15: | -0.46: | 0.31 | 16.59: | -7.87: | 4.30 |
| B352-G180 | 16.49 | 0.78 | 0.10 | -0.46 | 0.24 | 15.75 | -8.71 | 2.63 |
| SK053A | 18.48 | 1.00 | 0.15: | -0.57: | 0.57: | 16.71: | -7.75: | 3.32 |
| B125-G183 | 16.46 | 0.79 | 0.11 | -0.46 | 0.25 | 15.68 | -8.78 | 3.78 |
| DAO55 | 18.74 | 0.77 | 0.04: | -0.51: | 0.28: | 17.87: | -6.59: | 1.54 |
| B354-G186 | 17.74 | 0.79 | 0.23: | -0.34: | 0.13: | 17.34: | -7.12: | 2.97 |
| SK055A | 18.61: | 0.92 | -0.17: | -0.83: | 0.75: | 16.28: | -8.18: | 4.07 |
| B135-G192 | 15.97 | 0.98 | 0.31 | -0.40 | 0.38 | 14.79 | -9.67 | 2.38 |
| B141-G197 | 16.91 | 1.03 | 0.29 | -0.45 | 0.48 | 15.42 | -9.04 | 3.68 |
| B091D-D058 | 15.38 | 1.00 | 0.48 | -0.24 | 0.24 | 14.64 | -9.82 | 1.30 |
| B266 | 18.37: | 1.25 | 0.43: | -0.47: | 0.72: | 16.14: | -8.32: | 1.82 |
| B149-G201 | 16.97 | 1.09 | 0.41: | -0.37: | 0.46: | 15.54: | -8.92: | 3.78 |
| B467-G202 | 17.44 | 0.83 | 0.26: | -0.34: | 0.17: | 16.91: | -7.55: | 3.64 |
| B356-G206 | 16.96 | 0.95 | 0.26 | -0.42 | 0.37 | 15.81 | -8.65 | 2.54 |
| B163-G217 | 14.99 | 1.05 | 0.63 | -0.13 | 0.18 | 14.43 | -10.03 | 3.00 |
| B168 | 17.97: | 1.53 | 0.51: | -0.59: | 1.12: | 14.50: | -9.96: | 2.24 |
| B272-V294 | 18.30: | 1.14 | 0.90: | +0.08: | 0.06: | 18.11: | -6.35: | 4.90 |
| B174-G226 | 15.44 | 1.04 | 0.40 | -0.35 | 0.39 | 14.23 | -10.23 | 4.54 |
| B176-G227 | 16.52 | 0.80 | 0.19 | -0.39 | 0.19 | 15.93 | -8.53 | 5.99 |
| B177-G228 | 18.19 | 0.96 | 0.10: | -0.59: | 0.55: | 16.48: | -7.98: | 6.52 |
| B181-G232 | 16.88 | 0.98 | 0.37: | -0.34: | 0.32: | 15.89: | -8.57: | 2.18 |
| B183-G234 | 15.96 | 1.00 | 0.48 | -0.24 | 0.24 | 15.22 | -9.24 | 2.62 |
| B184-G236 | 17.25 | 1.11 | 0.88: | +0.08: | 0.03: | 17.16: | -7.30: | 2.83 |
| B187-G237 | 17.19 | 1.08 | 0.40: | -0.38: | 0.46: | 15.76: | -8.70: | 3.12 |
| B189-G240 | 17.01 | 1.11 | 0.85: | +0.05: | 0.06: | 16.82: | -7.64: | 3.70 |
| B190-G241 | 16.79 | 0.93 | 0.27 | -0.40 | 0.33 | 15.77 | -8.69 | 2.24 |
| B194-G243 | 17.18 | 0.82 | 0.20 | -0.39 | 0.21 | 16.53 | -7.93 | 1.70 |
| B193-G244 | 15.28 | 1.03 | 0.63 | -0.11 | 0.14 | 14.85 | -9.61 | 2.03 |
| B196-G246 | 17.30 | 0.89 | 0.17: | -0.47: | 0.36: | 16.18: | -8.28: | 2.83 |
| B197-G247 | 17.74 | 1.09 | 0.87: | +0.09: | 0.00: | 17.74: | -6.72: | 3.27 |
| B199-G248 | 17.53 | 0.79 | 0.16: | -0.41: | 0.20: | 16.91: | -7.55: | 1.92 |
| B198-G249 | 17.78: | 0.88 | 0.26: | -0.37: | 0.25: | 17.00: | -7.46: | 1.82 |
| B200 | 18.48 | 1.09 | 0.68: | -0.10: | 0.19: | 17.89: | -6.57: | 3.53 |
| B202-G251 | 17.78: | 0.90 | 0.32: | -0.33: | 0.23: | 17.07: | -7.39: | 1.73 |
| B203-G252 | 16.72 | 0.91 | 0.37 | -0.29 | 0.20 | 16.10 | -8.36 | 6.98 |
| B361-G255 | 16.91 | 0.76 | 0.10 | -0.45 | 0.21 | 16.26 | -8.20 | 3.30 |
| B206-G257 | 15.03 | 0.87 | 0.26 | -0.37 | 0.24 | 14.29 | -10.17 | 2.81 |
| B207-G258 | 17.33 | 0.83 | 0.21 | -0.39 | 0.22 | 16.65 | -7.81 | 2.18 |
| B208-G259 | 17.84 | 1.06 | 0.43: | -0.33: | 0.39: | 16.63: | -7.83: | 4.52 |
| M009 | 17.84: | 0.83 | 0.13: | -0.47: | 0.30: | 16.91: | -7.55: | 2.64 |
| G260 | 16.89 | 0.81 | 0.25 | -0.33 | 0.14 | 16.46 | -8.00 | 4.34 |
| B209-G261 | 16.60 | 0.87 | 0.30 | -0.33 | 0.20 | 15.98 | -8.48 | 1.44 |
| B211-G262 | 16.57 | 0.78 | 0.11 | -0.45 | 0.23 | 15.86 | -8.60 | 2.48 |
| B212-G263 | 15.42 | 0.79 | 0.12 | -0.45 | 0.24 | 14.68 | -9.78 | 2.91 |
| B213-G264 | 16.89 | 0.98 | 0.38 | -0.33 | 0.31 | 15.93 | -8.53 | 1.40 |
| B214-G265 | 17.64 | 0.87 | 0.11: | -0.52: | 0.39: | 16.43: | -8.03: | 2.72 |
| B215-G266 | 17.15: | 0.97 | 0.62: | -0.08: | 0.05: | 17.00: | -7.46: | 2.26 |
| SK083A | 19.43: | 1.16: | 0.03: | -0.81: | 0.97: | 16.42: | -8.04: | 2.02 |
| G268 | 16.51 | 0.96 | 0.42 | -0.27 | 0.23 | 15.80 | -8.66 | 3.65 |
| B217-G269 | 16.46 | 0.93 | 0.32 | -0.35 | 0.28 | 15.59 | -8.87 | 2.39 |
| B218-G272 | 14.65 | 0.90 | 0.34 | -0.31 | 0.21 | 14.00 | -10.46 | 3.19 |
| B219-G271 | 16.41 | 0.96 | 0.42 | -0.27 | 0.23 | 15.70 | -8.76 | 2.15 |
| B363-G274 | 17.82: | 0.73 | 0.07: | -0.46: | 0.19: | 17.23: | -7.23: | 1.83 |
| B220-G275 | 16.57 | 0.83 | 0.14 | -0.46 | 0.29 | 15.67 | -8.79 | 4.08 |
| B221-G276 | 16.78 | 0.96 | 0.34 | -0.35 | 0.31 | 15.82 | -8.64 | 2.37 |
| B224-G279 | 15.23 | 0.80 | 0.12 | -0.46 | 0.26 | 14.42 | -10.04 | 6.95 |
| B279-D068 | 18.45 | 1.08 | 0.51: | -0.27: | 0.35: | 17.36: | -7.10: | 5.03 |
| B225-G280 | 14.13 | 0.97 | 0.47 | -0.23 | 0.20 | 13.51 | -10.95 | 2.12 |
| B228-G281 | 16.78 | 1.02 | 0.38 | -0.38 | 0.40 | 15.54 | -8.92 | 2.84 |
| B229-G282 | 16.40 | 0.77 | 0.06 | -0.49 | 0.26 | 15.59 | -8.87 | 7.11 |
| B230-G283 | 15.99 | 0.75 | 0.11 | -0.43 | 0.18 | 15.43 | -9.03 | 2.08 |
| B365-G284 | 16.61 | 0.83 | 0.14 | -0.46 | 0.29 | 15.71 | -8.75 | 3.88 |
| B231-G285 | 17.28 | 0.89 | 0.21 | -0.43 | 0.32 | 16.29 | -8.17 | 1.93 |
| B232-G286 | 15.63 | 0.81 | 0.16 | -0.42 | 0.23 | 14.92 | -9.54 | 2.43 |
| B233-G287 | 15.82 | 0.86 | 0.21 | -0.41 | 0.27 | 14.98 | -9.48 | 2.64 |
| B281-G288 | 17.63: | 0.93 | 0.39: | -0.28: | 0.21: | 16.98: | -7.48: | 3.10 |
| B234-G290 | 16.82 | 0.96 | 0.41 | -0.28 | 0.24 | 16.08 | -8.38 | 2.48 |
| B366-G291 | 16.15: | 0.78 | 0.15 | -0.41 | 0.19 | 15.56: | -8.90: | 4.21 |
| B255D-D072 | 18.01: | 0.96 | 0.47: | -0.22: | 0.18: | 17.45: | -7.01: | 6.87 |
| B283-G296 | 17.79 | 0.98 | 0.40: | -0.31: | 0.29: | 16.89: | -7.57: | 3.44 |
| B235-G297 | 16.32 | 0.90 | 0.30 | -0.35 | 0.25 | 15.54 | -8.92 | 2.10 |
| B236-G298 | 17.35 | 0.77 | 0.22: | -0.33: | 0.10: | 17.04: | -7.42: | 2.40 |
| B237-G299 | 17.10 | 0.85 | 0.15 | -0.46 | 0.31 | 16.14 | -8.32 | 5.72 |
| B370-G300 | 16.17 | 0.93 | 0.24 | -0.43 | 0.36 | 15.05 | -9.41 | 2.74 |
| B238-G301 | 16.45 | 0.95 | 0.34 | -0.34 | 0.29 | 15.55 | -8.91 | 3.46 |
| B239-M74 | 17.19 | 0.89 | 0.37: | -0.27: | 0.16: | 16.69: | -7.77: | 2.17 |
| B240-G302 | 15.16 | 0.81 | 0.18 | -0.40 | 0.21 | 14.51 | -9.95 | 2.99 |
| B372-G304 | 16.53 | 0.88 | 0.20 | -0.43 | 0.31 | 15.57 | -8.89 | 3.46 |
| B373-G305 | 15.62 | 0.99 | 0.47 | -0.24 | 0.23 | 14.91 | -9.55 | 1.92 |
| SK104A | 17.89 | 0.98 | 0.32: | -0.39 | 0.37: | 16.74: | -7.72: | 1.56 |
| V129-BA4 | 16.98: | 0.82 | 0.19 | -0.40 | 0.22 | 16.30 | -8.16: | 2.36 |
| B375-G307 | 17.57 | 0.98 | 0.44: | -0.27: | 0.25: | 16.80: | -7.66: | 5.14 |
| B378-G311 | 17.60 | 0.77 | 0.12: | -0.43: | 0.20: | 16.98: | -7.48: | 3.10 |
| B382-G317 | 17.34 | 0.82 | 0.12 | -0.47 | 0.29 | 16.44 | -8.02 | 2.06 |
| B386-G322 | 15.56 | 0.88 | 0.33 | -0.30 | 0.18 | 15.00 | -9.46 | 2.29 |
| B327-MVI | 15.91 | 0.80 | 0.16 | -0.42 | 0.22 | 15.23 | -9.23 | 3.72 |
| B391-G328 | 17.19 | 0.88 | 0.25 | -0.38 | 0.26 | 16.38 | -8.08 | 2.71 |
| B393-G330 | 16.87 | 0.91 | 0.31 | -0.35 | 0.26 | 16.06 | -8.40 | 4.54 |
| SK109A | 19.14: | 0.78 | -0.21: | -0.77: | 0.55: | 17.44: | -7.02: | 4.44 |
| B397-G336 | 16.38 | 0.83 | 0.21 | -0.39 | 0.22 | 15.70 | -8.76 | 2.19 |
| B398-G341 | 17.51 | 0.96 | 0.58: | -0.11: | 0.07: | 17.29: | -7.17: | 3.08 |
| B399-G342 | 17.33 | 0.73 | 0.05 | -0.48 | 0.21 | 16.68 | -7.78 | 3.68 |
| B400-G343 | 16.43 | 0.87 | 0.26 | -0.37 | 0.24 | 15.69 | -8.77 | 2.00 |
| B401-G344 | 16.78 | 0.72 | 0.09 | -0.43 | 0.15 | 16.32 | -8.14 | 3.39 |
| B402-G346 | 17.28 | 0.91 | 0.26: | -0.40: | 0.31: | 16.32: | -8.14: | 3.24 |
| BA11 | 17.67 | 0.81 | 0.12: | -0.46: | 0.27: | 16.83: | -7.63: | 3.42 |
| B405-G351 | 15.12 | 0.81 | 0.20 | -0.38 | 0.19 | 14.53 | -9.93 | 3.83 |
| B407-G352 | 16.06 | 0.96 | 0.48 | -0.21 | 0.17 | 15.53 | -8.93 | 2.42 |
| Cluster ID | [Fe/H] | Q | |||
|---|---|---|---|---|---|
| N104 | -0.76 | -0.26 | -9.42 | 3.56 | 7.4 |
| N288 | -1.24 | -0.39 | -6.74 | 5.68 | 12.0 |
| N362 | -1.16 | -0.39 | -8.41 | 2.00 | 9.4 |
| N1261 | -1.35 | -0.39 | -7.81 | 3.58 | 18.2 |
| Pal 2 | -1.30 | -0.33 | -8.01 | 5.38 | 35.4 |
| N1851 | -1.22 | -0.38 | -8.33 | 1.83 | 16.7 |
| N1904 | -1.57 | -0.41 | -7.86 | 3.00 | 18.8 |
| N2298 | -1.85 | -0.37 | -6.30 | 2.43 | 15.7 |
| N2419 | -2.12 | -0.41 | -9.58 | 17.88 | 91.5 |
| N2808 | -1.15 | -0.38 | -9.39 | 2.12 | 11.1 |
| N3201 | -1.58 | -0.31 | -7.46 | 3.90 | 8.9 |
| N4147 | -1.83 | -0.31 | -6.16 | 2.41 | 21.3 |
| N4372 | -2.09 | -0.48 | -7.77 | 2.60 | 7.1 |
| N4590 | -2.06 | -0.41 | -7.35 | 2.74 | 10.1 |
| N4833 | -1.80 | -0.38 | -8.16 | 3.08 | 7.0 |
| N5024 | -1.99 | -0.37 | -8.70 | 5.75 | 18.3 |
| N5053 | -2.29 | -0.44 | -6.72 | 16.70 | 16.9 |
| N5139 | -1.62 | -0.37 | -10.29 | 6.44 | 6.4 |
| N5272 | -1.57 | -0.41 | -8.93 | 3.39 | 12.2 |
| N5286 | -1.67 | -0.35 | -8.61 | 2.21 | 8.4 |
| N5634 | -1.88 | -0.39 | -7.69 | 3.96 | 21.2 |
| N5694 | -1.86 | -0.42 | -7.81 | 3.33 | 29.1 |
| N5824 | -1.85 | -0.42 | -8.84 | 3.35 | 25.8 |
| N5897 | -1.80 | -0.45 | -7.21 | 7.61 | 7.3 |
| N5904 | -1.27 | -0.35 | -8.81 | 4.60 | 6.2 |
| N5927 | -0.37 | -0.09 | -7.80 | 2.54 | 4.5 |
| N5946 | -1.38 | -0.48 | -7.20 | 2.13 | 5.8 |
| N5986 | -1.58 | -0.35 | -8.44 | 3.18 | 4.8 |
| N6093 | -1.75 | -0.39 | -8.23 | 1.89 | 3.8 |
| N6121 | -1.20 | -0.31 | -7.20 | 2.34 | 5.9 |
| N6101 | -1.82 | -0.43 | -6.91 | 7.61 | 11.1 |
| N6144 | -1.75 | -0.34 | -6.75 | 4.01 | 2.6 |
| N6139 | -1.68 | -0.28 | -8.36 | 2.41 | 3.6 |
| N6171 | -1.04 | -0.10 | -7.13 | 5.03 | 3.3 |
| N6205 | -1.54 | -0.51 | -8.70 | 3.34 | 8.7 |
| N6229 | -1.43 | -0.53 | -8.05 | 3.27 | 29.7 |
| N6218 | -1.48 | -0.40 | -7.32 | 3.08 | 4.5 |
| N6235 | -1.40 | -0.32 | -6.44 | 2.79 | 4.1 |
| N6254 | -1.52 | -0.42 | -7.48 | 2.32 | 4.6 |
| N6256 | -0.70 | -0.19 | -6.52 | 2.08 | 1.8 |
| N6266 | -1.29 | -0.34 | -9.19 | 2.47 | 1.7 |
| N6273 | -1.68 | -0.39 | -9.18 | 3.13 | 1.6 |
| N6284 | -1.32 | -0.31 | -7.97 | 3.47 | 7.6 |
| N6287 | -2.05 | -0.34 | -7.36 | 2.03 | 2.1 |
| N6293 | -1.92 | -0.40 | -7.77 | 2.33 | 1.4 |
| N6304 | -0.59 | -0.12 | -7.32 | 2.46 | 2.2 |
| N6316 | -0.55 | -0.38 | -8.35 | 2.27 | 3.2 |
| N6341 | -2.28 | -0.44 | -8.20 | 2.60 | 9.6 |
| N6325 | -1.17 | -0.35 | -6.95 | 2.19 | 1.1 |
| N6333 | -1.75 | -0.38 | -7.94 | 2.18 | 1.7 |
| N6342 | -0.65 | -0.14 | -6.44 | 2.20 | 1.7 |
| N6356 | -0.50 | -0.18 | -8.52 | 3.27 | 7.6 |
| N6355 | -1.50 | -0.35 | -8.08 | 2.40 | 1.8 |
| N6352 | -0.70 | -0.12 | -6.48 | 3.32 | 3.3 |
| N6366 | -0.82 | -0.07 | -5.77 | 2.75 | 5.0 |
| N6362 | -0.95 | -0.32 | -6.94 | 4.82 | 5.1 |
| N6388 | -0.60 | -0.18 | -9.42 | 1.95 | 3.2 |
| N6402 | -1.39 | -0.33 | -9.12 | 3.49 | 4.1 |
| N6401 | -0.98 | -0.21 | -7.90 | 5.83 | 2.7 |
| N6397 | -1.95 | -0.41 | -6.63 | 1.56 | 6.0 |
| N6426 | -2.26 | -0.38 | -6.69 | 5.78 | 14.6 |
| Ter 5 | 0.00 | +0.14 | -7.87 | 2.49 | 2.4 |
| N6440 | -0.34 | +0.05 | -8.75 | 1.42 | 1.3 |
| N6441 | -0.53 | -0.10 | -9.64 | 2.18 | 3.9 |
| N6453 | -1.53 | -0.26 | -6.88 | 1.03 | 1.8 |
| N6496 | -0.64 | -0.26 | -7.23 | 6.26 | 4.3 |
| N6517 | -1.37 | -0.41 | -8.28 | 1.95 | 4.3 |
| N6522 | -1.44 | -0.22 | -7.67 | 2.36 | 0.6 |
| N6535 | -1.80 | -0.39 | -4.75 | 2.67 | 3.9 |
| N6528 | -0.04 | -0.01 | -6.56 | 0.99 | 0.6 |
| N6539 | -0.66 | -0.31 | -8.30 | 4.08 | 3.1 |
| N6544 | -1.56 | -0.32 | -6.66 | 1.39 | 5.3 |
| N6541 | -1.83 | -0.42 | -8.37 | 2.42 | 2.2 |
| N6553 | -0.21 | +0.09 | -7.77 | 2.71 | 2.2 |
| N6558 | -1.44 | -0.22 | -6.46 | 3.47 | 1.0 |
| I1276 | -0.73 | -0.24 | -6.67 | 3.69 | 3.7 |
| N6569 | -0.86 | -0.22 | -8.30 | 4.14 | 2.9 |
| N6584 | -1.49 | -0.38 | -7.68 | 3.12 | 7.0 |
| N6624 | -0.44 | -0.20 | -7.49 | 1.88 | 1.2 |
| N6626 | -1.45 | -0.32 | -8.18 | 2.54 | 7.7 |
| N6638 | -0.99 | -0.27 | -7.13 | 1.84 | 2.3 |
| N6637 | -0.70 | -0.25 | -7.64 | 2.20 | 1.9 |
| N6642 | -1.35 | -0.23 | -6.77 | 1.78 | 1.7 |
| N6652 | -0.96 | -0.31 | -6.68 | 1.91 | 2.8 |
| N6656 | -1.64 | -0.43 | -8.50 | 3.03 | 4.9 |
| Pal 8 | -0.48 | -0.16 | -5.52 | 2.14 | 5.6 |
| N6681 | -1.51 | -0.40 | -7.11 | 2.43 | 2.1 |
| N6712 | -1.01 | -0.31 | -7.50 | 2.75 | 3.5 |
| N6715 | -1.58 | -0.37 | -10.01 | 3.82 | 19.2 |
| N6717 | -1.29 | -0.37 | -5.66 | 1.40 | 2.4 |
| N6723 | -1.12 | -0.33 | -7.84 | 4.07 | 2.6 |
| N6749 | -1.60 | -0.74 | -6.70 | 2.53 | 5.0 |
| N6752 | -1.56 | -0.41 | -7.73 | 2.72 | 5.2 |
| N6760 | -0.52 | -0.11 | -7.86 | 4.69 | 4.8 |
| N6779 | -1.94 | -0.47 | -7.38 | 3.41 | 9.7 |
| N6809 | -1.81 | -0.41 | -7.55 | 4.46 | 3.9 |
| N6838 | -0.73 | -0.15 | -5.60 | 1.92 | 6.7 |
| N6864 | -1.16 | -0.35 | -8.55 | 2.83 | 14.6 |
| N6934 | -1.54 | -0.35 | -7.46 | 2.74 | 12.8 |
| N6981 | -1.40 | -0.38 | -7.04 | 4.35 | 12.9 |
| N7006 | -1.63 | -0.48 | -7.68 | 4.59 | 38.8 |
| N7078 | -2.26 | -0.43 | -9.17 | 3.18 | 10.4 |
| N7089 | -1.62 | -0.39 | -9.02 | 3.11 | 10.4 |
| N7099 | -2.12 | -0.40 | -7.43 | 2.68 | 7.1 |
| Pal 12 | -0.94 | -0.43 | -4.48 | 7.11 | 15.9 |
| Pal 13 | -1.74 | -0.66 | -3.74 | 3.45 | 26.7 |
| N7492 | -1.51 | -0.07 | -5.77 | 9.16 | 24.9 |
| Andromeda | Milky Way | |||
|---|---|---|---|---|
| n | n | |||
| (pc) | (pc) | |||
| -10.00 | 2.9 | 16 | … | 2 |
| -9.00 to -9.99 | 2.4 | 35 | 3.1 | 10 |
| -8.00 to -8.99 | 2.7 | 88 | 2.9 | 26 |
| -7.00 to -7.99 | 2.9 | 45 | 2.7 | 39 |
| -6.00 to -6.99 | 3.2 | 15 | 2.4 | 21 |
| -6.00 | … | 0 | 2.4: | 7 |
| [Fe/H] | |
|---|---|
| 0.00 to -0.49 | 0.23 0.07 |
| -0.50 to -0.99 | 0.22 0.02 |
| -1.00 to -1.49 | 0.34 0.02 |
| -1.50 to -1.99 | 0.39 0.01 |
| -2.00 to -2.49 | 0.39 0.02 |
| Name | |
|---|---|
| Fornax 1 | 11.8 pc |
| Fornax 2 | 8.2 |
| Fornax 3 | 4.4 |
| Fornax 4 | 3.5 |
| Fornax 5 | 4.4 |
| NGC 5053 | 16.7 |
| NGC 5634 | 4.0 |
| NGC 6715 | 3.8 |
| Arp 2 | 15.9 |
| Palomar 12 | 7.1 |
| Terzan 7 | 6.6 |
| Terzan 8 | 7.6 |