A Sample of [C ii] Clouds Tracing Dense Clouds in Weak FUV Fields observed by Herschel††thanks: Herschel is an ESA space observatory with science instruments provided by European-led Principal Investigator consortia and with important participation from NASA.
The [C ii] fine–structure line at 158 m is an excellent tracer of the warm diffuse gas in the ISM and the interfaces between molecular clouds and their surrounding atomic and ionized envelopes. Here we present the initial results from Galactic Observations of Terahertz C+ (GOT C+), a Herschel Key Project devoted to study the [C ii] fine structure emission in the galactic plane using the HIFI instrument. We use the [C ii] emission together with observations of CO as a probe to understand the effects of newly–formed stars on their interstellar environment and characterize the physical and chemical state of the star-forming gas. We collected data along 16 lines–of–sight passing near star forming regions in the inner Galaxy near longitudes 330°and 20°. We identify fifty-eight [C ii] components that are associated with high–column density molecular clouds as traced by 13CO emission. We combine [C ii], 12CO, and 13CO observations to derive the physical conditions of the [C ii]–emitting regions in our sample of high–column density clouds based on comparison with results from a grid of Photon Dominated Region (PDR) models. From this unbiased sample, our results suggest that most of [C ii] emission originates from clouds with H2 volume densities between and cm-3 and weak FUV strength (). We find two regions where our analysis suggests high densities cm-3 and strong FUV fields (), likely associated with massive star formation. We suggest that [C ii] emission in conjunction with CO isotopes is a good tool to differentiate between regions of massive star formation (high densities/strong FUV fields) and regions that are distant from massive stars (lower densities/weaker FUV fields) along the line–of–sight.
Key Words.:
ISM: atoms —ISM: molecules — ISM: structure1 Introduction
The study of the processes governing the formation and destruction of molecular clouds is critical for our understanding of how galaxies have evolved in our Universe. In terms of column and local volume densities only two extreme states of cloud evolution have been systematically observed: diffuse atomic clouds traced by the 21 cm line of H i (e.g. Kalberla & Kerp 2009) and dense molecular clouds traced by rotational transitions of CO (e.g. Dame et al. 2001). We know, however, very little about the intermediate phases of cloud evolution and the interface between diffuse and dense molecular gas.
Galactic Observations of Terahertz C+ (GOT C+), a Herschel Key Project, is devoted to study the [C ii] emission in different environments in our Galaxy. The survey will observe the [C ii] 158 m line over a volume weighted sampling of 500 lines–of–sight (LOS). Upon completion, it will provide a database of a few thousand [C ii]–emitting clouds distributed over the entire Galactic plane.
The [C ii] fine structure line at 158 m is an excellent tracer of the interface between diffuse and dense molecular gas. The densities and temperatures in this interface allow effective collisional excitation of this line. The H i and volume densities are a significant fraction of, or comparable to, the critical densities for collisional excitation111Electrons are a possibly significant collision partner of C+. However, the critical electron density for these particles to produce significant [C ii] emission is 9.2 cm-3 at K. The density in diffuse regions where the abundance relative to H is is modest ( cm-3), while in the denser regions the ionization is significantly lower. In either case, the excitation by electrons is negligible. (3.3 and 7.1 cm-3 at K, respectively), the kinetic temperatures are 100 K, and the formation of CO is inhibited by limited shielding against far-ultraviolet (FUV) photons and therefore most of the gas-phase carbon is in C+ and some C0.
Here we present the first results on the molecular cloud-atomic cloud interface from the GOT C+ project. During the Herschel Priority Science and Performance Verification phase, we have collected data along 5 LOSs near ° and 9 LOSs near ° (Velusamy et al. 2010). The focus of this letter is to study [C ii] components towards clouds that have sufficient column density to have significant 13CO emission. Such regions can be considered as dense Photon–Dominated Regions ( or photodissociation regions, or PDRs). PDRs are regions where the chemistry and thermal balance is dominated by the effects of FUV photons from young stars (Hollenbach & Tielens 1999, and references therein). These data are therefore important for the study of the stellar feedback of newly formed massive stars in their progenitor molecular cloud. We combine the [C ii] data with observations of 12CO and 13CO from the ATNF Mopra 22-m telescope to study 58 high–column density PDRs. We use the [C ii]/12CO and [C ii]/13CO integrated intensity ratios to constrain physical conditions of the line–emitting gas comparing with a grid of PDR models.
The Galactic plane has been studied in [C ii] with low velocity and spatial resolution observations with COBE (Bennett et al. 1994) and BICE (Nakagawa et al. 1998). The high angular (12″) and velocity (0.2 km s-1) resolution of the Herschel/HIFI observations allow us to study for the first time the rich structure of molecular clouds along the line-of-sight towards the galactic plane. The Kuiper Airborne Observatory allowed the study of a handful of H ii regions with velocity resolved [C ii] observations (e.g. Boreiko et al. 1988; Boreiko & Betz 1991). However, they were limited to massive star-forming regions with dense and hot PDRs. The sensitivity of our observations allow us to study for the first time the population of PDRs in our galaxy that are exposed to weaker FUV radiation fields.
2 Observations
2.1 Herschel Observations
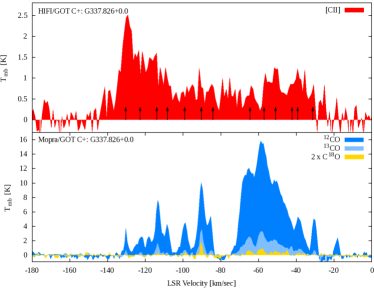
We observed the [C ii] 2PP1/2 line at 1900.5469 GHz towards 16 LOSs in the Galactic plane with the HIFI (de Graauw et al. 2010) instrument on board the Herschel space observatory (Pilbratt et al. 2010). We refer to Velusamy et al. (2010) for more details about the [C ii] observations. In Figure 1 we show sample LOS spectra of [C ii], 12CO, 13CO, and C18O.
2.2 Mopra Observations
We observed the transitions of 12CO, 13CO, and C18O toward the observed [C ii] LOSs. These observations are part of a survey of all GOT C+ positions towards the inner Galaxy between °and °conducted at the ATNF Mopra Telescope. The angular resolution of these observations is 33″. Typical system temperatures were 600, 300, and 250 K for 12CO, 13CO, and C18O, respectively. To convert from antenna to main–beam temperature scale we use a main-beam efficiency of 0.42 (Ladd et al. 2005). All lines were observed simultaneously using the MOPS spectrometer in zoom mode. The spectra were smoothed in velocity to 0.8 km s-1 for 12CO and 13CO and to 1.6 km s-1 for C18O. Typical rms noise is 0.6 K for 12CO and 0.1 K for both 13CO and C18O. We checked pointing accuracy every 60 minutes using the closest and brightest SiO maser.
3 [C ii] components associated with molecular clouds
We identify a total of 146 [C ii] velocity components in the observed LOSs. From this data set we identify components that are associated with high–column density molecular gas by looking for 13CO counterparts. We identified most of the high–13CO column density [C ii] components by fitting Gaussian functions defined by fitting the corresponding 13CO spectra. The only exception was G337.826+0.0 for which we calculated the integrated intensity by determining the area within the FHWM of the 13CO emission, as this line–of–sight shows complex velocity structure. Based on the 13CO line parameters we identify 58 [C ii] components associated with dense molecular gas. All of them also show 12CO emission while 12 show C18O emission. The remaining diffuse atomic and/or diffuse molecular [C ii]–emitting clouds that do not have 13CO counterparts are discussed by Langer et al. (2010) and Velusamy et al. (2010).
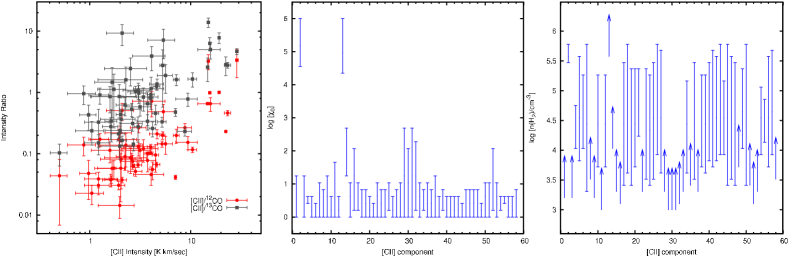
In the left panel of Figure 2, we summarize the observed characteristics by plotting the [C ii]/12CO and [C ii]/13CO integrated intensity ratios for the identified components as a function of the [C ii] integrated intensity. The ratios are calculated from integrated intensities in units of K km s-1. The mean value and standard deviation are 0.29 and 0.6 for the [C ii]/12CO integrated intensity ratio and 1.75 and 2.54 for [C ii]/13CO. The ratios vary over 2 orders of magnitude suggesting a wide range of physical conditions in our sample.
We use the [C ii]/12CO and [C ii]/13CO integrated intensity ratios to constrain the physical conditions of the line–emitting gas. The 12CO emission, which becomes optically thick quickly after a modest fraction of the gas–phase carbon is converted to CO, is not very sensitive to the FUV radiation field, as the temperature at the C+/C0/CO transition layer is also insensitive to this quantity (Wolfire et al. 1989; Kaufman et al. 1999). Therefore, the [C ii]/12CO ratio is determined by the column density of C+ and the temperature at the surface of the PDR, which are in turn dependent on the FUV radiation field and H2 density. The [C ii]/13CO ratio is proportional to the ratio between the C+ and 13CO column densities. It therefore gives, provided that extra constraints on the total column of material are available and that there are no significant variations of the FUV field within the beam, a constraint on the location of the C+/C0/CO transition layer which in turn depends on the strength of the FUV field and H2 density.
4 Comparison with PDR model calculations
We compare the observed [C ii]/12CO and [C ii]/13CO integrated intensity ratios with the results of a PDR model grid in order to constrain physical conditions of the [C ii]–emitting clouds.
The model grid was calculated using the KOSMA– PDR model (Störzer et al. 1996; Röllig et al. 2006) which is available online222http://hera.ph1.uni-koeln.de/pdr/ . The model provides a self–consistent solution of the chemistry and thermal balance of a spherical cloud, with a truncated density profile, which is illuminated isotropically by a FUV radiation field. The density distribution has the form, = for 0.2 and a constant density of (0.2)-1.5 in the central region of the cloud (). Here is the cloud radius and is the density at the cloud surface. Note that with a power–law index of 1.5, the average density of the clump is about twice the density at the cloud surface. The line intensities are calculated using a non–LTE radiative transfer code by Gierens et al. (1992). Each model is characterized by the clump mass, the density at the cloud surface, and strength of the FUV field. The clump mass ranges from to M⊙, the density at the cloud surface from 103 to 106 cm-3, and the strength of the FUV field from to 106 (in units of the Draine 1978 field333 The average FUV intensity of the local ISM is 2.2 erg cm-2 s-1 sr-1 (Draine 1978). Note that the Draine field is isotropic (i.e. a given point is illuminated from 4 steradians) while the surface of the clouds considered here are only illuminated from 2 steradians. Therefore the rate of photoreactions at the cloud surface are half of what they would be with the Draine field in free space. ). We do not use H i and C18O observations to constrain our solutions as model grids involving their emission are not available.
By using a spherically symmetric model we assume that the cloud spatial structure can be described by an ensemble of clumps with sizes much smaller than the resolution of our observations. Additionally, we assume that each clump in this ensemble has the same mass and density, and that the [C ii]/12CO and [C ii]/13CO line ratios can be estimated using the line ratios of a single clump of that mass and density. Therefore, the comparison with the PDR model grid provides the typical incident FUV field, mass, and density of the regions that dominate the observed line ratios. An even more realistic model considers clumps following the distribution of masses and sizes observed in many molecular clouds (e.g. Zielinsky et al. 2000; Cubick et al. 2008).
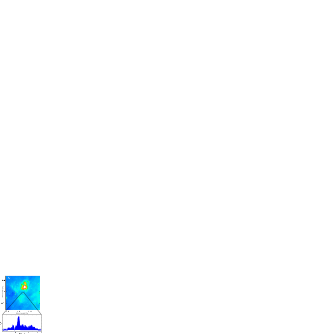
The central and right panels in Figure 2 show a summary of the constrained H2 volume densities and FUV radiation fields for our sample. We consider models with chi-squared smaller than 1.1. We find two [C ii] components with high volume densities ( cm-3) and strong FUV fields (between ). Both regions are characterized by [C ii]/CO integrated intensity ratios that are larger than 1 (c.f. Orion has a [C ii]/12CO ratio of 1.36; Crawford et al. 1985). We show an image and [C ii] spectrum of one such source in Figure 3. The remaining components have lower volume densities between cm-3. Six of those could have a strength of FUV field as high as 100 while the majority (51 components) have FUV fields between 1 and 10. For all components the comparison with the PDR model grid suggests clump masses that are larger than 1 M⊙. Note that due to the limited spatial coverage of the observations presented here, the distribution of physical conditions is not smooth. We will obtain a much better sampling of the distribution of physical conditions in velocity components distributed over the entire galactic plane with the completed GOT C+ survey.
The large number of components with low–FUV field is a result of the low observed [C ii]/12CO ratios of about 0.1. Such values of the [C ii]/12CO ratio are expected for over a large range of H2 volume densities (see e.g. Figure 9 in Kaufman et al. 1999). The [C ii]/13CO ratio provides an additional constraint on the FUV field. The majority of the observed components have small ratios that suggest a large column density of 13CO relative to that of C+. This result is suggestive of a C+/C0/CO transition occurring close to the surface of the cloud which is a result of either high densities or weak FUV fields. Note, however, that using [C ii] and 13CO to constrain the location of the C+/C0/CO transition requires extra constraints on the total column density of material thoughout the clump which in turns depends on the assumed clump surface density and mass. These two quantities are not well constrained in the analysis presented here. Additionally, it requires that there are no significant variations of the FUV field within the beam as shielded clumps might contribute significantly to the 13CO emission but little to that of [C ii]. The H2 volume density for individual velocity components can be better determined using observations of the 609m and 370m transitions of neutral carbon, which have been used to constrain the temperature and density at the C+/C0/CO transition region in PDRs (e.g. Stutzki et al. 1997). The [C ii] to bolometric infrared flux is also useful to constrain the FUV field (Wolfire et al. 1989; Kaufman et al. 1999) but is only useful towards LOSs with a single velocity component.
5 Discussion
We have found that most of the [C ii] velocity components considered here are associated with regions that are exposed to weak FUV radiation field () and therefore are away from OB associations. PDRs exposed to weak FUV radiation fields have been studied in a few sources using [C i] emission (e.g. Maezawa et al. 1999; Bensch 2006; Pineda & Bensch 2007) but never observed with velocity–resolved [C ii] before Herschel/HIFI.
Cubick et al. (2008) suggested that most of the [C ii] in our Galaxy originates from a clumpy medium exposed to a FUV field of , which is larger than the upper limit determined for the majority of the observed components. Note, however, that their model does not consider emission arising from diffuse clouds. From our observed LOSs, we find that about 56% of the total detected [C ii] emission arises from low–column density regions (without significant 13CO emission; Langer et al. 2010; Velusamy et al. 2010) while 44% is emitted from dense PDRs. Nevertheless, the moderate FUV field predicted by Cubick et al. (2008) might suggest that the predominance of low–FUV radiation field regions observed in our limited sample (covering less than 2% of the entire GOT C+ survey) might hold for the entire Galaxy.
We found two regions where our analysis suggests high densities ( cm-3) and strong FUV fields (between and ). These regions are likely associated with massive star formation. This conclusion is a result of the elevated [C ii]/CO ratio observed towards these regions. This identification suggests that the [C ii]/CO ratio is good tracer of the location of massive star formation regions in the galaxy. [C ii] observations will therefore provide an alternative method to determine the distribution of massive star forming regions in the galaxy (e.g. Bronfman et al. 2000). Note that velocity resolved observations are crucial for the interpretation of the [C ii]/CO ratio. In our observed LOSs we have found velocity components showing [C ii] emission but no CO as well as components showing CO but no [C ii]. Velocity unresolved observations would have given a distorted value of the [C ii]/CO ratio that would result in an incorrect interpretation of the physical conditions of the line–emitting gas.
6 Conclusions
We have presented velocity–resolved observations of [C ii] towards 16 LOSs located near ° and ° in the Galactic plane using the HIFI instrument on board the Herschel space observatory. We identified a total of 146 different [C ii] velocity components. In this letter we analyzed a sample of 58 components that are associated with high–column density molecular gas as traced by 13CO emission. These components contribute 44% of the total observed [C ii] emission implying a significantly larger amount of [C ii] emission originating in the diffuse ISM than from star forming environments. We have compared the [C ii]/12CO and [C ii]/13CO integrated intensity ratios with a PDR model grid to constrain the strength of the FUV field and the H2 volume density in this sample. We find two clouds for which our analysis suggests high densities ( cm-3) and strong FUV fields (), likely associated with massive star formation. The majority of the observed components, however, have modest densities ( cm-3) and weaker FUV fields (). Although the population of clouds with these conditions is likely where most of the [C ii] emission originates in our Galaxy, their properties are largely unexplored. The GOT C+ survey will provide a few thousand clouds distributed in the Galactic plane and therefore will allow us to characterize this population of intermediate clouds.
Acknowledgements.
We would like to thank the referee David Hollenbach for his comments and suggestions that significantly improved this letter. This work was performed by the Jet Propulsion Laboratory, California Institute of Technology, under contract with the National Aeronautics and Space Administration. We thank the staffs of the ESA and NASA Herschel Science Centers for their help. The Mopra Telescope is managed by the Australia Telescope, which is funded by the Commonwealth of Australia for operation as a National Facility by the CSIRO.References
- Bennett et al. (1994) Bennett, C. L., Fixsen, D. J., Hinshaw, G., et al. 1994, ApJ, 434, 587
- Bensch (2006) Bensch, F. 2006, A&A, 448, 1043
- Boreiko & Betz (1991) Boreiko, R. T. & Betz, A. L. 1991, ApJ, 380, L27
- Boreiko et al. (1988) Boreiko, R. T., Betz, A. L., & Zmuidzinas, J. 1988, ApJ, 325, L47
- Bronfman et al. (2000) Bronfman, L., Casassus, S., May, J., & Nyman, L. 2000, A&A, 358, 521
- Crawford et al. (1985) Crawford, M. K., Genzel, R., Townes, C. H., & Watson, D. M. 1985, ApJ, 291, 755
- Cubick et al. (2008) Cubick, M., Stutzki, J., Ossenkopf, V., Kramer, C., & Röllig, M. 2008, A&A, 488, 623
- Dame et al. (2001) Dame, T. M., Hartmann, D., & Thaddeus, P. 2001, ApJ, 547, 792
- de Graauw et al. (2010) de Graauw, T., Helmich, F. P., Phillips, T. G., et al. 2010, A&A, 518, L6+
- Draine (1978) Draine, B. T. 1978, ApJS, 36, 595
- Gierens et al. (1992) Gierens, K. M., Stutzki, J., & Winnewisser, G. 1992, A&A, 259, 271
- Hollenbach & Tielens (1999) Hollenbach, D. J. & Tielens, A. G. G. M. 1999, Reviews of Modern Physics, 71, 173
- Kalberla & Kerp (2009) Kalberla, P. M. W. & Kerp, J. 2009, ARA&A, 47, 27
- Kaufman et al. (1999) Kaufman, M. J., Wolfire, M. G., Hollenbach, D. J., & Luhman, M. L. 1999, ApJ, 527, 795
- Ladd et al. (2005) Ladd, N., Purcell, C., Wong, T., & Robertson, S. 2005, PASA, 22, 62
- Langer et al. (2010) Langer, W. D., Velusamy, T., Pineda, J. L., et al. 2010, ArXiv:1007.3048
- Maezawa et al. (1999) Maezawa, H., Ikeda, M., Ito, T., et al. 1999, ApJ, 524, L129
- Nakagawa et al. (1998) Nakagawa, T., Yui, Y. Y., Doi, Y., et al. 1998, ApJS, 115, 259
- Pilbratt et al. (2010) Pilbratt, G. L., Riedinger, J. R., Passvogel, T., et al. 2010, A&A, 518, L1+
- Pineda & Bensch (2007) Pineda, J. L. & Bensch, F. 2007, A&A, 470, 615
- Röllig et al. (2006) Röllig, M., Ossenkopf, V., Jeyakumar, S., Stutzki, J., & Sternberg, A. 2006, A&A, 451, 917
- Störzer et al. (1996) Störzer, H., Stutzki, J., & Sternberg, A. 1996, A&A, 310, 592
- Stutzki et al. (1997) Stutzki, J., Graf, U. U., Haas, S., et al. 1997, ApJ, 477, L33+
- Velusamy et al. (2010) Velusamy, T., Langer, W. D., Pineda, J. L., et al. 2010, ArXiv:1007.3338
- Wolfire et al. (1989) Wolfire, M. G., Hollenbach, D., & Tielens, A. G. G. M. 1989, ApJ, 344, 770
- Zielinsky et al. (2000) Zielinsky, M., Stutzki, J., & Störzer, H. 2000, A&A, 358, 723