Close Binaries with Infrared Excess: Destroyers of Worlds?
Abstract
We present the results of a Spitzer photometric investigation into the IR excesses of close binary systems. In a sample of 10 objects, excesses in IRAC and MIPS24 bands implying the presence of warm dust are found for 3. For 2 objects we do not find excesses reported in earlier IRAS studies. We discuss the results in the context of the scenario suggested by Rhee and co-workers, in which warm dust is continuously created by destructive collisions between planetary bodies. A simple numerical model for the steady-state distribution of dust in one IR excess system shows a central clearing of radius 0.22 AU caused by dynamical perturbations from the binary star. This is consistent with the size of the central clearing derived from the Spitzer spectral energy distribution. We conclude that close binaries could be efficient “destroyers of worlds”, lead to destabilize the orbits of their planetary progeny by magnetically-driven angular momentum loss and secular shrinkage of the binary separation.
1 Introduction
Perhaps the most spectacular discovery of the Infrared Astronomical Satellite (IRAS) was the detection around a small handful of normal main-sequence stars of excess infrared (IR) radiation from remnant disks now understood to represent debris related to planet formation (e.g. Aumann et al. 1984). These disks are largely dissipated in in a few hundred Myr by collisional degradation of larger bodies combined with Poynting-Robertson (PR) and stellar wind drag, radiation pressure and evaporation (Aumann et al., 1984). Recent Spitzer surveys at 70 m find a disk fraction of % for F, G and K stars with ages up to 3 Gyr or so (Bryden et al., 2006; Hillenbrand et al., 2008).
One other group of stars with IR excesses has remained inconspicuous. The RS CVn class of tidally-interacting close binaries, in which at least one component has generally reached the sub-giant evolutionary phase (Hall, 1976), were discovered by IRAS to have an IR excess occurrence rate of about 40% —twice as high as main-sequence stars and 3–4 times higher than giants (Busso et al. 1987, 1988; Scaltriti et al. 1993, and references therein). The observed excesses typically amounted to several percent of the stellar bolometric luminosity and corresponded to a blackbody temperature of order 1500 K. Within current scenarios explaining IR excesses around late type stars, RS CVns should not have any: they represent a significantly older population than the few 100 Myr dusty disk lifetime (e.g. Eker, 1992), and have not undergone any evolutionary phase during which substantial mass loss and dust formation is expected. Despite this puzzle, the IR excess RS CVns have received scant attention since their initial discovery.
More recently, Weinberger (2008) found BD +20 307, “the dustiest known main-sequence star” (Zuckerman et al., 2008), to be a close spectroscopic binary with a period of 3.4 days and estimated its age to be greater than 1 Gyr. The parallel between the 3.4 day binary BD +20 307 and the IR excess RS CVns—spectroscopic binaries with periods of a few days—is striking. The dust emission of BD +20 307 amounts to an unusually large 4% of its bolometric luminosity, and has an unusually high temperature of K (Song et al., 2005). Song et al. (2005), Rhee et al. (2008), and Zuckerman et al. (2008) suggest the warm dust in BD +20 307 likely arises from recent pulverising collisions between planets or planetesimals. That such close binaries can harbor planetary systems has been demonstrated by the planet around HW Vir (Lee et al. 2009).
Here we present a Spitzer photometric survey of a small sample of 10 RS CVns to probe deeper into the purported IR excesses of this class.
2 Observations and Data Analysis
The data presented in this paper were obtained by the Spitzer Space Telescope (Werner et al., 2004; Gehrz et al., 2007) as part of the General Observing program PID 20713. Infrared Array Camera (IRAC; Fazio et al. 2004) observations were made in High Dynamic Range mode between 2005 Jul and Dec. Targets were observed in 3.6, 4.5, 5.8 and 8.0 m bands for 12s in each position of a 12 point Reuleaux pattern dither map, for a total effective integration time of 124.8s. Multiband Imaging Photometer (MIPS; Rieke et al. 2004) observations were obtained in the 24, 70 and 160 m bands in photometry mode between 2005 Nov and 2007 Jan, with an exposure time of 10s, repeated for 2 cycles (24m) or 3 cycles (70 and 160 m). Reduced image mosaics were produced with the IRACproc custom software (Schuster et al., 2006), while for MIPS we used the Spitzer Science Center pipeline mosaics. These were analysed using standard aperture (MIPS) and Point spread Function (PSF) based (IRAC) photometry, the latter adopting the procedure described in Marengo et al. (2009), that enable deriving the flux of core-saturated sources. All photometry results are reported in Table 1.
Only one source (UX Ari) was detected at at . For two other sources (CF Tuc and II Peg) we found level signals. For all other sources we report upper limits. The well known MIPS 160 micron near-IR spectral leak prevented us from using data taken in this band.
Our analysis procedure was similar to that followed by Busso et al. (1987, 1988); Scaltriti et al. (1993) and involved comparison of stellar model fluxes, fitted to observed optical and near-IR photometry, with the Spitzer IR photometry. For each binary listed in Table 1, we modelled BVRIJHK photometry culled from literature with a spectral energy distribution (SED) model comprising the sum of two Kurucz photospheric models111http://wwwuser.oat.ts.astro.it/castelli/grids.html (one for each stellar component in the case of double-lined spectroscopic binaries, weighted by stellar radius and effective temperature according to ). Since surface spots resulting from magnetic activity on RS CVns can give rise to detectable secular photometric changes (thus leading to some having been designated as variables), we adopted photometric uncertainties that generally encompassed observed ranges of variations for each star. For dwarfs stars, we adopted the effective temperature–radius relation of Gray (1992) with initial values for effective temperature from the literature; for more evolved components we culled values for temperature, radius and/or mass and surface gravity from the literature. Final radius and effective temperature model parameters for each system were honed by exploring the grid of Kurucz models using a minimisation.
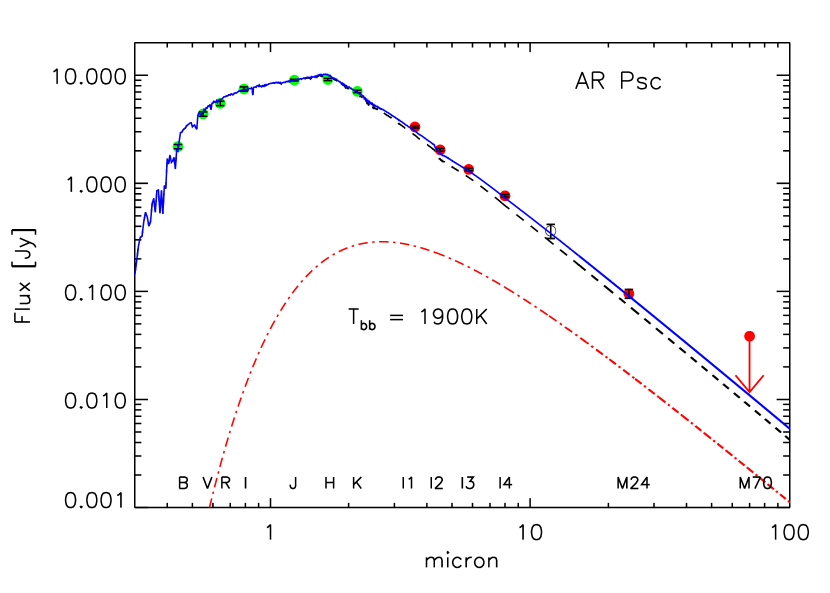
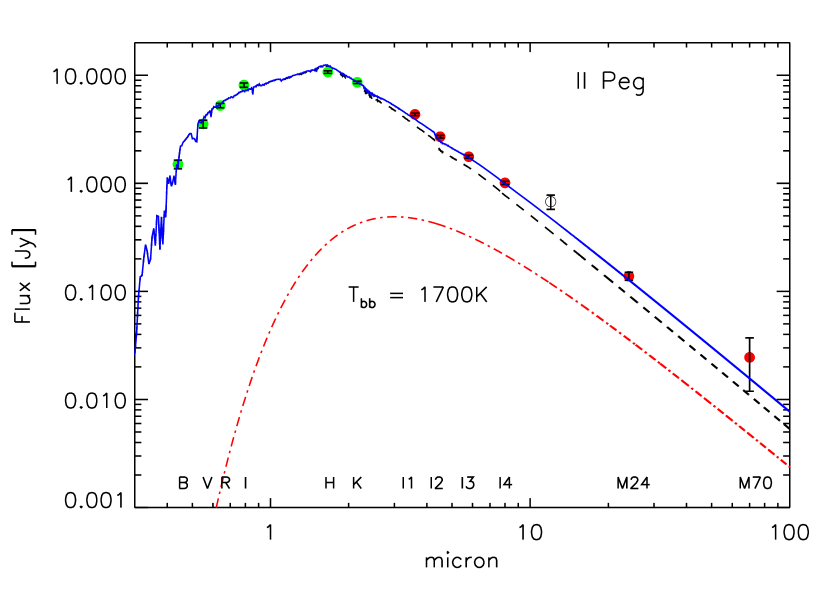
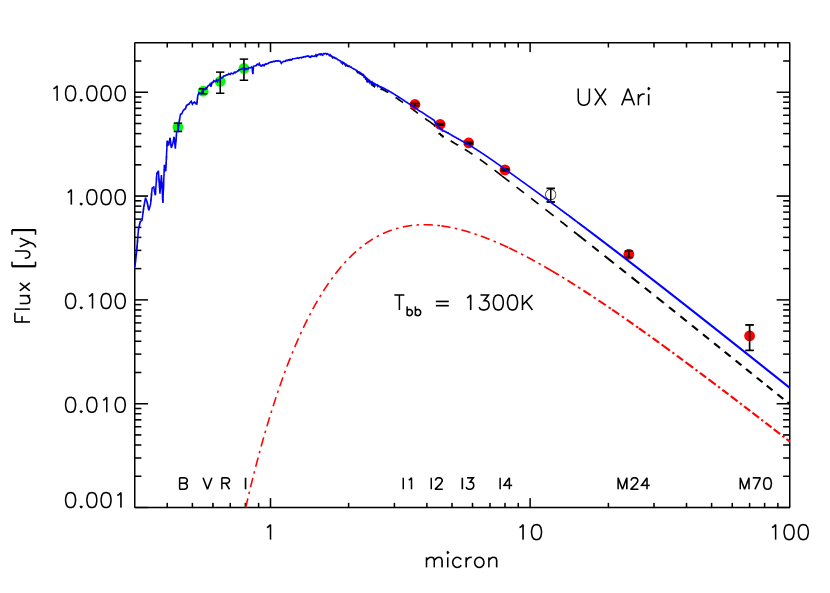
Final stellar parameters are listed in Table 2. Comparison of adopted Kurucz models with Spitzer photometry revealed satisfactory fits for all but the three sources: AR Psc, II Peg and UX Ari. For these systems, no combination of Kurucz photospheres could reproduce the measured IRAC and MIPS fluxes: in all three cases, the observed IR fluxes were too high compared to the predicted model fluxes. Including a blackbody as an additional component, fitting the temperature and normalization as free parameters (see Table 2), greatly improved the SED model fits. Results are illustrated in Figure 1), together with IRAS Faint Source Catalog v2.0 fluxes222http://irsa.ipac.caltech.edu. In agreement with earlier studies (e.g., Scaltriti et al. (1993)), the best-fit blackbody temperatures lie in the range 1300-1900 K with an uncertainty of 200–300 K. The low-level 70 emission in II Peg is consistent with the long wavelength tail of the hot blackbody excess, while that for UX ARI hints at the possible presence of additional cold dust. For other binaries that do not show a detectable IR excess, we have estimated upper limits. Assuming a nominal blackbody temperature of 1500 K, we find that for these systems the blackbody luminosity must be less than % of the bolometric luminosity (see Table 1).
To estimate more realistic dust temperatures, non-blackbody circumstellar dust with an emissivity law of the type , where corresponds approximately to the grain size and is a parameter of order unity, depending on grain type, as described by, e.g., Backman & Paresce (1993) were used. In general, fits using a grain emissivity law (Table 2) required lower temperatures. For both II Peg and AR Psc, the best-fit values of and are m and 1 respectively, whereas for UX Ari these parameters were not well-constrained by the data.
We note two systems in Table 1 for which we find no significant excess at levels below earlier IRAS-based detections; either the earlier detections were spurious, or the excesses have waned in the intervening years.
3 Discussion
The span from 3.6–24 m covered by our Spitzer IRAC and MIPS photometry is very effective for diagnosing the presence of warm and even hot dust. The requirement for a purely stellar SED is that the IR photometric indices lie along the Rayleigh-Jeans tail of the photospheric IR (essentially blackbody) continuum. The SEDs illustrated in Figure 1 fail to do this in the sense that the observed slope is incorrect: the departure from stellar SEDs increases toward longer wavelengths. From the blackbody fits, we have determined the fraction of the stellar bolometric luminosities reprocessed into IR emission and list these in Table 1: we find values ranging from 0.7 to 1.9%.
Our detection of IR excess in the spectrum of II Peg confirms the earlier photometric detection by Busso et al. (1987, see also ) and the preliminary ISOPHOT spectrum obtained by Rodono et al. (1998). Of our other two detections, UX Ari was found to have a substantial near-IR excess in photometry by Verma et al. (1983) but was not found to have a significant excess in IRAS photometry by Busso et al. (1988). AR Psc instead represents a new IR excess detection.
As noted by Scaltriti et al. (1993), the observed IR excesses cannot be fitted with a standard free-free emission spectrum from, e.g., an ionized wind, whose frequency dependence (e.g. Wright & Barlow, 1975) is much too flat. Moreover, the observed fluxes would imply mass loss rates of order yr-1—orders of magnitude higher than expected for these stars. Busso et al. (1987, 1988) and Scaltriti et al. (1993) interpreted the observed excesses in terms of dust shells. While the implied dust temperatures are high in the context of dust in debris disks, we emphasise that unresolved low-mass stars or brown dwarfs cannot explain the excesses because typical luminosities of these objects for the required temperatures are (Riddick et al., 2007) which is more than an order of magnitude lower than observed.
Busso et al. (1987) and Scaltriti et al. (1993) suggested the dust arises from the accumulation of stellar winds driven by magnetic activity. However, in order to reach temperatures of K, dust must reside close to the central stars at typical distances of AU . Dust in such a location is short-lived and any grains that form will be rapidly dissipated by PR drag. Rhee et al. (2008) estimate the lifetimes of larger grains of a few m in size around BD +20 307 to be only a few decades. Minimum dust masses able to explain the excesses of II Peg, AR Psc and UX Ari are , and , respectively; a standard gas:dust ratio implies total masses 100 times higher. Wood et al. (2005) found very active stars might lose mass at rates perhaps up to yr-1 (100 times that of the Sun), meaning 10-100 years of accumulated wind would be necessary to explain the dust. It seems highly unlikely that such fully-ionized, magnetically-driven winds and coronal mass ejections with outflow velocities of several hundred km s-1 would accumulate in this way.
We are lead to the suggestion of Rhee et al. (2008, see also ) that such warm dust originates from collisions between planetary bodies. Since grains produced in this way will be dissipated relatively quickly, such collision events must be recent.
The problem, then, is why stars of such ages as the RS CVn-type binaries should be producing dust when debris disks around single stars and wide binaries are largely dissipated in a few hundred Myr. In the case of BD+20 307, Zuckerman et al. (2008) noted possible systemic radial velocity variations and suggested an unseen brown dwarf or low-mass star could have destabilized the orbits of rocky bodies. Such destabilization, occurring many millions of years after a “first generation” debris disk would have been mostly dissipated, could stimulate new dust production in Gyr old systems, reviving whatever debris disk remains around these stars.
We suggest another possible mechanism resulting from the conspicuous property of tidally-interacting binaries not shared by their non-interacting single and binary brethren of similar age: copious magnetic activity manifest in the form of high levels of surface spots, chromospheric and X-ray emission. Such activity is thought responsible for the rotational braking through angular momentum loss of main-sequence stars from zero-age onwards (e.g. Mestel, 1984). Angular momentum loss of the dwarf precursors to RS CVns, such as BD+20 307, as well as the more X-ray bright RS CVns themselves, results in substantial orbital shrinkage (e.g. by factors of up to 2 or more) through spin-orbit tidal coupling on timescales of hundreds of Myr to a Gyr (e.g. Eggleton & Kiseleva-Eggleton, 2002). This change in the orbit causes proportional changes in the locations of both mean motion resonances and secular resonances in whatever planetary system the binary has. We postulate that the sweeping of these resonances can lead to both destabilization of the orbits of small bodies and resonant capture; both of these processes can increase the collision rate among these bodies. This mechanism would provide a more general means of stimulating new eras of copious dust production and debris disk revival in Gyr old systems without the need to invoke perturbations from additional companions.
One potential problem for a collisional origin of the dust is the high frequency of detection—40% according to Busso et al. (1988) and Scaltriti et al. (1993). Our pilot study sample is partially biased toward systems with previously identified excesses. If our non-detection of excesses in CF Tuc and WY Cnc imply earlier detections were spurious, the excess frequency implied by this and our detection of one excess in five objects not previously studied is %. An evolutionary timescale of 1 Gyr then implies an integrated warm dust production period—whether in a single or multiple episodes—of 200 Myr. For a 100 yr dissipation timescale of of dust, the total mass required is or about 1 Earth mass, consistent with a planetary origin.
3.1 Dynamical Debris Disk Model
To examine the interaction between a close binary star and a debris disk we ran a numerical model (see, e.g. Wilner et al., 2003) of a dust cloud around II Peg using the dust properties consistent from our Spitzer photometry. II Peg was chosen because it is the best studied of the three systems for which we detect IR excesses: we assumed masses of 1.67 and , a semi-major axis of 0.087 AU, eccentricity of 0.0, and total luminosity of based on the stellar parameters reported by Ottmann et al. (1998) and Frasca et al. (2008).
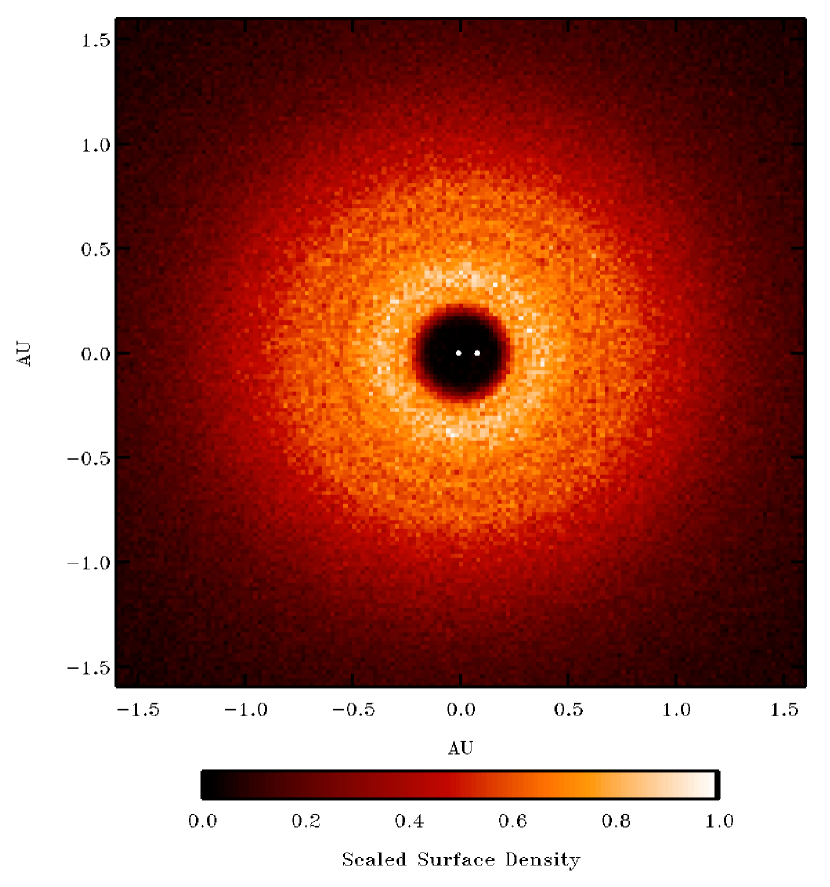
For this initial model, we focus on dynamical clearing and neglect grain-grain collisions, which can also alter the disk morphology (e.g. Stark & Kuchner, 2008). Dust was released from 1 AU with initial eccentricities and inclinations uniformly distributed over the ranges 0–0.1 and 0–0.05, respectively, with the rest of the orbital elements uniformly distributed over 0–. We numerically integrated the orbits of 620 dust grains, subject to gravity from the stars, radiation pressure, and PR drag, until the particles either collided with one of the stars or was ejected beyond 4 AU. Another parameter in these models is , the radiation pressure force on the grain divided by the gravitational force. In the vicinity of a star with the luminosity of II Peg, a 3m radius silicate sphere consistent with our models for the photometry corresponds to . We chose this value, and neglected the slight radiation pressure from the faint secondary star; we leave this detail for future models. At regular time intervals, we accumulated the particle positions in a histogram, in the manner of many previous authors (e.g. Wilner et al., 2003; Stark & Kuchner, 2008). This histogram models the steady-state surface density of the cloud, which is illustrated in Figure 2.
Figure 2 shows a disk with a central clearing, centered on the barycenter of the binary. White dots indicate the locations of the two stars. The dust surface density distribution is azimuthally symmetric, consistent with the analytic predictions of Kuchner & Holman (2003). There are 2–3 ring-like density enhancements, which might be artifacts of the narrow particle size distribution in these initial models, but no signs of clumps or spiral features. For interpreting the Spitzer data, the most important result is the size of the central clearing. The radius of this clearing in the dynamical model is 0.22 AU and similar to the radius at which first order mean motion resonances overlap (and actually coincident with the 4:1 mean motion resonance). This is consistent with our models for the spectral energy distribution for which the grain emissivity law temperature implies a radius AU. A dust sublimation temperature of 1700 K implies that the dust can survive at 0.22 AU, and that the clearing radius is determined by the system dynamics, rather than grain evaporation.
In Section 2, we noted that IRAS excesses for two systems in our Spitzer sample are not confirmed. The Poynting-Robertson time for 3 m grains is (Wyatt & Whipple, 1950) yr. For the grains in the II Peg model, , and the PR time is 177 years. But if the grains are launched near the star at 0.3 AU instead of 1 AU, the PR time drops to 16 years—sufficiently short for IRAS epoch dust to have dissipated by the time Spitzer observations were made. Either the earlier detections were spurious, or excesses could have waned, suggestive of dust being produced in a succession of discrete events.
4 Conclusions
A Spitzer survey of ten tidally-interacting binary systems finds IR excesses for three. The excesses are consistent with significant amounts of warm dust close to the central stars. A numerical model for the steady-state distribution of dust in II Peg finds a clearing radius of 0.22 AU, consistent with the observed optical-IR SED, and suggests the warm dust temperatures result from inward migration of dust due to PR drag and central clearing caused by dynamical perturbations.
Reported IRAS excesses for CF Tuc and WY Cnc are not confirmed by Spitzer, indicating a possible waning of dust in the last few decades. This is consistent with PR drag, for which we find the timescale for dust depletion around II Peg could be as short as a decade or so, suggesting ongoing dust production. We echo the suggestion of Rhee et al. (2008) that dust could arise from collisions of planetary bodies, and speculate that these old binaries can enter epochs in which they destabilize the orbits of their planets through shrinkage of their own binary orbit due to magnetically-driven angular momentum loss.
References
- Alekseev & Kozhevnikova (2004) Alekseev, I. Y., & Kozhevnikova, A. V. 2004, Astrophysics, 47, 443
- Aumann et al. (1984) Aumann, H. H., et al. 1984, ApJ, 278, L23
- Backman & Paresce (1993) Backman, D. E., & Paresce, F. 1993, in Protostars and Planets III, ed. E. H. Levy & J. I. Lunine, 1253–1304
- Bryden et al. (2006) Bryden, G., et al. 2006, ApJ, 636, 1098
- Busso et al. (1988) Busso, M., Scaltriti, F., Origlia, L., Persi, P., & Ferrari-Toniolo, M. 1988, MNRAS, 234, 445
- Busso et al. (1987) Busso, M., Scaltriti, F., Persi, P., Robberto, M., & Silvestro, G. 1987, A&A, 183, 83
- Byrne et al. (1998) Byrne, P. B., et al. 1998, A&AS, 127, 505
- Cutispoto (1991) Cutispoto, G. 1991, A&AS, 89, 435
- Cutispoto et al. (2001) Cutispoto, G., Messina, S., & Rodonò, M. 2001, A&A, 367, 910
- Eggleton & Kiseleva-Eggleton (2002) Eggleton, P. P., & Kiseleva-Eggleton, L. 2002, ApJ, 575, 461
- Eker (1992) Eker, Z. 1992, ApJS, 79, 481
- Fazio et al. (2004) Fazio, G. G., et al. 2004, ApJS, 154, 10
- Frasca et al. (2008) Frasca, A., Biazzo, K., Taş, G., Evren, S., & Lanzafame, A. C. 2008, A&A, 479, 557
- Gehrz et al. (2007) Gehrz, R. D., et al. 2007, Review of Scientific Instruments, 78, 011302
- Gray (1992) Gray, D. F. 1992, The observation and analysis of stellar photospheres., ed. D. F. Gray
- Hall (1976) Hall, D. S. 1976, in Astrophysics and Space Science Library, Vol. 60, IAU Colloq. 29: Multiple Periodic Variable Stars, ed. W. S. Fitch, 287–+
- Heckert et al. (1998) Heckert, P. A., Maloney, G. V., Stewart, M. C., Ordway, J. I., Hickman, A., & Zeilik, M. 1998, AJ, 115, 1145
- Hillenbrand et al. (2008) Hillenbrand, L. A., et al. 2008, ApJ, 677, 630
- Ibanoglu (1989) Ibanoglu, C. 1989, Ap&SS, 161, 221
- İbanoǧlu et al. (2005) İbanoǧlu, C., Evren, S., Taş, G., & Çakırlı, Ö. 2005, MNRAS, 360, 1077
- Kjurkchieva et al. (2000) Kjurkchieva, D., Marchev, D., & Ogloza, W. 2000, A&A, 354, 909
- Kjurkchieva et al. (2005) Kjurkchieva, D. P., Marchev, D. V., Heckert, P. A., & Ordway, J. I. 2005, AJ, 129, 1084
- Kuchner & Holman (2003) Kuchner, M. J., & Holman, M. J. 2003, ApJ, 588, 1110
- Lee et al. (2009) Lee, J. W., Kim, S., Kim, C., Koch, R. H., Lee, C., Kim, H., & Park, J. 2009, AJ, 137, 3181
- Marengo et al. (2009) Marengo, M., Stapelfeldt, K., Werner, M. W., Hora, J. L., Fazio, G. G., Schuster, M. T., Carson, J. C., & Megeath, S. T. 2009, ApJ, 700, 1647
- Messina (2008) Messina, S. 2008, A&A, 480, 495
- Mestel (1984) Mestel, L. 1984, in Lecture Notes in Physics, Berlin Springer Verlag, Vol. 193, Cool Stars, Stellar Systems, and the Sun, ed. S. L. Baliunas & L. Hartmann, 49–+
- Milano et al. (1986) Milano, L., Mancuso, S., Vittone, A., Dorsi, A., & Marcozzi, S. 1986, Ap&SS, 124, 83
- Ottmann et al. (1998) Ottmann, R., Pfeiffer, M. J., & Gehren, T. 1998, A&A, 338, 661
- Rhee et al. (2008) Rhee, J. H., Song, I., & Zuckerman, B. 2008, ApJ, 675, 777
- Riddick et al. (2007) Riddick, F. C., Roche, P. F., & Lucas, P. W. 2007, MNRAS, 381, 1077
- Rieke et al. (2004) Rieke, G. H., et al. 2004, ApJS, 154, 25
- Rodono et al. (1986) Rodono, M., et al. 1986, A&A, 165, 135
- Rodono et al. (1998) Rodono, M., et al. 1998, in Astronomical Society of the Pacific Conference Series, Vol. 154, Cool Stars, Stellar Systems, and the Sun, ed. R. A. Donahue & J. A. Bookbinder, 1446–+
- Scaltriti et al. (1993) Scaltriti, F., Busso, M., Ferrari-Toniolo, M., Origlia, L., Persi, P., Robberto, M., & Silvestro, G. 1993, MNRAS, 264, 5
- Schuster et al. (2006) Schuster, M. T., Marengo, M., & Patten, B. M. 2006, in Society of Photo-Optical Instrumentation Engineers (SPIE) Conference Series, Vol. 6270, Society of Photo-Optical Instrumentation Engineers (SPIE) Conference Series
- Song et al. (2005) Song, I., Zuckerman, B., Weinberger, A. J., & Becklin, E. E. 2005, Nature, 436, 363
- Stark & Kuchner (2008) Stark, C. C., & Kuchner, M. J. 2008, ApJ, 686, 637
- Strassmeier et al. (1993) Strassmeier, K. G., Hall, D. S., Fekel, F. C., & Scheck, M. 1993, A&AS, 100, 173
- Verma et al. (1983) Verma, R. P., Ghosh, S. K., Iyengar, K. V. K., Tandon, S. N., Daniel, R. R., Sanwal, N. B., & Rengarajan, T. N. 1983, Ap&SS, 97, 161
- Weinberger (2008) Weinberger, A. J. 2008, ApJ, 679, L41
- Werner et al. (2004) Werner, M. W., Uchida, K. I., Sellgren, K., Marengo, M., Gordon, K. D., Morris, P. W., Houck, J. R., & Stansberry, J. A. 2004, ApJS, 154, 309
- Wilner et al. (2003) Wilner, D. J., Dowell, C. D., Holman, M. J., & Kuchner, M. J. 2003, in Bulletin of the American Astronomical Society, Vol. 35, Bulletin of the American Astronomical Society, 1415–+
- Wood et al. (2005) Wood, B. E., Müller, H.-R., Zank, G. P., Linsky, J. L., & Redfield, S. 2005, ApJ, 628, L143
- Wright & Barlow (1975) Wright, A. E., & Barlow, M. J. 1975, MNRAS, 170, 41
- Wyatt & Whipple (1950) Wyatt, S. P., & Whipple, F. L. 1950, ApJ, 111, 134
- Zuckerman et al. (2008) Zuckerman, B., Fekel, F. C., Williamson, M. H., Henry, G. W., & Muno, M. P. 2008, ApJ, 688, 1345
| MAGNITUDE | EXCESS | |||||||
|---|---|---|---|---|---|---|---|---|
| Target | 3.6 | 4.5 | 5.8 | 8.0 | 24 | 70 | Ldust/Lbol [10-2]††footnotemark: | Prev. work |
| AR Lac 15,315,3footnotemark: | 4.230.02 | 4.280.03 | 4.240.03 | 4.250.03 | 4.070.08 | |||
| AR Psc 1,21,2footnotemark: | 4.820.03 | 4.870.03 | 4.830.03 | 4.810.03 | 4.690.05 | |||
| CF Tuc 3,43,4footnotemark: | 5.380.03 | 5.420.03 | 5.410.04 | 5.370.04 | 5.200.05 | 4.650.51 | Y a,ba,bfootnotemark: | |
| II Peg 2,5,62,5,6footnotemark: | 4.530.03 | 4.560.03 | 4.540.04 | 4.510.04 | 4.280.04 | 3.750.56 | Y b,cb,cfootnotemark: | |
| TY Pyx 77footnotemark: | 5.200.03 | 5.270.03 | 5.260.03 | 5.260.04 | N ddfootnotemark: | |||
| UV Psc 88footnotemark: | 7.220.04 | 7.190.04 | 7.220.05 | 7.130.05 | 6.990.07 | |||
| UX Ari 2,3,92,3,9footnotemark: | 3.920.03 | 3.910.02 | 3.870.02 | 3.890.02 | 3.540.04 | 3.090.30 | Y eefootnotemark: - N aafootnotemark: | |
| V471 Tau 10,1110,11footnotemark: | 7.190.03 | 7.200.03 | 7.180.04 | 7.150.04 | 7.050.07 | |||
| WY Cnc 12,1312,13footnotemark: | 7.440.03 | 7.450.04 | 7.410.05 | 7.400.05 | 7.310.07 | Y bbfootnotemark: | ||
| XY Uma 1414footnotemark: | 7.160.02 | 7.170.03 | 7.150.05 | 7.110.04 | 7.130.07 | |||
Note. — MIPS magnitudes from aperture photometry using the following source radii and sky background annuli. : source, 18–39″ background, aperture correction factor 2.04. : 13″ source ( for V471 Tau), 20– background, aperture correction factor 1.17 (1.70 for V471 Tau).—†Measured dust luminosity values and upper limits —BVRIJHK photometry references: 1 Cutispoto et al. (2001); 2 Messina (2008); 3 Busso et al. (1988); 4 Cutispoto (1991); 5 Scaltriti et al. (1993) ; 6 Byrne et al. (1998); 7 Busso et al. (1987); 8 Kjurkchieva et al. (2005); 9 Alekseev & Kozhevnikova (2004); 10 Ibanoglu (1989); 11 İbanoǧlu et al. (2005); 12 Milano et al. (1986); 13 Heckert et al. (1998); 14 Kjurkchieva et al. (2000) 15 Rodono et al. (1986) — Previous work excesses from the literature: a Busso et al. (1988); b Scaltriti et al. (1993); c Rodono et al. (1998); d Busso et al. (1987); e Verma et al. (1983).
| BEST-FIT MODELS | ||||||
|---|---|---|---|---|---|---|
| Photospheres | Dust | |||||
| Target | Sp. Typeaafootnotemark: | P [day]aafootnotemark: | Teff [K] bbfootnotemark: | R2/R1 | TBB [K]ccfootnotemark: | Tgrain [K]ddfootnotemark: |
| AR Lac | G2IV/K0IV | 1.98 | 5750/4750 | 2.4 | ||
| AR Psc | K1IV/G7V | 12.25 | 4500/5250 | 0.8 | 1900 | 1400 |
| CF Tuc | G0V/K4V | 2.80 | 6500/4750 | 3.1 | ||
| II Peg | K2IV/M2V | 6.71 | 4500 | 1700 | 1200 | |
| TY Pyx | G5IV/G5IV | 3.20 | 5750/5500 | 0.6 | ||
| UV Psc | G5V/K2V | 0.86 | 5500/5250 | 1.1 | ||
| UX Ari | G5V/K0IV | 6.44 | 5250/4750 | 3.6 | 1300 | |
| V471 Tau | K2V/DA | 0.52 | 5500 | |||
| WY Cnc | G5V/K0V | 0.83 | 5500/3500 | 0.8 | ||
| XY Uma | G5V/K5V | 0.48 | 5750/4250 | 0.7 | ||
Note. — a Spectral types and periods from Strassmeier et al. (1993) – b Based on Kurucz models; the error associated with the best-fit photospheric temperatures is K – c Blackbody dust temperature – d Grain emissivity law dust temperature (see text).