The neutron long counter NERO for studies of -delayed neutron emission in the r-process
Abstract
The neutron long counter NERO was built at the National Superconducting Cyclotron Laboratory (NSCL), Michigan State University, for measuring -delayed neutron-emission probabilities. The detector was designed to work in conjunction with a -decay implantation station, so that decays and -delayed neutrons emitted from implanted nuclei can be measured simultaneously. The high efficiency of about 40%, for the range of energies of interest, along with the small background, are crucial for measuring -delayed neutron emission branchings for neutron-rich r-process nuclei produced as low intensity fragmentation beams in in-flight separator facilities.
keywords:
Large neutron counter , -delayed neutron emission , Astrophysical r-process , Neutron detection efficiency , Neutron backgroundPACS:
28.20.-v , 28.20.Gd , 29.40.-n , 29.40.Cs , 23.40.-s , 25.40.Ny1 Introduction
The emission of -delayed neutrons by neutron-rich nuclei significantly influences [1] the nucleosynthesis of heavy elements in the rapid (r-) neutron-capture process [2, 3]. This decay mechanism competes with the decay of r-process nuclei towards the valley of stability and serves as an additional source of neutrons in late stages of the r-process [4]. Measurements of -delayed neutron emission probabilities () are needed for reliable r-process model calculations, and to test the astrophysical assumptions in various r-process models by comparing their final abundance predictions with observations.
From a nuclear-structure point of view, the value provides model constraints at low beam intensities where -spectroscopy is difficult. The value probes -decay strength at excitation energies slightly above the neutron threshold. It therefore provides nuclear structure information complementary to -decay, which often favors low energy -decay strength owing to the larger phase space (see for example [5, 6]).
The experimental determination of requires the measurement of -delayed neutrons in coincidence with the particles emitted from the nucleus of interest. This is particularly challenging for nuclei near or at the r-process path due to their very low production rates and the relatively short half-lives—of the order of 10–100 milliseconds. Experiments performed at ISOL-type facilities have successfully exploited the use of neutron long counters (NLC) [7] to measure values of neutron-rich nuclei (see, for instance, the compilations of Refs. [8, 9]). NLCs generally consist of a series of gas proportional counters embedded into a moderator block used to thermalize the neutrons prior to their detection. Performance requirements include a high detection efficiency for neutron energies ranging from a few keV to 1 MeV. Because the detector does not measure the energy of individual neutrons, variations of the efficiency as a function of energy have to be minimized as much as possible as they otherwise can translate into uncertainties in the measured . Our goal was to keep detector induced systematic uncertainties well below the 10% level. Measurements at that level of accuracy are a dramatic improvement over theoretical predictions, and ensure that other uncertainties dominate astrophysical and nuclear structure models. With systematic errors at that level, statistical errors will tend to dominate in practice, as the most interesting isotopes will typically be produced at rather low rates.
We report here the development of NERO, a new NLC at National Superconducting Cyclotron Laboratory (NSCL) suitable for use with fast radioactive beams produced by in-flight fragmentation. This technique provides exotic beams without some of the limitations induced by chemistry-based target-extraction techniques. The short time required to transport, separate, and identify the produced fragments, typically less than few hundred ns, makes it possible to study the very short-lived nuclei in the r-process. The fragments of interest are implanted in an active catcher that is part of the NSCL Beta Counting System (BCS). Implantation of a fragment and emitted particles are detected event-by-event. The correlation of decays with a previously implanted nucleus requires large area highly pixelated catchers, typically double-sided silicon strip detectors (DSSDs). The challenge in the design of NERO was to include a large cylindrical cavity capable of accommodating such a system, while still fulfilling the performance requirements for the detection efficiency. The final design was inspired by existing NLC detectors such as the Mainz Neutron Detector [10].
2 Technical aspects
2.1 Design
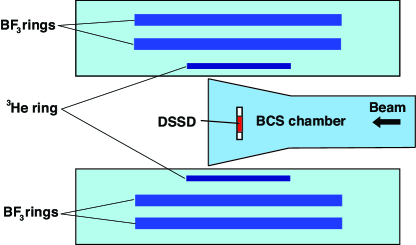
The detector system consists of a 606080 cm3 polyethylene matrix (density 0.93(1) g/cm3) with its long symmetry axis aligned with the beam. Along the beam axis, the matrix has a cylindrical cavity with a diameter of 22.8 cm to accommodate the BCS (see Fig. 1, left).
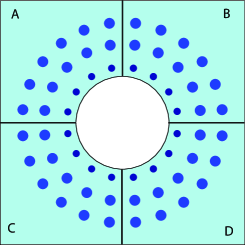
NERO includes three different types of cylindrical proportional counters manufactured by Reuter-Stokes: filled with 3He (models RS-P4-0814-207 and RS-P4-0810-104), and filled with BF3 (model RS-P1-1620-205) (see Tab. 1 for details). Sixty of these detectors are arranged in three concentric rings around the central symmetry axis, allowing for a nearly 4 solid angle coverage around the implantation detector (see Fig. 1, right). The optimum detector configuration was found using the MCNP code [11] to calculate the neutron-detection efficiency for different geometries, moderating materials, and number and arrangement of various types of proportional counters. Interactions of neutrons with the different detector materials were calculated, using the ENDF/B-VI [12] cross-sections in the energy range 10-5 eV to 20 MeV. The influence of different environments such as laboratory floor and wall configurations were investigated but were found to be negligible. According to these calculations, most of the neutrons emitted from the center of NERO are detected in the innermost ring. Therefore, sixteen of the more compact and efficient 3He gas-filled proportional counters are mounted in the innermost ring at a radius of 13.6 cm. For the middle and outer rings at radii of 19.2 cm and 24.8 cm we use twenty and twenty-four BF3 proportional counters, respectively. The BF3 counters are longer allowing one to cover more solid angle, and their efficiency just compensates the decreasing efficiency of the inner ring with increasing neutron energy.
To facilitate transportation and assembly, the polyethylene block is divided into an upper and lower half, and each half is subdivided in six equal parts along the longest symmetry axis. The twelve pieces are held together with eight stainless steel bolts.
| Detector | Active | Radius | Nominal | Gas | High |
|---|---|---|---|---|---|
| Length | Pressure | Composition | Voltage | ||
| (cm) | (cm) | (atm) | (+V) | ||
| 3He (a) | 25.0(2) | 1.3(2) | 10.2 | 100% 3He | 1350 |
| 3He (b) | 35.6(2) | 1.3(2) | 4.0 | 100% 3He | 1100 |
| BF3 | 50.8(1) | 2.5(2) | 1.2 | 96% 10B | 600 |
2.2 Electronics
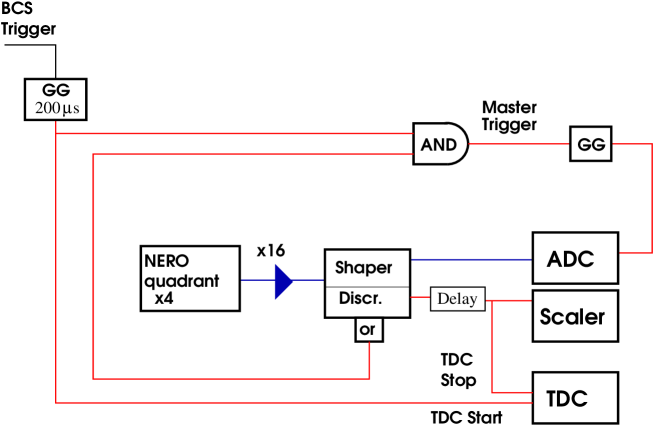
The NERO readout channels are grouped in 4 quadrants with 15 channels each (4 3He counters and 11 BF3 counters). Figure 2 shows a schematic diagram of the NERO electronics for one quadrant. The proportional counters detect the charged particles produced in the exothermic neutron-capture reaction 3He(,) or 10B(,), respectively. Their signals feed 16-channel preamplifiers built at NSCL using Cremat CR-101D miniature charge-sensitive preamp chips. The pre-amplified signals are sent into four 16-channel shaper and discriminator modules, designed at Washington University, St. Louis, and manufactured by Pico Systems [13]. These modules integrate independent shaping and discriminating circuits sharing the same input. Shaping times and pole-zero cancelation are adjusted for each channel by properly selecting the capacitances. The gain and threshold levels of the shaper/discriminator are adjusted via computer control over the CAMAC bus.
The logic signals from the discriminator are recorded in scalers and in a 64-channel multi-hit (VME) TDC that is common for all quadrants. The TDC was programmed to work in start-gate mode, in which a gate signal, generated by a decay detected in the BCS, enables the module to accept multiple stop signals in each channel from any of the sixty gas counters. The duration of this gate (=200 s) was chosen to account for the time needed to moderate and detect the neutrons (see Sec. 3.1). The value of a given nucleus is extracted from the number of stops-signals registered in the TDC (i.e., neutrons correlated with decays) relative to the number of decays detected in the BCS.
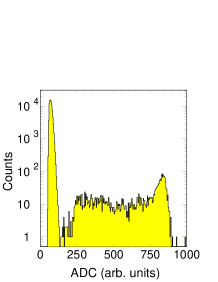
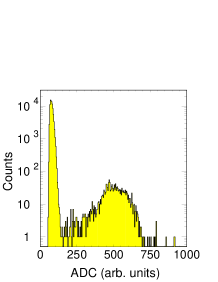
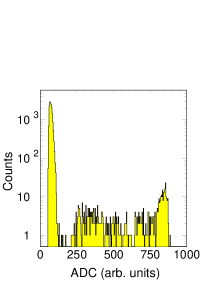
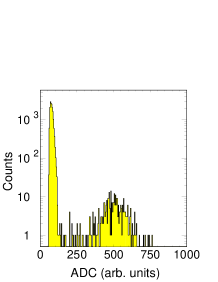
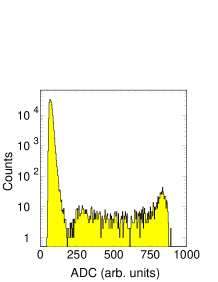
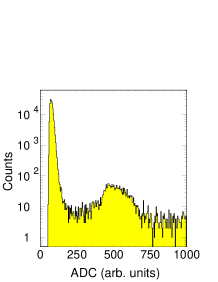
The shaper outputs are connected to 32-channel (VME) ADC cards. The pulse height spectra recorded by the ADCs are used to set the thresholds and gains of the shaper/discriminator units, and to monitor any background or gain variation during the course of an experiment. Figure 3 shows typical ADC spectra for 3He and BF3 gas counters recorded under different conditions. The spectra show the typical wall-effect: The location of the peak at high amplitudes marks the Q value of the neutron-capture reaction, i.e., 3He(,) and 10B(,)7Li for the 3He and BF3 gas counters, respectively; the plateau or low energy tail at low amplitudes arises from events where reaction products hit the detector wall preventing the complete deposition of their energy in the counter gas. Thresholds are set below these low amplitude events and just above the tail of the prominent low energy peak generated by electronic noise and background radiation. Note that unlike the TDC, the ADCs only register one neutron per BCS trigger.
3 Detector performance
3.1 Moderation time
In order to determine the optimal duration of the TDC gate , we measured the time needed by the neutrons to slow down in the polyethylene moderator before their detection (). A 252Cf source was located at the center of NERO facing a NaI scintillator at a distance of 5 cm. Neutrons and rays were emitted in coincidence from the fragments produced in the spontaneous fission of 252Cf. The scintillator was used to detect the rays, which provided the external trigger of the NERO electronics (replacing the BCS trigger shown in Fig. 2). The time difference between the detection of a ray and the subsequent moderated neutrons recorded in the multi-hit TDC provided . The distribution of is shown in Fig. 4 (left) for the innermost, intermediate, and outer rings of proportional counters, as well as for the whole detector.
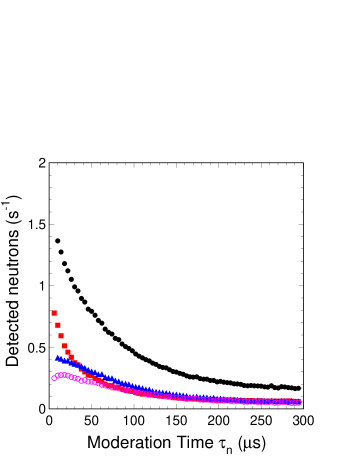
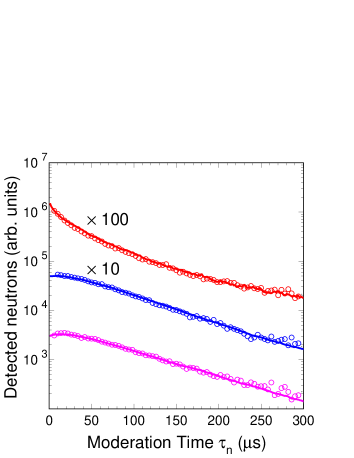
The largest differences between the three rings are found at the shortest times, when most of the neutrons emitted from the center of NERO reach the innermost ring. At late times, the neutrons are more uniformly distributed over the whole moderator, and the three rings have similar detection rates. For each ring, the excellent agreement of the measured, background-subtracted moderation-time distributions with MCNP simulations is shown in Fig. 4. Between 50 s and 300 s the time distributions can be approximated with exponential functions. The corresponding measured and calculated moderation time scales are 43 s and 41 s for the first ring, 51 s and 52 s for the second ring, and 55 s and 59 s for the third ring, respectively.
From Fig. 4, we find that 94.3(1)% of the neutrons are detected within 200 s. The energies of the neutrons emitted in the spontaneous fission of 252Cf are typically described by a Maxwell-Boltzmann distribution function with an effective temperature of = MeV [14], an average neutron energy of 2.1 MeV and a smooth tail at higher energies that extends up to 9 MeV. These are higher energies than typically expected for -delayed neutrons (see discussion at the end of Sec. 3.2.4). Since the moderation time increases with neutron energy, we expect that more than 94.3(1)% of -delayed neutrons are detected within s. We therefore chose a TDC gate of = s.
3.2 Efficiency
In order to characterize the NERO efficiency and its energy dependence, different types of measurements were performed using a 252Cf neutron source of known activity and neutrons produced in resonant and non-resonant reactions at the Institute for Structure and Nuclear Astrophysics (ISNAP) at the University of Notre Dame. The results obtained from these reactions were used to constrain the energy dependence of the NERO efficiency.
3.2.1 Measurement of NERO efficiency with a 252Cf neutron source
Before and after the calibration measurements performed at the University of Notre Dame, the NERO efficiency was measured with a 1.251(5) Ci 252Cf calibration source with an active diameter of 5 mm (neutron branching 11.6% and half-life 2.689 years). Additional contributions to the total neutron rate from contaminants were estimated. Besides 252Cf, there are small impurities of 249-251Cf and 254Cf. 249Cf and 251Cf have a negligibly small spontaneous fission branch, whereas the present amount of 254Cf was very small due to its short half-life. Consequently, only the 250Cf and 252Cf isotopes had to be considered. At the time of the measurement, 3.6% of the total activity of the source was due to 250Cf, whose contribution to the neutron activity was negligible due to its very low neutron branching of 0.296%. The alpha decay of 252Cf produces 248Cm, which undergoes spontaneous fission accompanied with neutron emission, with a branching ratio of 8.39%. The very long half-life of this radioisotope (3.48105 years) made its contribution to the total neutron rate negligible.
The number of detected neutrons was recorded with scalers and the multi-hit TDC described in Sec. 2.2. We verified that data processing dead time is negligible up to 50 KHz, well above the activity of the source, using a random pulser. Similarly, the 2 s dead-time in the proportional counters was negligible. Taking the ratio of the number of neutrons recorded with NERO to the number of neutrons emitted by the source, calculated from the known source activity and neutron branching, we obtained a neutron detection efficiency of 31.7(2)%. This value also serves as a reference point to verify the NERO efficiency before, during, and after experiments.
3.2.2 Measurement of NERO efficiency with resonant reactions
The two resonant reactions used to study the NERO efficiency were 13C(,)16O [15, 16, 17] and 11B(,)14N [18, 19]. The ISNAP KN Van de Graff accelerated a beam of particles impinging onto 13C and 11B targets of 14(2) g/cm2 and 12 g/cm2 thickness, respectively, located at the center of the NERO symmetry axis. The rate of incident particles () was monitored with an isolated electron-suppressed plate behind the target. A total of two resonances for the reaction 13C(,)16O, and one for the reaction 11B(,)14N were used (see Table 2). Each resonance was completely mapped around its peak energy by detecting the number of neutrons as a function of -beam energy . A linear background function was fit underneath the resonance curve and used to subtract non-resonant contributions and background neutrons. The efficiency of NERO was determined as the ratio of the number of detected neutrons to the number of neutrons produced in the resonant reaction. Since the resonances considered here fulfill and (see Table 3), one can use the thick-target narrow-resonance approximation and calculate (see for example [20]) using
| (1) |
where is the stopping power of the particle in the target material, calculated with the SRIM-2000 code [21] in the center-of-mass frame; is the duration of the measurement; is the mole mass of the target; is the target mass density; is the reduced mass of the system and is the resonance strength. The resonance parameters used in the calculations were taken from Refs. [15, 16, 17, 18, 19]. They are summarized in Table 2.
The results of the efficiency measurements are shown in Table 4 for the three selected resonances, along with their corresponding evaluated average neutron energies in the laboratory frame . The calculation of this latter quantity is described in Sec. 3.2.4.
| Reaction | |||||
|---|---|---|---|---|---|
| (MeV) | (keV) | (eV) | (keV) | ||
| 13C(,)16O | 1.053 | 1.5(2) | 11.9(6) | 7165 | 5/2- |
| 13C(,)16O | 1.585 | 1 | 10.8(5) | 7576(2) | 7/2- |
| 11B(,)14N | 0.606 | 2.5(5)10-3 | 0.175(10) | 11436 | 7/2- |
| Reaction | ||||
|---|---|---|---|---|
| (MeV) | (mg/cm2) | (keV) | (keV) | |
| 13C(,)16O | 1.053 | 0.014 | 18 | 1.5(2) |
| 13C(,)16O | 1.585 | 0.014 | 16 | 1 |
| 11B(,)14N | 0.606 | 0.012 | 18 | 2.5(5)10-3 |
3.2.3 Measurement of NERO efficiency with non-resonant reactions
Additional measurements of the NERO efficiency were performed at ISNAP using neutrons produced in the 51V(,)51Cr reaction [22] at three different energies. This reaction has been used in the past for neutron detector calibrations [16, 18]. Here, a proton beam was accelerated at the KN accelerator and impinged onto a 51V target mounted in the center of NERO. Three incident proton energies of 1.8 MeV, 2.14 MeV and 2.27 MeV were chosen from regions of the excitation function with no individual resonances, using three targets with a thickness of 32 g/cm2.
To determine the number of 51V(,)51Cr reactions that have occured during a measurement one can take advantage of the fact that for every 51V(,)51Cr reaction, a radioactive 51Cr is created with a half-life of 27.7025(24) days. The electron-capture decay of 51Cr is followed by the emission of several X-rays [23] and a 320.0824(4) keV ray [24] with a branching ratio of 9.91(1)% [23]. The number of neutrons produced in the reaction can then be simply determined from the activity of the target after irradiation. The number of 320.1 keV rays emitted was measured offline in a lead-shielded setup, where the irradiated target was mounted in a plastic holder facing a HPGe detector. Decay losses during the irradiation, transport, and offline counting were negligible. The HPGe efficiency at 320.1 keV was found to be 0.76(4)% using a 133Ba calibration source, and by interpolating the efficiencies measured for the two rays emitted at 302 keV and 356 keV. The deduced NERO neutron efficiencies are listed in Table 4 for the three different proton energies. The systematic error is dominated by the 5% uncertainty in the activity of the -ray calibration source.
| Reaction | |||||||
| isotr. | MCNP | MCNP | |||||
| scaled | |||||||
| (MeV) | (MeV) | (MeV) | (%) | (%) | (%) | (%) | |
| 11B(,) | 0.606 | 0.56 | 0.12 | 33(2) | 38(2) | 42 | 37 |
| 13C(,) | 1.053 | 2.8 | 0.31 | 24(1) | 30(1) | 29 | 26 |
| 13C(,) | 1.585 | 3.2 | 0.41 | 27(1) | 33(1) | 29 | 24 |
| 51V(,) | 1.80 | 0.23 | 0.014 | 39(2) | 36(2) | 44 | 39 |
| 51V(,) | 2.14 | 0.55 | 0.024 | 34(2) | 32(2) | 42 | 37 |
| 51V(,) | 2.27 | 0.68 | 0.028 | 34(2) | 34(2) | 41 | 36 |
3.2.4 Results and discussion
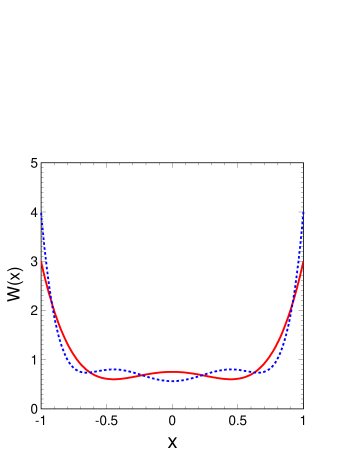
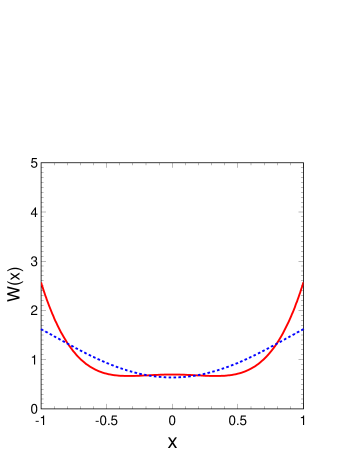
In order to evaluate the energy-dependence of the efficiency, the energy spectrum of the emitted neutrons needs to be known for each reaction used. These neutrons are, for our purposes, essentially mono-energetic in the center-of-mass frame. The center-of-mass energies can be calculated from the known reaction Q-values. However, the corresponding laboratory frame neutron energy depends on the center-of-mass polar angle of the emitted neutron with respect to the beam axis. This leads to a broadening of the neutron energy distribution, with an average neutron energy of
| (2) |
where . The angular-correlation functions for each of the three resonances used here were calculated as described in [25] and are shown in Fig. 5. In the case of the 11B(, )14N reaction, the coupling of the neutron spin with the ground-state of 14N leads to two possible values of the final spin. Variations of the results obtained using the two possible functions were included in the final uncertainty. For 51V(,)51Cr we have chosen energies where the excitation function shows non resonant behavior. This justifies the assumption of isotropic neutron emission in the center-of-mass frame, or, equivalently, .
The average neutron energies calculated in the laboratory frame together with the width of the energy distribution are shown in Table 4 for each reaction, along with the corresponding measured efficiencies . In the case of 51V(,)51Cr also includes a small contribution from the energy loss and straggling in the target.
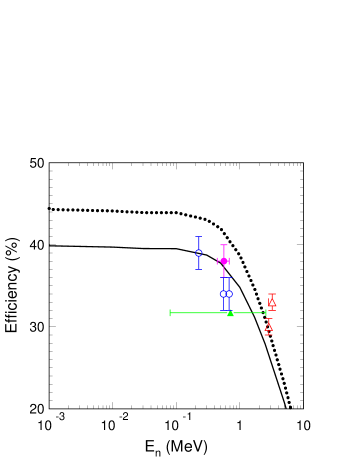
In order to determine the efficiencies for neutrons emitted isotropically with a given energy from the DSSD catcher in the BCS, our measured need to be corrected for the angular distribution and energy range of the neutrons (see e.g. Ref. [26] for the reaction 13C(,)16O). This was done using MCNP simulations: First, the NERO efficiencies were calculated with MCNP at the energies of Table 4, assuming an isotropic mono-energetic neutron source located in the center of the detector. A second calculation was then performed, using the calculated laboratory frame angular and energy distributions of the neutrons. The MCNP-calculated anisotropic-to-isotropic efficiency ratios were then used as a correction factor to translate the measured efficiencies into efficiencies for isotropic emission at a single energy . In Table 4, we show the measured efficiencies for the different reactions () and the corresponding corrected values ( isotr.). The strongest correction of about 15 arises mainly from the angular correlation in the resonant reactions. The isotropic efficiencies are shown in Fig. 6 for the whole detector (left), and for each ring separately (right).
The experimentally-determined efficiencies covered a range of energies from about 0.2 MeV to 3 MeV. In order to extrapolate the results to lower energies, we combined the experimental values ( isotr.) with a MCNP calculation of the efficiency as a function of energy (see dotted line in Fig. 6, left). Despite a global absolute overestimation of about 5%, the calculated function follows very well the energy dependence obtained from the measured data.
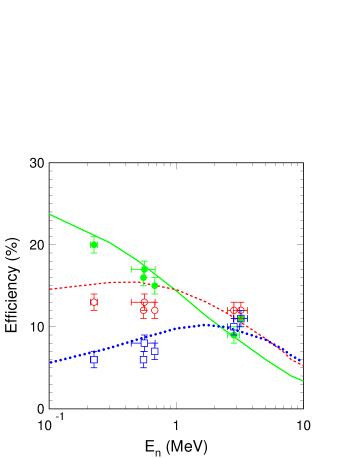
As shown in Fig. 6 (right), the efficiencies calculated independently for each ring follow reasonably well the energy trends of the experimental data. For all the reactions investigated, MCNP reproduces the efficiency of the innermost ring, which is the most efficient of the three. The agreement is somewhat worse for the other rings at the lowest energies. In particular, the calculations overestimate the efficiency of the middle ring by about 3% at energies below 700 keV. We investigated the possibility that this discrepancy could be related to the type of detectors used. Several test measurements of the efficiency were performed with a 252Cf source, using one single 3He proportional counter placed in the first, second and third ring, using the 252Cf source. A comparison of the calculated efficiencies with the values measured under these conditions was consistent with the results shown in Fig. 6 (right). The overall 5 absolute overestimation of the efficiency by the calculations could not be attributed to the uncertainty in the polyethylene density. First of all, variations of the density modified the calculated efficiencies for the second and third ring in the opposite direction of the first ring. Secondly, when the variations in density were limited to the uncertainties provided by the supplier, no differences in the calculated results were observed.
The good agreement of MCNP with experimental data observed in Fig. 6 (right) for the first NERO ring with a thinner moderator layer, and the small discrepancies found for the second and third rings with thicker moderator layers points to a limitation of MCNP to accurately calculate the scattering process of the neutrons in the moderator material. One possibility would be molecular vibrational and rotational excitation modes in the moderator material. Whereas this problem would be hardly observable in detectors with thin moderators (e.g. Ref. [28]), it would become more severe for thicker moderators. Interestingly, similar conclusions were drawn when comparing MCNP calculations with neutron-flux measurements performed with thick neutron detectors [29, 30]. In order to compensate for these model deficiencies we scaled the calculated efficiencies for each ring independently to better match the experimental data (see scaled efficiency in Table 4). The new scaled efficiency-curve (solid line in Fig. 6, left) can thus be used to extrapolate the efficiency to energies below 200 keV.
It is worth noting that the relevant neutron energy range for -delayed neutron emission in r-process nuclei is a few hundred keV. As an example, for the r-process nuclei around , spectroscopic studies of -delayed neutron emitters [31, 32, 33] showed that is typically much lower than . Neutron energies in the laboratory frame were found to be 199 keV for 87Br, 450 keV for 98Rb, and 579 keV for 137I. This result was further supported by the measured average neutron energies of fission fragments from 235U (575 keV) and 239Pu (525 keV), where, in addition, very few neutrons were found at 800 keV [31, 34]. According to these authors, the reason for the “compressed spectra is the preferred population of the lowest excited states in the final nuclei [33]. Our experimental efficiency calibration therefore covers the most critical energy range, and the condition of an energy independent efficiency for -delayed neutrons is well fulfilled. As an example, shown in Fig. 6 (left) shows a relative variation of about 5% for energies below 800 keV. This variation will contribute to the final uncertainty of the measured . This uncertainty can be reduced if the neutron energies can be constrained from experiment or theory.
3.3 Background
One limitation for the measurement of , particularly for very exotic nuclei, is the neutron background rate (). Its estimation requires to distinguish two different origins. First, there is the “intrinsic background associated with the electronics of the NERO detector and its sensitivity to the neutrons present in the environment (mainly cosmic rays). Secondly, during the course of an experiment, there are beam-induced neutrons produced by nuclear reactions unrelated to the -delayed neutron emission of interest. During experiments, neutron background rates measured with NERO in self-trigger mode can vary within about 5–10 depending on whether or not the beam is on target. As will be discussed later, the impact of these background rates is dramatically reduced when the neutrons are measured in coincidence with decays.
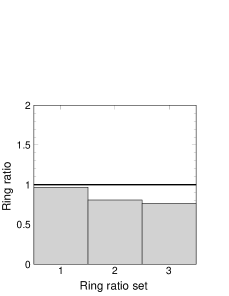
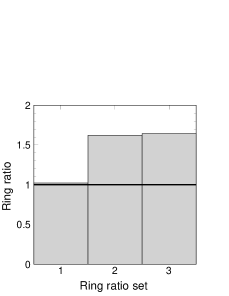
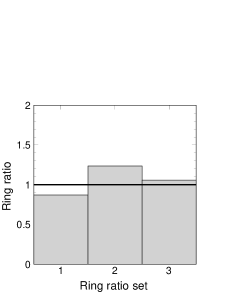
Analysis of the ring-counting ratios for background runs (self-trigger mode) and production runs (external trigger mode) support the idea of an external and a beam-induced background source. As shown in Fig. 7 (left), measurements performed with NERO in external trigger mode (i.e. from decays in the BCS) with -delayed neutron emitters showed that the neutron counting rates were higher for the innermost ring and systematically decreased for the outer rings, in agreement with the results shown in Fig. 6 (right). On the other hand, background runs with beam off showed the opposite trend, with high rates in the outer ring, gradually decreasing for the inner ones (Fig. 7, center). This result suggests that these runs were mainly affected by an external source of background neutrons, most probably related to cosmic rays. Finally, background runs with beam on target showed an intermediate situation that could be explained as arising from a combination of external and internal sources (Fig. 7, right). Energy spectra obtained for background runs with the ADCs show the wall-effect shape expected for neutrons (see lower spectra in Fig. 3). Electronic and -ray contributions are largely below the discriminator thresholds.
4 Measurement of
The NERO detector, together with the BCS, has been employed in numerous r-process motivated experiments performed at NSCL [5, 6, 35, 36, 37]. The exotic nuclei of interest are implanted in a 4040-pixel DSSD in the BCS. -decays are also detected in the DSSD and can be position-correlated to previously implanted ions during a maximum correlation rime . values were determined using the number of neutrons detected in coincidence with an implantation-correlated -decay event, according to the equation:
| (3) |
where is the number of background coincidences between -like events (including real decays and background from the BCS) and neutrons, and is the number of -decaying mother nuclei. is the number of detected -delayed neutrons from the daughter nuclei and needs to be subtracted from . For the nuclear species analyzed in Refs. [5, 6, 35, 36, 37], -neutron coincidences associated with descendant nuclei other than the -decay daughter were negligible. In this case, using the Batemann equations [38], it is possible to write explicitly the value of as:
| (4) |
where is a constant given by:
| (5) |
In this equation, is the neutron-emission probability of the daughter nucleus, and and are the decay constants of the mother and daughter nuclei, respectively. Inserting Eq. 4 and Eq. 5 into Eq. 3, and rearranging terms:
| (6) |
The value of for a given nucleus is calculated as the product of the total number of implantations in the DSSD, and the -detection efficiency.
The NERO background rate given in Sec. 3.3 is the “free neutron background rate without any coincidence requirements. In practice, however, values are determined from neutrons measured in coincidence with decays. The number of background -neutron coincidences for a given nucleus can be written as ; where is the number of “free background neutrons in random coincidence with parent decays, and is the number of “free background neutrons in random coincidence with background -like events in the BCS.
as a function of time and detector pixel can be reliably estimated from the -neutron coincidence rates outside of the correlation window of any ion implantations. for a specific parent nuclide can then be calculated by summing the specific backgrounds at the time and location of each individual ion implantation event. The high granularity of the DSSD detector greatly reduces this background.
can be calculated as the product of the number of parent decays detected and the probability for at least one “free background neutron to be detected in random coincidence with each parent decay, i.e.:
| (7) |
where is the TDC time window defined in Sec. 3.1, and is the “free neutron background rate. For a typical value 10 s-1, about 0.2% of the detected parent decays are in random coincidence with a background neutron, setting the order of magnitude of the lowest values that can be measured with NERO under these conditions.
5 Summary and conclusions
The neutron detector NERO has been built at NSCL enabling the measurement of -delayed neutron emission probabilities of r-process nuclei with fast rare isotope beams. The specific design was motivated by the requirement of achieving a high, energy-independent neutron detection efficiency up to 1 MeV, and accommodating a large pixelated -counting system, necessary to perform measurements with fragmentation beams. MCNP simulations were carried out during the design phase to find the optimum configuration.
Studies of the detector efficiency at various neutron energies were performed with a 252Cf source, and with neutrons from a number of resonant and non-resonant reactions at ISNAP. MCNP calculations reproduce reasonably well the energy dependence of the detector efficiency. On the other hand, the MCNP calculations slightly overestimate the absolute efficiency of the second and third rings, when the neutrons traverse a larger volume of polyethylene. An overall scaling of the calculated efficiency to the measured data can be used to extrapolate the detector efficiency to smaller and larger neutron energies. The small energy dependence (of about 5%), for neutron energies below 800 keV, represents the main contribution from the efficiency correction to the total uncertainty of .
NERO is currently used with the BCS at NSCL, but can be used with other -decay stations at other rare isotope facilities. It will also be used to fully exploit the much higher production rates expected in new generation facilities like FRIB at NSCL, FAIR at GSI and RIBF at RIKEN.
Acknowledgments
This work was supported in part by the Joint Institute for Nuclear Astrophysics (JINA) under NSF Grant PHY-02-16783 and the National Superconducting Cyclotron Laboratory (NSCL) under NSF Grant PHY-01-10253.
References
- [1] K.-L. Kratz, J.-P. Bitouzet, F.-K. Thielemann, P. Möller, and B. Pfeiffer, Ap. J. 403 (1993) 216.
- [2] E.M. Burbidge, G.R. Burbidge, W.A. Fowler, and F. Hoyle, Rev. Mod. Phys. 29 (1957) 547.
- [3] A.G.W. Cameron, Publ. Astron. Soc. Pac. 69 (1957) 201.
- [4] F. Farouqi, K.-L. Kratz, B. Pfeiffer, T. Rauscher, and F.-K. Thielemann, AIP Conf. Proc. 819 (2006) 419.
- [5] F. Montes, A. Estrade, P.T. Hosmer, S.N. Liddick, P.F. Mantica, A.C. Morton, W.F. Mueller, M. Ouellette, E. Pellegrini, P. Santi, H. Schatz, A. Stolz, B.E. Tomlin, O. Arndt, K.-L.Kratz, B. Pfeiffer, P. Reeder, W.B. Walters, A. Aprahamian, and A. Wöhr, Phys. Rev. C 73 (2006) 035801.
- [6] J. Pereira, S. Hennrich, A. Aprahamian, O. Arndt, A. Becerril, T. Elliot, A. Estrade, D. Galaviz, R. Kessler, K.-L.Kratz, G. Lorusso, P.F. Mantica, M. Matos, P. Möller, F. Montes, B. Pfeiffer, H. Schatz, F. Schertz, L. Schnorrenberger, E. Smith, A. Stolz, M. Quinn, W.B. Walters, and A. Wöhr, Phys. Rev. C 79 (2009) 035806.
- [7] G. Grosshög, in: D.N. Poenaru, W. Greiner (Eds.), Experimental Techniques in Nuclear Physics, Walter de Gruyter, 1997, Chap. 7, p. 235.
- [8] G. Rudstam, K. Aleklett, and L. Sihver, At. Data Nucl. Data Tables 53 (1993) 1.
- [9] . B. Pfeiffer, K.-L. Kratz, and P. Möller, Prog. in Nucl. En. 41 (2002) 39
- [10] T. Mehren, B. Pfeiffer, S. Schoedder, K.-L. Kratz,M. Huhta, P. Dendooven, A. Honkanen, G. Lhersonneau, M. Oinonen, J.-M. Parmonen, H. Penttilä, A. Popov, V. Rubchenya, and J. Äystö, Phys. Rev. Lett. 77 (1996) 458.
- [11] Computer code MCNP 5.0, ORNL (RCICC), Oak Ridge, TN, 2003.
- [12] J.S. Hendricks, S.C. Frankle, and J.D. Court, ENDF/B-VI data for MCNP, LANL report LA-12891, Los Alamos, 1994.
- [13] J. Elson (private communication); http://pico-systems.com.
- [14] O.I. Batenkov, A.B. Blinov, M.V. Blinov, and S.N. Smirnov, Atomic Energy 64 (2005) 489.
- [15] J.K. Bair and F.X. Haas, Phys. Rev. C 7 (1973) 1356.
- [16] E. Ramström and T. Wiedling, Nucl. Phys. A 272 (1976) 259.
- [17] C.R. Brune, I. Licot, and R.W. Kavanagh, Phys. Rev. C 48 (1993) 3119.
- [18] E. Lund, P. Hoff, K. Aleklett, O. Glomset, and G. Rudstam, Z. Phys. A 294 (1980) 233.
- [19] T.R. Wang, R.B. Vogelaar, and R.W Kavanagh, Phys. Rev. C 43 (1991) 883.
- [20] W. A. Fowler, C. C. Lauritsen, and T. Lauritsen, Rev. Mod. Phys. 20 (1948) 236.
- [21] J.F. Ziegler, J.P. Biersack, and M.D. Ziegler, The Stopping and Ranges of Ions in Matter, Lulu Press, Morrisville NC, 2008.
- [22] J.L. Zyskind C.A. Barnes, J.M. Davidson, W.A. Fowler, R.E. Marrs, and M.H. Shapiro, Nucl. Phys. A 343 (1980) 295.
- [23] P. Yalçin and Y. Kurucu, Applied Radiation and Isotopes 62 (2005) 63.
- [24] R.G. Helmer and C. van der Leun, Nucl. Instrum. and Meth. in Phys. Res. A 450 (2000) 35.
- [25] C. Iliadis, Nuclear Physics of Stars (Wiley-VCH, Weinheim, 2007) Appendix D.2.
- [26] J.P. Schiffer, A.A. Kraus, and J.R. Risser, Phys. Rev. 105 (1957) 1811.
- [27] W. Brüchle, Radiochimica Acta 91 (2003) 71.
- [28] Y. Danon, R.C. Block, and R.E. Slovacek, Nucl. Instrum. Methods Phys. Res. A 352 (1995) 596.
- [29] ESARDA NDA Working Group, ESARDA Bulletin 33 (November 2003) 26.
- [30] B. Wolle, R. Bätzner, T. Baloui, G. Gonda, H. Klein, B. Wiegel, and J. Wittstock, Rev. Sci. Instrum. 70 (1999) 1194.
- [31] K.-L. Kratz, in Proceedings of the consultants’ meeting on delayed neutron properties (IAEA, Vienna, 1979) p. 103
- [32] K.-L. Kratz, W. Rudolph, H. Ohm, H. Franz, M. Zendel, G. Hermann, S.G. Prussin, F.M. Nuh, A.A. Shihab-Eldin, D.R. Slaughter, W. Halverson, and H.V. Klapdor, Nucl. Phys. A 317 (1979) 335.
- [33] K.-L. Kratz, A. Schröder, H. Ohm, M. Zendel, H. Gabelmann, W. Ziegert, P. Peuser, G. Jung, B. Pfeiffer, K.D. Wünsch, H. Wollnik, C. Ristori, and J. Crançon, Z. Phys. A 306 (1982) 239.
- [34] T.R. England, E.D. Arthur, M.C. Brady, and R.J. LaBauve, LA-11151-MS (1998).
- [35] P.T. Hosmer, H. Schatz, A. Aprahamian, O. Arndt, R.R.C. Clement, A. Estrade, K.-L.Kratz, S.N. Liddick, P.F. Mantica, W.F. Mueller, F. Montes, A.C. Morton, M. Ouellette, E. Pellegrini, B. Pfeiffer, P. Reeder, P. Santi, M. Steiner, A. Stolz, B.E. Tomlin, W.B. Walters, and A. Wöhr, Phys. Rev. Lett. 94 (2005) 112501.
- [36] P.T. Hosmer, H. Schatz et al. (in preparation).
- [37] M. Quinn, J. Pereira et al. (in preparation).
- [38] J. Cetnar, Ann. of Nucl. En. 33 (2006) 640.