The Suzaku Hard X-ray Survey on the Galactic Center Region
Abstract:
Diffuse X-rays from the Galactic center (GC) region were found to exhibit many K-shell lines from iron and nickel atoms in the 6–9 keV band. The strong emission lines seen in the spectrum are neutral iron K at 6.4 keV, He-like iron K at 6.7 keV, H-like iron Ly at 6.9 keV, and He-like iron K at 7.8 keV. Among them, the 6.4 keV emission line is a probe of non-thermal phenomena. We have detected strong 6.4 keV emission in several giant molecular clouds, some of which were newly discovered by Suzaku. All the spectra exhibit large equivalent widths of 1-2 keV and absorption columns of . We found time variability of diffuse 6.4 keV emission in the Sgr B2 region comparing the maps and spectra obtained from 1994 to 2005 with ASCA, Chandra, XMM-Newton and Suzaku. We also report discovery of K lines of neutral argon, calcium, chrome, and manganese atoms in the Sgr A region. We show that the equivalent width of the 6.4 keV emission line detected in X-ray faint region against the 6.4 keV-associated continuum (power-law component) is . These features are naturally explained by the X-ray reflection nebula scenario rather than the low energy cosmic-ray electrons scenario. On the other hand, a 6.4 keV clump, G 0.1620.217, discovered at the south end of the Radio Arc has a small equivalent width of 6.4 keV emission line of . The Radio Arc is a site of relativistic electrons. Thus, it is conceivable that the X-rays of G 0.1620.217 are due to low energy cosmic-ray electrons
1 Introduction
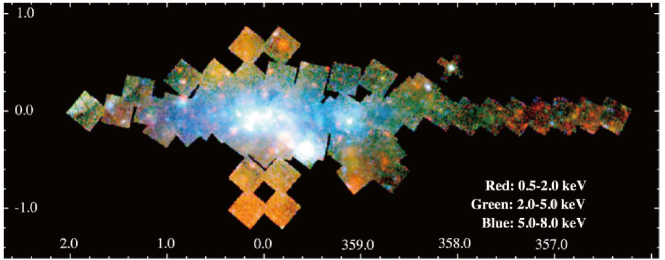
The X-ray Imaging Spectrometer (XIS) on board the Suzaku satellite is the X-ray CCD camera system which has the large effective area, the low and the stable non X-ray background in the 0.3–12 keV band. The diffuse hard X-ray emission from the Galactic center region, particularly in the iron K-shell band, is the best target for Suzaku. We have been making survey observation as a Suzaku key project. We have finished about 60 pointings with a total exposure time of ksec and published 22 papers so far (Figure 1). Figure 2 shows an excellent spectrum of the Sgr A region [1]. The results from the key project can make a Suzaku legacy in the X-ray astronomy.
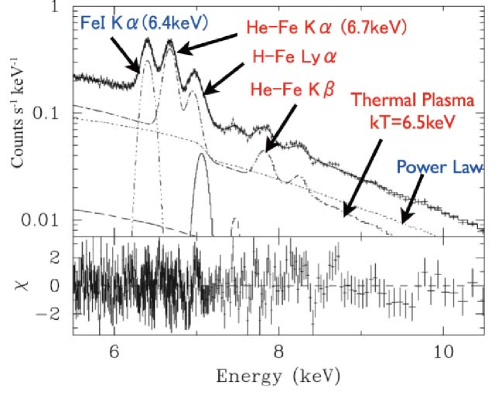
The spectrum of the diffuse X-rays from the Galactic center region exhibits many K-shell lines from iron and nickel atoms in the 6–9 keV band (Figure 2). The strong emission lines seen in the spectrum are neutral iron K at 6.4 keV, He-like iron K at 6.7 keV, H-like iron Ly at 6.9 keV and He-like iron K at 7.8 keV. We determined the electron temperature from the flux ratio of K and K emission lines from He-like iron [1]. The ionization temperature was obtained from the fluxes of the emission lines of H-like iron Ly and He-like iron K. Both temperatures are keV. Thus, we can safely fix the continuum shape of the thermal component at the temperature of keV. An additional power-law component with the photon index is necessary to fit the observed continuum spectrum [1]. The power-law component may have a non-thermal origin and will dominate in the X-ray spectrum above 10 keV. The spectral index is similar to those of X-ray spectra in the 6.4 keV clouds. It indicates that the 6.4 keV emission line is related to the power-law component and can be a probe of the non-thermal phenomena.
2 The 6.4 keV line emission from Giant Molecular Clouds
Figure 3 shows the maps of the 6.4 keV line and the carbon monosulfide line which traces molecular clouds[2]. The 6.4 keV emission shows a clumpy distribution while the 6.7 keV emission has few distinctive structures. Figure 3 indicates that the 6.4keV line emission generally traces the distribution of the carbon monosulfide line emission. It suggests that the iron K-shell fluorescence line emission occurs in the molecular clouds.

Two models have been proposed for the origin of the 6.4 keV emission line. One is the X-ray photo-ionization by external X-ray sources (the XRN scenario) [3, 4, 5]. Since no irradiating source capable of powering the 6.4 keV line is found, Koyama et al. (1996) proposed a scenario of a past X-ray outburst of the super-massive black hole at Sgr A∗. The other is the inner-shell ionization by the impact of low energy cosmic-ray electrons (the LECRe scenario) [6].
The power-law component is the Thomson scattered radiation of the incident X-rays in the XRN scenario, or the bremsstrahlung in the LECRe one. The expected X-ray spectrum is different between the two scenarios. The 6.4 keV line is expected to have a larger equivalent width in the X-ray reflection () than that in the LECRe (). Hard X-rays photo-ionizing iron can reach a deep portion of a molecular cloud, but electrons easily stop at the surface due to the ionization loss. Thus, larger absorption column is expected in the XRN model than in the LECRe one.
We have detected several 6.4 keV clumps so far, some of which were newly discovered by Suzaku [9, 10, 11, 12]. All the spectra have large equivalent widths of 1–2 keV and absorption columns of . These features are naturally explained by the XRN scenario rather than the LECRe one.
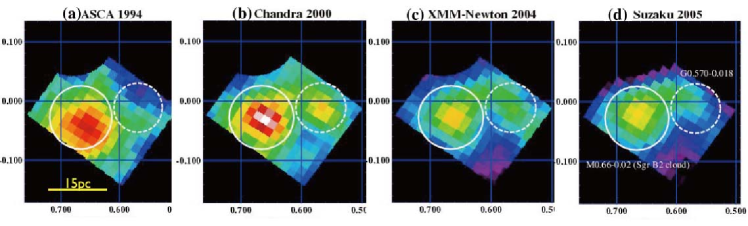
We found time variability of the diffuse 6.4 keV emission in the Sgr B2 region [13, 14]. Figure 4 shows the maps of the line components in 6–7 keV from 1994 to 2005. The two region marked with solid and dashed circles in Figure 4 became bright in 2000 but faded in 2004 and 2005. We analyzed the X-ray spectra of the observations, and found that the flux of the 6.7 keV emission line had been constant through the decade observations. On the other hand, the flux of the 6.4 keV emission line changed by a factor of two.
The decay time of the flux is about 10 yrs. The size of the 6.4 keV clump resolved by Chandra is 10 lyrs. Electrons with the energy range of 10–100 keV, where the cross section of inner shell ionization of iron is maximum, are unable to travel 10 lyrs in 10 yrs. On the other hand, the XRN model explains this time variability.
3 Discovery of K lines from Neutral Atoms
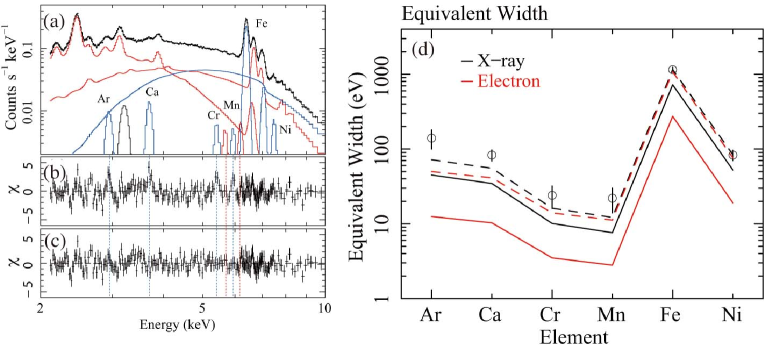
We have shown the results from the neutral iron K emission line (6.4 keV). How about the other elements ? These would provide new information to constrain the origin of the neutral clumps in the GC region. Since the relative existences of the lighter elements are 10 to 100 times smaller than that of iron, we search the brightest 6.4 keV clump located in the Sgr A region for their fluorescence lines[15]. Figure 5a shows the spectrum of the clump. We made a spectral fitting with a model of two temperature thermal plasma components plus a power-law, three Gaussians for the neutral iron K, K, and nickel K emission lines. There remained residuals at the energies of K emission lines of the highly ionized chrome and manganese. Since the APEC model, the thermal plasma code used in the fitting, dose not contain the chrome and manganese K-lines, we added Gaussians for the lines. These lines were firstly detected from the Galactic center region. The temperatures of the plasmas are 1 keV and 7 keV. The absorption column density for the plasma components is , which is typical for the sources in the Galactic center region. Abundances of the elements in the plasmas are solar for sulfur, argon, and calcium, solar for iron and for nickel. The power-law component has the index of and requires absorption column density of which is significantly larger than that for the plasma components. There still remained four line-like residuals whose energies correspond to the neutral argon, calcium, chrome, and manganese K lines (Figure 5b). So, we added Gaussians modeling them to the spectral model and found that it improved the fitting significantly (Figure 5c). We discovered the K-shell lines of neutral argon, calcium, chrome, manganese from the bright neutral clump toward the Sgr A.
Figure 5d shows the equivalent widths of the neutral lines against the power-law component. In order to investigate the origin of the neutral lines, we calculated the equivalent widths in the two scenarios of the XRN and the LECRe using Geant 4. In this calculation, we assumed that density of the molecular cloud is uniform, the absorption column is , and elemental abundances are solar. For the LECRe scenario, the metal abundances in the molecular cloud must be times larger than the solar value. The XRN scenario requires solar abundances. Since the molecular cloud may be formed by condensation of the ambient materials, the abundances should be similar to those in the plasma component in the GC region. The plasma components have the abundances of , which agrees well with those required in the XRN scenario. Thus, we suggest that the K emission lines from neutral elements are due to the X-ray reflection.
4 The 6.4 keV emission lines in X-ray faint regions
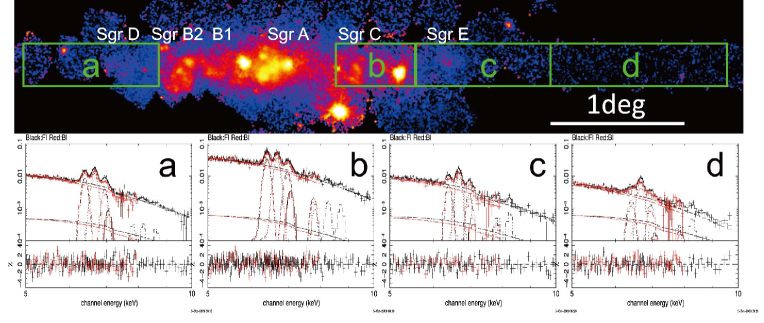
So far, we have shown the results from the X-ray bright clumps as the Sgr A and B2 regions. We now focus on X-ray faint region in this section. Figure 6 shows the regions investigated and their spectra. Significant 6.4 keV emission lines are seen as those in the bright regions. Since the emission is so diffuse that the selection of the background region is difficult, we made a different approach.
Koyama et al. (2009) and Nakajima et al. (2009) showed that the Galactic center diffuse X-rays (GCDX) in the Sgr A and Sgr C regions is phenomenologically decomposed into the 6.7-keV line plus an associated continuum (6.7-component) and the 6.4-keV line plus an associated continuum (6.4-component). The equivalent widths (EWs) of the 6.4 keV () and the 6.7 keV () lines for the Sgr A region are given by the relation keV [8, 9]. In the limit of , in the 6.4-component was successfully estimated to be keV.
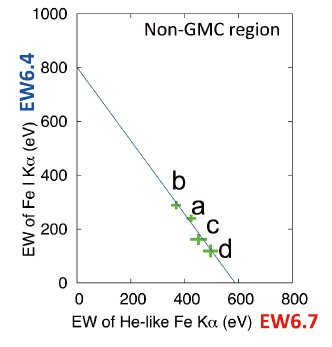
We used the same method to decompose the GCDX in the X-ray faint regions [16]. Figure 7 shows the correlation plot between the observed EWs. This relation indicates that in the 6.4-component is estimated to be eV at . The values is significantly lower than the one expected in the XRN scenario but higher than that of the LECRe model. Further investigation is necessary.
5 G 0.1620.127: a 6.4 keV clump due to LECRe
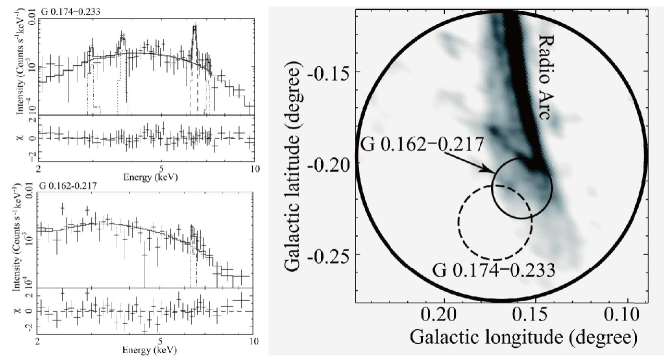
Among the radio non-thermal filaments discovered in the Galactic center region [17], the most prominent one is the Radio Arc [18]. We found two 6.4 keV clumps, G and G , around the south end of the Radio arc [12]. The right panel of Figure 8 shows their positions with the close-up view of the Radio arc. The spectrum of G has prominent K, emission lines of neutral iron and calcium (the left top panel of Figure 8). The EW of the iron 6.4 keV emission line is 950 eV. Thus, the XRN scenario is favored for the origin of G .
The the spectrum of G has significant 6.4 keV emission line (the left bottom panel of Figure 8). The EW of the 6.4 keV line of eV is % of the one expected by the XRN scenario but is consistent with the LECRe model ( eV). The right panel of Figure 8 indicates that G is located in the Radio Arc. Since the Radio Arc is a site of relativistic electrons, it may also include LECRe. Thus, it is quite conceivable that the X-rays of G are due to the LECRe. Assuming the electron energy of 10-100 keV, thick condition for a target cloud and the radiation yield of due to bremsstrahlung, we obtained the electron energy density of . The magnetic field is estimated to be in the condition of the equipartition.
References
- [1] K. Koyama, Y. Hyodo, T. Inui, H. Nakajima, H. Matsumoto, T.G. Tsuru, et al. Iron and Nickel Line Diagnostics for the Galactic Center Diffuse Emission, PASJ 59, (2007) S245
- [2] M. Tsuboi, T. Handa and N. Ukita, Dense Molecular Clouds in the Galactic center region. I. Observations and Data, ApJS 129, (1999) 1
- [3] K. Koyama, Y. Maeda, T. Sonobe, T. Takeshima, Y. Tanaka, S. Yamauchi, ASCA View of Our Galactic Center: Remains of Past Activities in X-Rays ?, PASJ 48, (1996) 249
- [4] R. Sunyaev, E. Churazov Equivalent width, shape and proper motion of the iron fluorescent line emission from molecular clouds as an indicator of the illuminating source X-ray flux history, MNRAS 297, (1998) 1279
- [5] S. Park, M.P. Muno, F.K. Baganoff, Y. Maeda, M. Morris, C. Howard, M.W. Bautz, G.P. Garmire, Characteristics of diffuse X-ray line emission within 20 parsecs of the Galactic center, ApJ 559, (2004) 603
- [6] F. Yusef-Zadeh, C. Law, M. Wardle The origin of X-ray emission from a Galactic center molecular cloud: low-energy cosmic-ray electrons, ApJL 568 (2002) L121
- [7] A. Valinia, V. Tatischeff, K. Arnaud, K. Ebisawa, R.Ramaty On the origin of the iron K line in the spectrum of the Galactic X-ray background, ApJ 543, (2000) 733
- [8] K. Koyama, Y. Takikawa, Y. Hyodo, T. Inui, M. Nobukawa, H. Matsumoto, and T.G. Tsuru Spatial Distribution of the Galactic Center Diffuse X-Rays and the Spectra of the Brightest 6.4 keV Clumps, PASJ 61, (2009) S255
- [9] H. Nakajima, T.G. Tsuru, M. Nobukawa, H. Matsumoto, K. Koyama, H. Murakami, A. Senda, S. Yamauchi X-Ray Reflection Nebulae with Large Equivalent Widths of the Neutral Iron K Line in the Sagittarius C Region, PASJ 61, (2009) S233
- [10] K. Koyama, T. Inui, Y. Hyodo, H. Matsumoto, T.G. Tsuru, Y. Maeda, H. Murakami, S. Yamauchi, S.E. Kissel, K.-W. Chan, Y. Soong Discoveries of Diffuse Iron Line Sources from the Sgr B Region, PASJ 59, (2007) S221
- [11] M. Nobukawa, T.G. Tsuru, Y. Takikawa, Y. Hyodo, T. Inui, H. Nakajima, H. Matsumoto, K. Koyama, H. Murakami, S. Yamauchi, Suzaku Spectroscopy of an X-Ray Reflection Nebula and a New Supernova Remnant Candidate in the Sgr B1 Region, PASJ 60, (2008) S191
- [12] R. Fukuoka, K. Koyama, S.G. Ryu, T.G. Tsuru Suzaku Observation Adjacent to the South End of the Radio Arc, PASJ 61 (2009) 593
- [13] K. Koyama, T. Inui, H. Matsumoto, T.G. Tsuru A Time-Variable X-Ray Echo: Indications of a Past Flare of the Galactic-Center Black Hole, PASJ 60, (2008) S201
- [14] T. Inui, K. Koyama, H. Matsumoto, T.G. Tsuru Time Variability of the Neutral Iron Lines from the Sagittarius B2 Region and Its Implication of a Past Outburst of Sagittarius A, PASJ 61 (2009) S241
- [15] M. Nobukawa, K. Koyama, T.G. Tsuru, S.G. Ryu and V. Tatischeff, Discovery of K-shell Emission Lines of Neutral Atoms in the Galactic Center Region, PASJ (2010) in Printing
- [16] H. Uchiyama Study of the Galactic Diffuse X-ray Emission with the Suzaku satellite Doctor Thesis, Kyoto University, (2010)
- [17] T.N. LaRosa, M.E. Kassim, T.J.W.Lazio, S.D. Hyman A wide-field 90 centimeter VLA image of the Galactic center region, AJ 119 (2000) 207
- [18] F. Yusef-Zadeh, M. Morris, D. Chance, Large, highly organized radio structures near the galactic centre, Nature 310 (1984) 557