Pressure- and temperature-induced structural phase transitions of CaFe2As2 and BaFe2As2 studied in the Hund’s rule correlation picture
Abstract
With the proposed Hund’s rule correlation picture, i.e. the fluctuating Fe local moments with the As-bridged antiferromagnetic superexchange interactions, the exceptional collapsed tetragonal phase and related phase transitions observed in CaFe2As2 are well understood. With the same framework, a pressure-temperature phase diagram is predicted for BaFe2As2 as well, in which a paramagnetic tetragonal and a collinear antiferromagnetic orthorhombic structures to nonmagnetic tetragonal structure transitions take place around 4-8 GPa and 10-15 GPa respectively, and a nonmagnetic tetragonal to a nonmagnetic collapsed tetragonal structure transition takes place over 26 GPa. Our study helps better understand the complex correlation among crystal structure, magnetism, and electronic structure in pnictides, a precondition to understand the superconductivity in pnictides.
pacs:
74.70.Xa, 74.20.Pq, 74.25.Dw, 74.25.BtLABEL:FirstPage1 LABEL:LastPage#1
Since the discovery of superconductivity in LaFeAsO by partial substitution of O with F atoms below 26Kkamihara , intense studies have been devoted to physical properties of iron-based pnictides both experimentally and theoretically. There are, so far, four types of iron-based compounds reported, showing superconductivity after doping or under high pressures, i.e. 1111-type FeAsO ( = rare earth) kamihara , 122-type Fe2As2 (=Ba, Sr, or Ca) rotter , 111-type FeAs ( = alkali metal) wang , and 11-type tetragonal -FeSe(Te) hsu . All these compounds share the same structural feature that there exist the robust tetrahedral layers where Fe atoms are tetragonally coordinated by pnicogen or chalcogen atoms and the superconduction pairing may happen. A universal finding is that all these compounds are in a collinear antiferromagnetic (AFM) order below a tetragonal-orthorhombic structural transition temperature cruz ; dong except for -FeTe that is in a bi-collinear AFM order below a tetragonal-triclinic structural transition temperature ma ; bao ; shi .
The above finding brings out a serious issue regarding the mechanism behind the structural and antiferromagnetic transitions, and their underlying relationship. There are basically two contradictive views upon this issue. The first one mazin is based on itinerant electron picture, which thinks that there are no local moments and the collinear antiferromagnetic order is induced by the Fermi surface nesting that is also responsible for the structural transition due to breaking the four-fold rotational symmetry. On the contrary, the second one is based on local moment picture. The - Heisenberg model was, phenomenologically yildirim and from strong electron correlation limit si respectively, proposed to account for the issue. At the same time, we proposed ma1 the fluctuating Fe local moments with the As-bridged antiferromagnetic superexchange interactions as the driving force upon the two transitions, effectively described by the - Heisenberg model as well.
Our proposal embodies the twofold meanings shown by the calculations ma1 : (1) there are localized magnetic moments around Fe ions and embedded in itinerant electrons in real space; (2) it is those bands far from rather than nearby the Fermi energy that determine the magnetic behavior of pnictides, namely the hybridization of Fe with the neighbor As atoms plays a substantial role. Here the formation of a local moment on Fe ion is mainly due to the strong Hund’s rule coupling on Fe -orbitals ma1 . In this sense, our proposal can be considered as the Hund’s rule correlation picture. We emphasize again that the Arsenic atoms play a substantial role in our physical picture. Subsequently we successfully predicted from the calculationsma , based on this Hund’s rule correlation picture, that the ground state of -FeTe is in a bi-collinear antiferromagnetic order, which was confirmed by the later neutron scattering experiment shi .
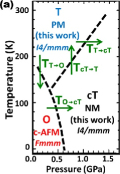
At ambient pressure, like other pnictides, CaFe2As2 undergoes a transition from a nonmagnetically ordered tetragonal (T) phase to a collinear AFM orthorhombic (O) phase below 170K exp-cafm (TT→O). Nevertheless, the neutron diffraction measurementsprb08 ; prb09 further found that, at 50K, CaFe2As2 experiences another exceptional transition from a collinear AFM orthorhombic phase to a new nonmagnetically ordered but collapsed tetragonal (cT) phase with a dramatic decrease in both the unit cell volume and the ratio when the applied pressure is larger than 0.35 GPa (TO→cT). The corresponding phase diagram is schematically shown in Fig. 1(a). Thus how to understand this phase diagram and accompanied magnetism, especially the two nonmagnetically ordered tetragonal phases, becomes an outstanding problem.
In this Letter, we show that the exceptional collapsed tetragonal phase and related structure transitions, accompanied by the magnetic transitions, found experimentally in CaFe2As2 can be well understood within the proposed Hund’s rule correlation picture. The importance of the fluctuating local moments in the structural transitions is elucidated. Moreover, we predict a pressure- and temperature-induced phase diagram for BaFe2As2 in the same framework.
The previous calculations dft-cafm show that the ground state of CaFe2As2 is in an orthorhombic structure with a collinear AFM order at low temperature and low pressure, in an excellent agreement with the experiments. It was naturally proposed, from the Hund’s rule correlation picture, that the high-temperature tetragonal phase of CaFe2As2 is a paramagnetic (PM) phase with local magnetic moments around Fe atoms randomly orientated due to thermal fluctuations, which is supported by the universal linear-temperature dependence of static magnetic susceptibility in iron pnictides gmzhang and our calculation illustrated below. Here, we further propose that the pressure-induced exceptional collapsed tetragonal phase of CaFe2As2 is a nonmagnetic (NM) phase, in which the Hund’s rule in Fe atoms is overcome so that the Fe magnetic moments are quenched. The corresponding calculations reported below confirm our proposal and well describe the exceptional phase diagram of CaFe2As2.
Our density functional theory (DFT) calculations were done using the general gradient approximation (GGA) for exchange-correlation potentialspbe , the projector augmented wave method paw , and a plane wave basis set up to 600 eV as implemented in the Vienna ab-initio simulation packagevasp . The Gaussian broadening technique was used and a -mesh of or was adopted to sample the Brillouin zone of or supercell, respectively. The shape of the lattice and the internal coordinates of all ions were fully optimized at a given cell volume. A series of volumes, differing in in each dimension from one to another, were calculated for each state, as reported in Figs. 2 and 3.
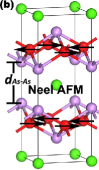
In calculation, it is very difficult to directly simulate a paramagnetic phase. Nevertheless, the checkerboard-AFM and paramagnetic phases share the following important features: (1) local moments around Fe atoms, (2) zero net magnetic moments in a unit cell, and (3) the same magnetic symmetry. Moreover, the effect of spin fluctuations on static properties in the paramagnetic phase may be accounted for by the checkerboard-AFM state. Thus as long as we study the static properties rather than the low-energy dynamics, the checkerboard-AFM state is feasible to properly model the paramagnetic phase. Accordingly, the orthorhombic collinear AFM (c-AFM), tetragonal checkerboard-AFM namely Neel order (denoted as Neel-AFM), and tetragonal NM states are considered to represent the low-temperature orthorhombic (O) phase, the high-temperature tetragonal (T) phase, and the pressure-induced collapsed tetragonal (cT) phase in CaFe2As2, respectively.
Phase transition from O to cT is so unusual that phase O collapses to phase cT under a small external pressure. Figure 2 shows the evolution of the total energy with the unit cell volume ( curve) in the c-AFM and NM states. The measured structural parameters for phases O and cT at 50 K were well reproduced, within errors of 1-2, by the DFT calculations in the c-AFM and NM states, respectively, while the Neel-AFM state cannot reproduce. One sees that the volume decrease is accompanied by a loss of magnetic moment in the c-AFM state, as shown by the red numbers in Fig. 2. Nevertheless, in the transition region, the magnetic moment is still large, roughly 1.6-1.7 , which indicates that the full suppression of magnetic moments, after the c-AFM to NM transition, cannot be simply ascribed to pressure-induced full delocalization of localized electrons solely.
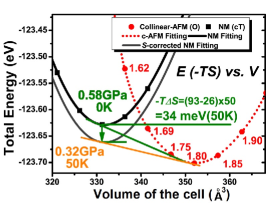
Gibbs free energy determines the stability of phases, which is defined as , where , , , , and stand for internal energy, temperature, entropy, pressure, and volume, respectively. The transition pressure of TO→cT can be thus worked out by ), whereas the entropy terms are negligible at extremely low temperature, e.g. 4K. It turns out that the transition pressure from c-AFM to NM state is given by the slope of the tangent line between the NM and c-AFM curves in Fig. 2, i.e. 0.58 GPa at 0K, which excellently agrees with the experimental result of 0.6 GPa at 4Kprb09 . In contrast, this value is smaller by one order of magnitude than another calculated value of 5.25 GPa working with the Fermi surface nesting picturezhang2010 . Meanwhile, a dramatic cell volume deduction of about 19 Å3 is found in our calculations, consistent with the experimental value of 14.23 Å3 at 50K.
At a finite temperature, the entropy terms need to be considered. The entropy change from phase cT to O () is estimated as 0.67 meV/Kentropy . This lowers the of phase cT by 34 meV at 50 K, as illustrated by the gray curve in Fig. 2. Following the same procedure, another tangent line in the figure gives a transition pressure of 0.32 GPa and a similar volume deduction, again excellently consistent with the measured pressure in between 0.24 and 0.35 GPa at 50 Kprb08 .
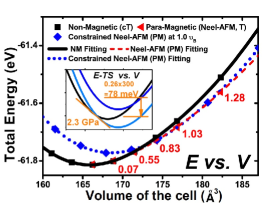
Phase transitions between T and cT – Figure 3 shows the curves of the Neel-AFM and NM states. We find that the NM state has a lower energy than the Neel-AFM state at the equilibrium. The Neel-AFM state is, however, more stable than the NM state at larger volumes, for example, at a volume of 176.83 Å3 close to the experimental value of phase T at 0.63 GPa and 200 Kprb08 . The corresponding local moment increases to 1.03 . And the nearest neighbors Fe-Fe separation in the Neel-AFM state is only 0.03 Å shorter than the experimental value while 0.14 Å in the NM state.
There are two phase transitions defined with phases T and cT, i.e. transitions TcT→T and TT→cT as marked in Fig. 1. To well understand these two phases, another spin-polarized calculation with magnetic moments constrained at 1.0 was performed, as reported by the blue dotted curve in Fig. 3. Because of containing an extra freedom degree of magnetic moments, the paramagnetic tetragonal phase T represented by the Neel-AFM state has a larger entropy than the collapsed tetragonal phase cT represented by the NM state. This lowers Gibbs free energy in phase T more than in phase cT when increasing temperature. This change is presented by the inset of Fig. 3, in which the blue curve (constrained Neel-AFM) goes lower at a finite temperature by . As a consequence, the system takes transition from phase cT to phase T when the entropy change overcomes the volume expansion by increasing temperature, meanwhile the magnetic moments recover. The entropy change is estimated as meV/K between phases T and cTentropy , by which a transition pressure of 2.3 GPa for TcT→T is derived from the -corrected curve ( versus in Fig.3 inset) at =300 K, reasonably consistent with the experimental value of 1.5 GPaprb09 .
Collapse mechanism of CaFe – As analyzed above, the Fe magnetic moment is induced by the Hund’s rule coupling on the Fe -orbitals, which is about 0.6-0.8 eV/Fe. In transition TO→cT, the Hund’s rule coupling must be overcome and compensated from Gibbs free energy gain since the magnetic moments are quenched. Inspection of the calculations shows that the spin degeneration pushes down the energy levels raised by the Hund’s rule coupling, and then strengthens the bonding between the Fe orbitals and As orbitals, which makes substantial energy gain to the NM state. Besides, there is an energy of 0.1 eV/Fe (denoted as ) contributed from other sources to compensate the Hund’s rule coupling, as suggested by the total energy difference between the non-collapsed NM state and the c-AFM state of CaFe2As2 in the equilibrium. There are such possible sources as: (1) entropy change effect of ; (2) volume shrink effect of ; and (3) formation of new bonds that make further energy gain.
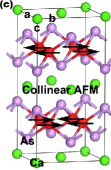
The entropy difference between the c-AFM and NM states is very small and can be negligible in very low temperatures. As reported above, the cell volume containing four Fe ions is dramatically reduced by 19Å3 after transition TO→cT from the c-AFM to the collapsed NM state. In order to compensate in Gibbs free energy to favor the collapsed phase through the volume shrink effect of alone, an applied pressure of 3.4 GPa would be required. However, it is noticed that CaFe2As2 is so compact that the nearest As-As distance in the equilibrium, as shown in Fig. 1(b), is already very close to the distance that can form an As-As covalent bond, i.e. 2.9 Å. Actually, the As-As bond indeed forms in the collapsed phase prl09 . The formation of such a new bond contributes an additional energy gain of 0.1 eV/Fe, as estimated from the total energy difference between the collapsed and non-collapsed NM states of CaFe2As2. Such an energy gain is fairly comparable with . It turns out that the c-AFM to the collapsed NM transition can take place at a low pressure that pushes the nearest As atoms close enough to form bonds, due to the small size of Ca atoms and its resulting short inter-layer As-As distance. The collapsed phase is thus closely related to the formation of the As-As bonds. In most pnictides, the nearest As-As distance in equilibrium is much larger than the one in CaFe2As2, differences in phase diagrams are thus expected, as found in BaFe2As2 reported below.
Prediction on phase diagram of BaFe2As2 – Within the Hund’s rule correlation picture, we predict a phase diagram of BaFe2As2, as shown in Fig. 4, which looks similar in shape to that of CaFe2As2. However, the calculation shows that the realization of an effective As-As bond needs a huge pressure (over 20 GPa) due to a large in BaFe2As2. Such a large pressure already provides a sufficient Gibbs free energy gain through to compensate the Hund’s rule coupling, resulting in a nonmagnetic state, not necessarily with an extra energy gain from the As-As bonding in collapsed structures. Consequently, there is no c-AFM directly to collapsed NM transition. Instead, there are two transitions with increasing pressure, first from the c-AFM to a normal NM state, then further to a collapsed NM state. The corresponding transition pressures are predicted following the same way adopted for CaFe2As2. They are, as shown in Fig. 4, (1) the paramagnetic tetragonal to the NM tetragonal phase transition at 4.0-7.2 GPa depending on temperature ; (2) the c-AFM orthorhombic to the NM tetragonal phase transition around 12.8 GPa at very low ; (3) the NM tetragonal to the collapsed NM tetragonal phase transition at 26-30 GPa.
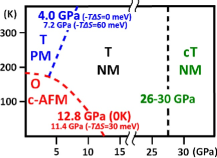
In summary, with the Hund’s rule correlation picture, the exceptional phase transitions accompanied with the magnetic structures and properties in CaFe2As2 are well understood, as demonstrated using the density functional theory calculations. The calculated transition pressures of 0.58 (0.32) GPa at 0 (50) K for the transition from the collinear antiferromagnetic orthorhombic phase to the nonmagnetic collapsed tetragonal phase, and 2.3 GPa at 300 K for the transition from the paramagnetic tetragonal phase to the nonmagnetic collapsed tetragonal phase, are highly consistent with the experimental values 0.6 (0.25-0.35) GPa at 4 (50) K and 1.5 GPa at 300 K, respectively. Different from CaFe2As2, a nonmagnetic non-collapsed tetragonal phase is predicted to appear in the phase diagram of BaFe2As2 due to the larger atomic size of Ba than that of Ca, separating the nonmagnetic collapsed tetragonal phase from the collinear antiferromagnetic orthorhombic phase and paramagnetic tetragonal phase. The corresponding transition pressures are predicted as well and reported in phase diagram Fig. 4.
This work was supported by National Natural Science Foundation of China and by National Program for Basic Research of MOST, China.
References
- (1) Y. Kamihara et al., J. Am. Chem. Soc. 130, 3296 (2008).
- (2) M. Rotter et al., Phys. Rev. Lett. 101, 107006 (2008).
- (3) X. C. Wang et al., Solid State Commun. 148, 538 (2008).
- (4) F.-C. Hsu et al., Proc. Natl. Acad. Sci. U.S.A. 105, 14262 (2008).
- (5) C. de la Cruz et al., Nature (London) 453, 899 (2008).
- (6) J. Dong et al., Europhys. Lett. 83, 27006 (2008).
- (7) F. Ma et al., Phys. Rev. Lett. 102, 177003 (2009).
- (8) W. Bao et al., Phys. Rev. Lett. 102, 247001 (2009).
- (9) S.L. Li et al., Phys. Rev. B 79, 054503 (2009).
- (10) I.I. Mazin, D.J. Singh, M.D. Johannes, and M.H. Du, Phys. Rev. Lett. 101, 057003 (2008).
- (11) T. Yildirim, Phys. Rev. Lett. 101, 057010 (2008).
- (12) Q. Si and E. Abrahams, Phys. Rev. Lett. 101, 076401 (2008).
- (13) F. Ma, Z.Y. Lu, and T. Xiang, Phys. Rev. B 78, 224517 (2008).
- (14) N. Ni et al., Phys. Rev. B 78 014523, (2008).
- (15) A. Kreyssig et al., Phys. Rev. B 78, 184517 (2008).
- (16) A. I. Goldman et al., Phys. Rev. B 79, 024513 (2009).
- (17) F. Ma, Z.Y. Lu, and T. Xiang, Front. Phys. China, 5(2), 150 (2010).
- (18) G. M. Zhang et al., Europhys. Lett. 86, 37006 (2009).
- (19) J.P. Perdew, K. Burke and M. Ernzerhof. Phys. Rev. Lett. 7̱7 3865 (1996).
- (20) G. Kresse and D. Joubert, Phys. Rev. B 59, 1758 (1999).
- (21) G. Kresse and J. Furthmüller, Phys. Rev. B 54, 11169 (1996).
- (22) Y.Z. Zhang et al., Phys. Rev. B 80, 094530 (2009).
- (23) The transition between phases PM T and NM cT occurs at 0.63 GPa, 200 Kprb08 . According to these values and the calcculated curves, is derived as 0.26 meV/K. Likewise, =0.93 meV/K between phases T and O is derived. These lead =0.67 meV/K between phases cT and O, assuming unchanged in the considered tmeperature region.
- (24) T. Yildirim, Phys. Rev. Lett. 102, 037003 (2009).