Chandra X-ray Detection of the Enigmatic Field Star BP Psc
Abstract
BP Psc is a remarkable emission-line field star that is orbited by a dusty disk and drives a parsec-scale system of jets. We report the detection by the Chandra X-ray Observatory of a weak X-ray point source coincident with the centroids of optical/IR and submillimeter continuum emission at BP Psc. As the star’s photosphere is obscured throughout the visible and near-infrared, the Chandra X-ray source likely represents the first detection of BP Psc itself. The X-rays most likely originate with magnetic activity at BP Psc and hence can be attributed either to a stellar corona or to star-disk interactions. The log of the ratio of X-ray to bolometric luminosity, , lies in the range to . This is smaller than ratios typical of low-mass, pre-main sequence stars, but is well within the range observed for rapidly-rotating (FK Com-type) G giant stars. Hence, the Chandra results favor an exotic model wherein the disk/jet system of BP Psc is the result of its very recently engulfing a companion star or giant planet, as the primary star ascended the giant branch.
1 Introduction
Since its discovery by Stephenson (1986), the remarkable field star BP Psc (= StH 202) has been classified as a classical T Tauri star (cTTS) on the basis of its strong H and forbidden line emission. The discovery by Zuckerman et al. (2008; hereafter ZMS08) of an orbiting, dusty circumstellar disk and an enormous (pc-scale) system of highly collimated outflows (jets) would appear, at first glance, to provide strong support for such a cTTS classification. However, as noted by ZMS08, it is not at all clear that BP Psc is a pre-main sequence (pre-MS) star.
First, although its jet system resembles those of cloud-embedded young stellar objects, BP Psc is located at high galactic latitude, far from any known star forming cloud. Furthermore, unlike the rare (though increasingly scrutinized) “isolated,” cTTS systems within pc (Torres et al. 2008) — the best-known examples being TW Hya (Kastner et al. 1997; Zuckerman & Song 2004; and references therein) and V4046 Sgr (Kastner et al. 2008b; Rodriguez et al. 2010; and references therein) — BP Psc is not associated with any known sparse group of young stars (ZMS08). Second, its photospheric Li abundance appears to be anomalously weak for a K-type pre-MS star of age Myr, and its gravity-sensitive photospheric absorption lines also call into question such a classification (ZMS08). Third, the mm-wave molecular spectrum of its circumstellar disk — specifically, its weak CN and HCO+ emission — is atypical of the disks of low-mass, pre-MS stars (Kastner et al. 2008a).
In light of the first two considerations, ZMS08 proposed that BP Psc is most likely a first-ascent giant at a distance pc. They speculated that the BP Psc disk/jet system might therefore be the result of a recent, catastrophic interaction in which a low-mass companion star (or perhaps giant planet) had been consumed by BP Psc. Though somewhat exotic, a similar (companion engulfment) scenario may also apply to the first-ascent giant star TYC 4144 329 2 (Melis et al. 2009): the post-MS nature of TYC 4144 329 2 is well-established, yet (like BP Psc) this star is evidently actively accreting gas from a dusty circumstellar disk.
Low-mass, pre-MS stars are highly luminous X-ray sources, with typical (0.3–8.0 keV) X-ray luminosities and X-ray to bolometric luminosity ratios in the range to (e.g., Preibisch & Feigelson 2005; Güdel et al. 2007a). Hence, X-ray observations are diagnostic of stellar youth. Furthermore, in rare cases, TTS jet systems may yield shocks energetic enough to produce X-rays, yielding insight into physical conditions within the jets (e.g., Kastner et al. 2005; Guedel et al. 2005, 2007b). Here, we report the results of Chandra X-ray Observatory observations of BP Psc intended to determine whether BP Psc and/or its jet system emit X-rays and, thereby, to better understand the nature of this unusual system.
2 Observations
Chandra observed BP Psc in 2009 January, with the Advanced CCD Imaging Spectrometer (ACIS) as the detector. Due to spacecraft thermal constraints, the observation was obtained in two pieces of duration 10.15 and 65.4 ks (OBSIDs 8900 and 10856, respectively, on 2009 Jan. 12 and 13), for a total exposure time of 75.5 ks. Data were obtained with ACIS CCDs S1, S2, S3, S4, I2, and I3 active. Each CCD has a field of view with 0.49′′ pixels, and is sensitive to photons in the energy range 0.5–8.0 keV (with some additional sensitivity down to 0.3 keV, for back-illuminated CCD S3). The telescope was pointed such that BP Psc was positioned at the nominal aimpoint of CCD S3, from the S2-S3 chip boundary. The merged event data from the two exposures were subject to standard processing, filtering, and calibration (via Chandra X-ray Center (CXC) ACIS pipeline v7.6.1 and CALDB v3.5.1).
We ran the CXC (CIAO111http://cxc.harvard.edu/ciao/) source
detection tool celldetect on the filtered event list,
restricted to CCDs S2 and S3 (the other active CCDs lie far off the
best focal surface). We find 26 sources, including BP Psc itself (§3.1), were detected at a significance (using Poisson
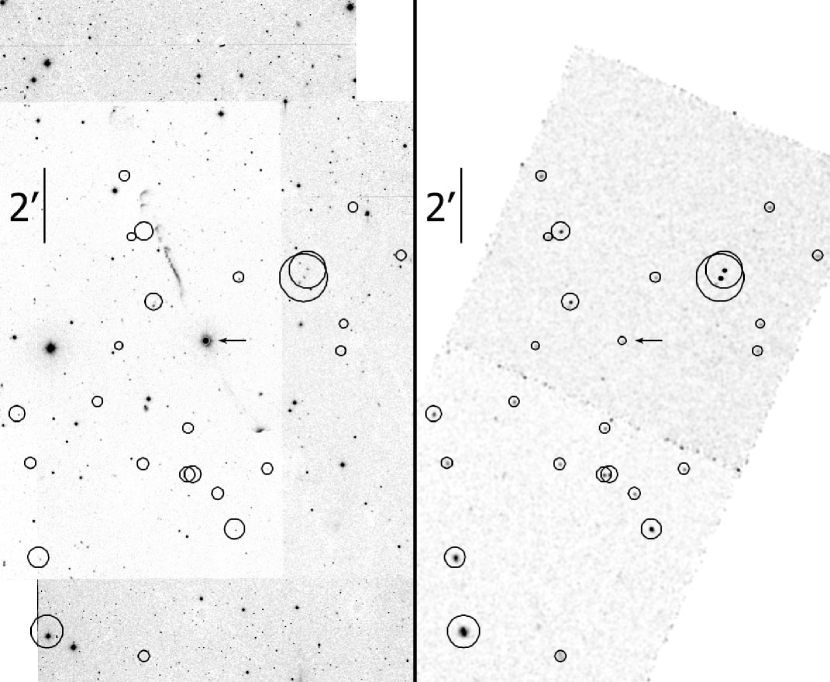
statistics) on these two CCDs (Fig. 1, right).
Four of these S2 and S3 sources lie within of DENIS near-IR
sources; two of the four (BP Psc itself and an X-ray source detected on
CCD S2; §3.3) are also 2MASS sources. Based on the X-ray
sources that lie within of Guide Star Catalog stars (not
including the BP Psc source), we estimate the absolute astrometric
accuracy of the two-part Chandra pointing to be .
3 Results
3.1 The X-ray source at BP Psc
In Fig. 1 we display the wide-field H image originally published in ZMS08 alongside the broad-band (0.5–8.0 keV) Chandra/ACIS image of the same field surrounding BP Psc. The comparison reveals that Chandra has detected a faint, point-like X-ray source at the position of BP Psc. Source detection indicates a background-subtracted count rate of 0.240.07 ks-1 for this source, or source photons detected during the ks exposure. The BP Psc X-ray source lies at J2000 coordinates 23:22:24.72, 02:13:41.66, with a positional uncertainty that is dominated by the estimated astrometric accuracy (0.2′′). Given the uncertainties, this X-ray position is precisely coincident with that of the 2MASS position of BP Psc (23:22:24.70, 02:13:41.40) as well as with the centroid of submillimeter continuum emission from BP Psc (23:22:24.720.02, 02:13:41.550.2; ZMS08). Analysis of photon arrival times (via a Kuiper test against a Poisson process; Press et al. 1992) yields no evidence that the BP Psc source is variable, although we are unable to rule out source variability.
Given the small number of photons detected, it is not reasonable to attempt to deduce the characteristic source temperature and line-of-sight absorbing column and, hence, intrinsic source flux via standard X-ray spectral analysis. However, useful constraints on and can be obtained via the median energy of the detected source photons. Specifically, Feigelson et al. (2005) demonstrated that Orion Nebula Cluster (ONC) pre-MS star X-ray sources detected by Chandra/ACIS-I display a relatively tight correlation between median X-ray energy and . Getman et al. (2010) refined and further generalized the Feigelson et al. (2005) results, demonstrating (via spectral simulations) that the relationship between median X-ray energy and should in principle apply to any source that can be modeled in terms of two-temperature optically thin thermal plasma emission suffering intervening absorption, and is applicable over a wide range of intrinsic source luminosity (i.e., for from to erg s). As the Getman et al. analysis was carried out for sources detected on the front-illuminated ACIS CCDs (I0-I3), which have lower QE than CCD S3 at low energy (i.e., photon energies keV), application of the Getman et al. methods might result in an underestimate in the value of obtained via the median photon energy of a source on S3. This is unlikely to be an important effect for a source as hard as that detected toward BP Psc in 2009, however, especially given the overall degradation in the soft ( keV) X-ray sensitivity of ACIS in the decade since Chandra’s launch222http://cxc.harvard.edu/cal/memos/contam_memo.pdf,
To determine the median detected photon energy for the BP Psc source, we applied the ACIS Extract (AE) software package 333The ACIS Extract software package and User’s Guide are available at http://www.astro.psu.edu/xray/acis/acis_analysis.html. (Broos et al. 2010) to extract and analyze the source photons. Doing so, we find the median background-subtracted photon energy of the BP Psc source in the 0.5–8.0 keV energy band is 3.470.33 keV. This median energy corresponds to an absorbing column , based on the “best model family” determined from the Getman et al. (2010) statistical spectral analysis method (we display the AE-extracted X-ray spectral energy distribution of BP Psc, overlaid with the Getman et al. “best model family” spectral model, in Fig. 2). The Getman et al. (2010) method yields an estimated apparent (measured) broad-band flux of erg cm-2 s-1 (0.5–8.0 keV), corresponding to an intrinsic flux erg cm-2 s-1. The measured and intrinsic hard-band (2.0–8.0 keV) fluxes are erg cm-2 s-1 and erg cm-2 s-1, respectively. Although the statistical error on the broad-band intrinsic flux () is small (%), the value of is uncertain by almost a factor of 5 (and the hard-band intrinsic flux is uncertain by a factor 2), due to systematic uncertainties in determining the generic spectral model that best describes the BP Psc source (see Getman et al. 2010, their Fig. 1). However, the foregoing estimates for apparent and intrinsic flux are consistent with those we obtained via simple simulations to match the BP Psc source ACIS-S3 count rate using absorbed thermal plasma models ranging in temperature from to 3.0 keV — a range typical of coronal sources with median photon energies similar to that of BP Psc (Feigelson et al. 2005; also see §4) — assuming cm-2.
From the preceding results for and , we estimate that the X-ray luminosity of the BP Psc source is erg s-1 where is the distance in pc. Adopting a bolometric luminosity erg s-1 for the star (ZMS08), and allowing for the (large) systematic errors in obtained via the Getman et al. (2010) method, we conservatively conclude that lies in the range to , with a best estimate of .
3.2 Limits on diffuse X-ray emission
As is apparent from inspection of Fig. 1, no diffuse X-ray emission is associated with the jets and bow-shock-like Herbig-Haro (HH) objects emanating from the position of BP Psc. This result is not particularly surprising, considering such emission should be very soft; indeed, there are few examples of shock-generated X-ray emission among pre-MS jet/HH systems, and the handful that have been detected to date generally display low X-ray luminosities (e.g., HH 210 in the ONC, with observed erg s-1; Grosso et al. 2006). We estimated an upper limit on the surface brightness of such diffuse X-ray emission from the BP Psc jet system by counting background events within regions centered on the H emission near the tips of the bow shocks seen in optical emission lines. The resulting limit is erg cm-2 s-1 arcsec-2. This corresponds to an upper limit on emergent X-ray luminosity of erg s-1 for any compact () X-ray-emitting knots in the BP Psc jet system.
3.3 Field X-ray sources
If BP Psc is a nearby ( pc), “isolated” classical T Tauri star akin to TW Hya or V4046 Sgr (e.g., Kastner et al. 2008b and references therein), then it could be a member of a sparse group of young (age Myr) stars whose members are quite X-ray luminous relative to the field star population (Zuckerman & Song 2004; Torres et al. 2008; and references therein). If so, there would be a small chance that the square degree field imaged by Chandra (Fig. 1) contains one or more low-mass members of this putative “BP Psc Association.” Such young stars, being close to Earth, should be sufficiently luminous in X-rays as to be readily detectable in our ks Chandra exposure and should be bright near-IR sources (BP Psc itself, though occulted by its disk and not directly detected in the near-IR, has ).
As already noted, however, only one of the roughly dozen X-ray sources detected on CCD S3 — BP Psc itself — is also a 2MASS source. An additional dozen, relatively bright ( count) X-ray sources are detected on S2 (the CCD abutting S3), although some of these sources suffer from poor image quality due to a combination of large off-axis angle and non-optimal detector geometry with respect to the focal surface of the Chandra mirror assembly. Of these S2 sources only one, at 23:22:41.4, =-02:21:23 (J2000) — the bright X-ray source at the extreme southeast corner of the image in the righthand panel of Fig. 1 — can be readily associated with a bright () star (USNO-B1 0876–0839011). Given its USNO and 2MASS catalog magnitudes (, , , , and ) this X-ray-bright object is indeed a candidate young (age Myr), late-type (K3-4) star; but as such it would lie at a distance pc. Furthermore, its proper motion ( = [48, 28] mas yr-1; USNO-B1) is signicantly different from that measured for BP Psc ([44.4, 26.3] mas yr-1; Tycho-2). Hence USNO-B1 0876–0839011 is not associated with BP Psc, whether or not BP Psc is a young star at pc.
4 Discussion
4.1 The X-ray source at BP Psc
Our Chandra observation of BP Psc has yielded a detection of a faint X-ray point source that is coincident with the bright optical/near-IR and submillimeter emission associated with this unusual field star. The nature of this X-ray emission source is difficult to ascertain, given the small number of photons detected. However, the median energy ( keV) and, hence, the resulting inferred absorbing column density ( cm-2) appear typical of pre-MS star X-ray sources detected within dusty circumstellar disks that are viewed nearly edge-on (Kastner et al. 2005). The large value we infer for , which corresponds to a band extinction of magnitudes (Vuong et al. 2003), is consistent with the fact that the photosphere of BP Psc is thus far only detected indirectly — via scattering off circumstellar dust — in the visible and near-IR (ZMS08).
Given that the median detected photon energy is keV, it would appear that the X-rays detected from BP Psc are too hard to be attributed to internal shocks associated with its jet-launching regions — in contrast to cases in which soft ( keV) X-rays have been detected at the bases of optical jets associated with certain classical T Tauri stars (Kastner et al. 2005; Guedel et al. 2005, 2007b). Indeed, the BP Psc X-ray source spectral energy distribution (Fig 2) reveals no evidence for such a soft X-ray “excess.” Instead, the X-ray photons we have detected would appear to be associated with magnetic reconnection activity near the star. Such magnetic activity, in turn, could be due either to a stellar corona or to star-disk interactions. In either case — given that the stellar photosphere is evidently obscured from direct view, even at near-IR wavelengths (ZMS08) — it would appear that the X-ray source at BP Psc likely represents the first direct detection of radiation from within a few stellar radii of BP Psc itself, and that the X-ray-based value of we have obtained is therefore the only presently available measurement of the extinction toward the star ().
4.2 Constraints on a pre-main vs. post-main sequence nature
The values of X-ray luminosity and (§3.1) inferred from the Chandra detection would appear to place BP Psc at the extreme low end of the (well-determined) X-ray luminosity distributions of T Tauri stars in the ONC (Preibisch & Feigelson 2005) and in Taurus (Guedel et al. 2007a). Specifically, the value of we estimate for BP Psc, erg s-1, places BP Psc well below the median value of for ONC stars in the 3–20 Myr age range (the relevant range if BP Psc is pre-main sequence; ZMS08). Only % of ONC stars display erg s-1 (Preibisch & Feigelson 2005).
In contrast, the inferred range of , to , would place BP Psc well within the (rather broad) distribution of the class of rapidly rotating (FK Com-like) G giants. The dozen or so members of this class range from to , with a median of (Gondoin 2005). Hence, the Chandra identification of a weak X-ray source at the position of BP Psc appears to throw some weight behind a post-main sequence classification for this star — and supports a model in which the detected X-rays most likely arise from coronal activity, as a consequence of its rapid rotation rate (see ZMS08). The large angular momentum required to sustain such rapid rotation, in turn, would seem to be consistent with the notion that BP Psc has recently consumed a companion star (as proposed by ZMS08), and is therefore an FK Com-type star “in the making” (as speculated by Kastner et al. 2008a).
5 Summary and Conclusions
We have used the Chandra X-ray Observatory to detect a weak X-ray point source that is coincident with the centroids of optical/IR and submillimeter continuum emission from the disk-enshrouded, jet-driving field star BP Psc. As the star’s photosphere is obscured throughout the visible and near-infrared, the Chandra X-ray source appears to represent the first detection of BP Psc itself. The Chandra X-ray image yields no detection of the BP Psc jet system, nor evidence that BP Psc is associated with a young stellar group or cluster.
From the median energy of the detected BP Psc source photons ( keV), we infer an absorbing column and an X-ray luminosity erg s-1), with in the range to . The rather large median X-ray energy indicates that the X-rays most likely originate with magnetic activity, as opposed to shocks near the star, and hence are produced either in a stellar corona or in star-disk magnetospheric interaction regions. The inferred values of and are 1–2 orders of magnitude smaller than those typical of low-mass, pre-main sequence stars, but are well within the range observed for rapidly-rotating (FK Com-type) G giant stars. Hence, the Chandra results favor an exotic model wherein the disk/jet system of BP Psc is the result of its very recently engulfing a companion star or giant planet, as the primary star ascended the giant branch.
References
-
Broos, P. S., Townsley, L. K., Feigelson, E. D., Getman, K. V., Bauer, F. E., & Garmire, Gordon P. 2010, ApJ, 714, 1582
-
Feigelson, E.D., et al. 2005, ApJS, 160, 379
-
Getman, K. V., Feigelson, E. D., Broos, P. S., Townsley, L. K., & Garmire, Gordon P. 2010, ApJ, 708, 1760
-
Gondoin, P. 2005, A&A, 444, 531
-
Güdel, M., Skinner, S. L., Briggs, K. R., et al. 2005, ApJ, 626, L53
-
Güdel, M., Briggs, K. R., Arzner, K., et al. 2007a, A&A, 468, 353
-
Güdel, M., Telleschi, A., Audard, M., Skinner, S. L., Briggs, K. R., Palla, F., & Dougados, C. 2007b, A&A, 468, 515
-
Grosso, N., Feigelson, E.D., Getman, K.V., Kastner, J.H., Bally, J., & McCaughrean, M.J. 2006, A&A, 448, L29
-
Kastner, J.H., Zuckerman, B., Weintraub, D.A., & Forveille, T. D.A. 1997, Science, 277, 67
-
Kastner, J. H., Franz, G., Grosso, N., et al. 2005, ApJS, 160, 511
-
Kastner, J. H., Zuckerman, B., & Forveille, T. 2008a, A&A, 486, 239
-
Kastner, J. H., Zuckerman, B., Hily-Blant, P., & Forveille, T. 2008b, A&A, 492, 469
-
Melis, C., Zuckerman, B., Song, I., Rhee, J. H., & Metchev, S. 2009, ApJ, 696, 1964
-
Preibisch, T., & Feigelson, E.D. 2005, ApJS, 160, 390
-
Press, W., et al. 1992, Numerical Recipes (Cambridge U. Press)
-
Rodriguez, D., Kastner, J.H., Wilner, D., & Qi, C. 2010, ApJ, submitted
-
Torres, C.A.O., Quast, G.R., Melo, C.H.F., & Sterzik, M.F. 2008, in Handbook of Star Forming Regions, ed. B. Reipurth, Astron. Soc. Pacific, San Francisco, in prep.
-
Vuong, M. H., Montmerle, T., Grosso, N., Feigelson, E. D., Verstraete, L., & Ozawa, H. 2003, A&A, 408, 581
-
Zuckerman, B., & Song, I. 2004, ARAA, 42, 685
-
Zuckerman, B., Melis, C., Song, I., et al. 2008, ApJ, 683, 1085 (ZMS08)