High temperature behavior of Sr-doped layered cobaltites Y(Ba1-xSrx)Co2O5.5: phase stability and structural properties
Abstract
In this article we present a neutron diffraction in-situ study of the thermal evolution and high–temperature structure of layered cobaltites Y(Ba, Sr)Co2O5+δ. Neutron thermodiffractograms and magnetic susceptibility measurements are reported in the temperature range 20 K 570 K, as well as high resolution neutron diffraction experiments at selected temperatures. Starting from the as-synthesized samples with , we show that the room temperature phases remain stable up to 550 K, where they start loosing oxygen and transform to a vacancy-disordered “112” structure with tetragonal symmetry. Our results also show how the so-called “122” structure can be stabilized at high temperature (around 450 K) in a sample in which the addition of Sr at the Ba site had suppressed its formation. In addition, we present the structural and magnetic properties of the resulting samples with a new oxygen content in the temperature range 20 K 300 K.
pacs:
75.50.-y;75.25.-j;61.05.fm;81.30.Hd1 Introduction
The layered cobaltites RBaCo2O5+δ (R being a rare earth or Yttrium) are a family of magnetic oxides which present a very rich variety of phenomena being intensively studied [1, 2, 3, 4, 5, 6, 7, 8, 9, 10, 11, 12]. The major attraction of this system is that many of its physical properties may be tuned by the interplay of a number of factors: the R cation size, the oxygen non-stoichiometry affecting the Co valence state, the vacancies structural order, and – as we have shown recently [13, 14] – the disorder introduced by doping with different cations, such as Ca and Sr.
The crystal structure of layered cobaltites is always composed of different possible combinations of a main lattice related to a basic perovskite by doubling the cell along the axis due to the stacking sequence of [CoO2]-[BaO]-[CoO2]-[ROδ] planes. In the limiting case [15] all Co atoms present an octahedral oxygen coordination and a mixed valence state 3+/4+. The oxygen vacancies when always locate in the rare earth planes [ROδ]. Therefore, the structure for consists of all Co atoms in a pyramidal oxygen coordination [16, 17] with a mixed valence state 2+/3+. In between, a series of superstructures may form, the most studied one being the so-called “122” superstructure, consisting of an ordered array of 50% Co atoms in octahedral oxygen coordination and 50% in a pyramidal environment and a valence 3+. This array results in a doubling of the cell also along the axis, breaking the tetragonal symmetry found in the other cases, but it only occurs for values very close to 0.5 [18].
In a recent study we have shown that when R=Y, layered cobaltites present phase separation and their ground state corresponds to the coexistence of two distinct antiferromagnetic (AFM) phases [13, 14]. We arrived at this picture after a systematic study of the effects of doping with Ca and Sr, which strongly stabilize each of the two competing phases in the system: a phase with orthorhombic symmetry which adopts a ferrimagnetic state with spin-state order (ferri-SSO), and a phase with tetragonal symmetry which adopts a G-type AFM state. The phase separation scenario has been confirmed in the last couple of years [8, 9, 19, 20], and the complexity of the magnetism and transport properties still calls for further investigation.
Although the most intensively studied aspects of these systems remain the low-temperature properties and their attractive underlying fundamental physics, during the last years an interest has also emerged in the field of cathodes for intermediate temperature solid oxide fuel cells [21, 22, 23, 24, 25, 26, 27, 28]. The ordered nature of layered cobaltites improves transport compared to non-ordered perovskites, combining oxygen transport with good electronic conduction above the metal-insulator transition temperature. Recent studies propose that even better candidates for such applications are the Sr-doped cobaltites Y(Ba0.5Sr0.0)Co2O5+δ due to their excellent area-specific resistance [29].
In this work we extend our study of cobaltites YBaCo2O5+δ, Y(Ba0.95Sr0.05)Co2O5+δ () and Y(Ba0.90Sr0.10)Co2O5+δ () turning to their high–temperature behavior. We have used neutron diffraction techniques to follow the evolution of the different phases in the temperature range 20 K 570 K. Along the experiment the oxygen content was not kept fixed, which gave us the opportunity to study one same sample with different values. In the following, we describe the sequence of phases observed on warming and cooling in samples with and –allowing for oxygen loss– and in sample avoiding oxygen loss. Magnetic susceptibility measurements are presented and discussed in the light of neutron diffraction results and a consistent description is given as a function of dopant concentration, temperature and oxygen content.
2 Experimental methods
The polycrystalline samples used in the present work correspond to those reported in Refs. [13] for and [14] for and . Between the previous and present experiments, samples were stored in a dessicator containing silica gel, at room temperature (RT) and ambient pressure.
Neutron diffraction data were obtained in different experiments at the High Flux Reactor of Institute Laue–Langevin ILL, Grenoble, France. High–temperature thermodiffraction was performed on the high–intensity two–axes diffractometer D20. For samples and we used a wavelength of Å in the range 300 K 570 K. Data were collected on warming and on cooling with programmed ramps of 1.2 K/min. Samples were kept 30 min at 570 K to stabilize the structures. In a second experiment, a wavelength of Å was used to study samples and also at low temperature, in the range 20 K 570 K. Sample was measured on warming from 30 K to 305 K with a ramp of 0.8 K/min. Sample was heated from 20 K to 305 K at 0.8 K/min, then up to 525 K at 1 K/min. The cooling ramp was performed at 2 K/min down to 20 K and finally heated to RT at 0.8 K/min. In all cases the collected diffractograms were saved every 2 min. Sample holders consisted on vanadium cylinders that were not sealed, placed inside the furnace and measured under a vacuum of bar.
In addition, high–resolution data were collected at diffractometer Super–D2B of ILL both before and after the experiment at D20, i.e., after being heated to 570 K. A wavelength of Å was used to obtain patterns at selected temperatures using the high–intensity configuration. Details are described in [13]. The neutron diffraction patterns were processed with the full–pattern analysis Rietveld method, using the program FULLPROF [30] for refining the crystal and magnetic structures. The strategy for the Rietveld refinement was as follows. For the heating ramps, the starting point were the structures reported previously [14] obtained from high resolution D2B data, then used to refine sequentially the neutron thermodiffractograms obtained at D20. Temperature scans where divided into different ranges according to the structural and magnetic order, and for each range the corresponding atomic positions and occupations obtained at D2B were kept fixed (except for oxygen at the adequate sites), while lattice parameters, temperature factors and magnetic moments were allowed to vary. The cooling ramps were refined based on the high resolution data from D2B collected after the high–temperature experiments.
Magnetization measurements were performed using a VSM and SQUID magnetometers at low temperature (5 K 310 K) and a home-made Faraday balance at high temperature (300 K 600 K), under a 5 kOe field, at a warming/cooling rate of 0.7 K/min in a bar air atmosphere. Electrical resistivity measurements were performed between 80 K and 300 K under zero-applied magnetic field using the standard four-probe technique with gold contacts sputtered onto the samples to reduce contact resistance.
3 Results
3.1 Initial room temperature structures
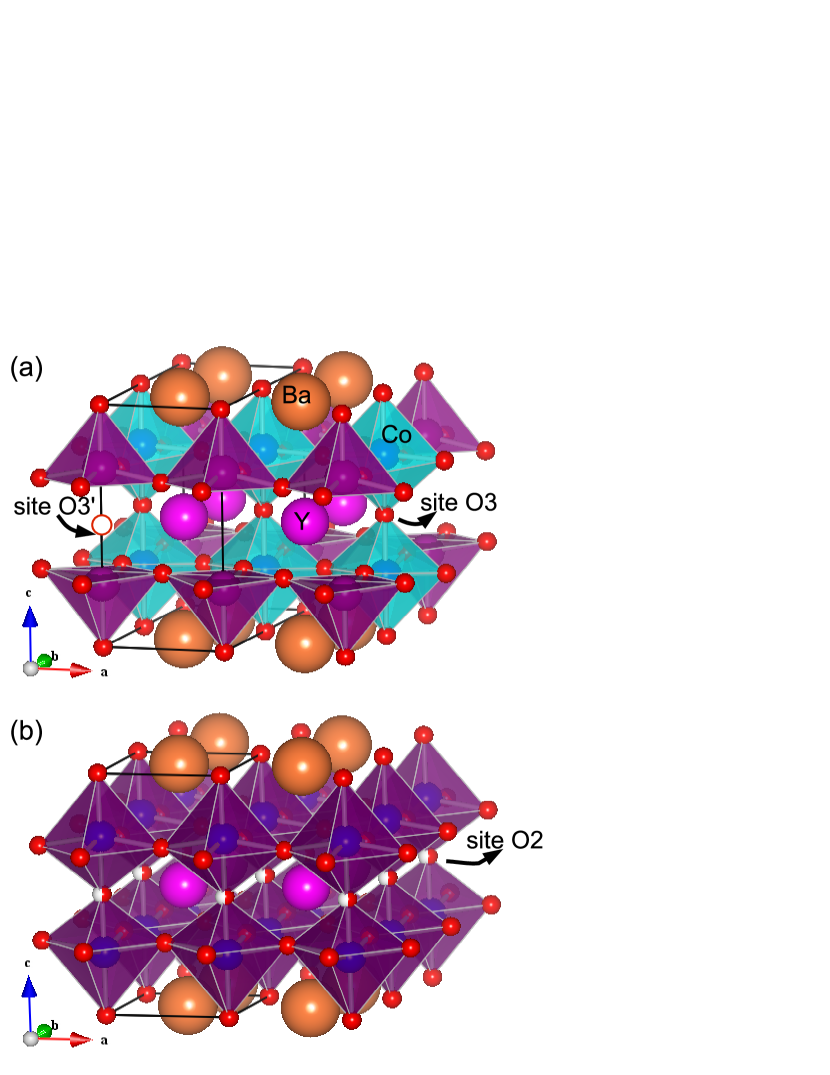
In the first place, let us briefly summarize the starting point for the three samples to be studied at high–temperature. The parent compound, , has been so far intensively studied; and different structures as a function of temperature and oxygen content have been reported [1, 4, 7, 9, 18, 19, 31, 32]. Above RT it is in the orthorhombic space group with a “122” cell (O122-phase, Fig. 1(a)). However, the substitution with Sr at the Ba site gradually favors the stabilization of a tetragonal phase with “112” structure, i.e., with no ordering of oxygen vacancies [14]. For sample the RT state corresponds to a mixture of 80 at.% O122-phase and 20 at.% tetragonal “112” phase (T112-phase, Fig. 1(b)). Sample is already completely tetragonal, showing no significant traces of O-phase neither in the neutron diffraction experiments nor in its magnetization as a function of temperature. In all cases, the initial oxygen content refined from D2B data at and below RT is .
3.2 Evolution of phases upon heating
Samples and
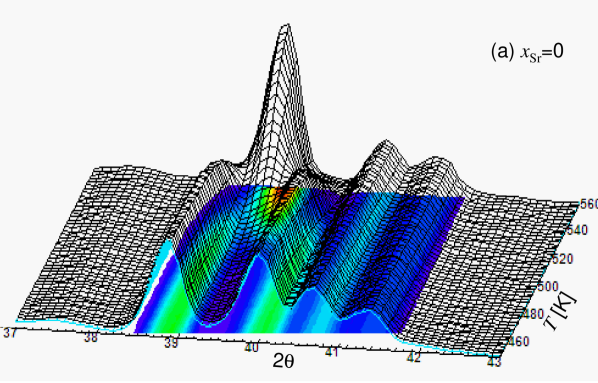
In Fig. 2(a) we present the thermodiffractogram of sample collected on heating from RT to 570 K together with the corresponding projection to the plane, for a selected region showing the Bragg reflections (0 4 0)O and (2 0 0)O collapsing into the (2 0 0)T reflection. This corresponds to a structural phase transition from the to the space group ocurring at 530 K . A similar orthorhombic to tetragonal high-temperature transition has been reported in this family of compounds by Streule et al. [33] for R=Pr, but occurring at a higher temperature, viz., 776 K. That transition corresponds to a disordering of vacancies, given that their measurements were performed in sealed sample holders filled with an inert gas preventing any oxygen loss during the experiment. As we will show below, in our experiment the transition is driven by the oxygen loss and rearrangement of oxygen vacancies.
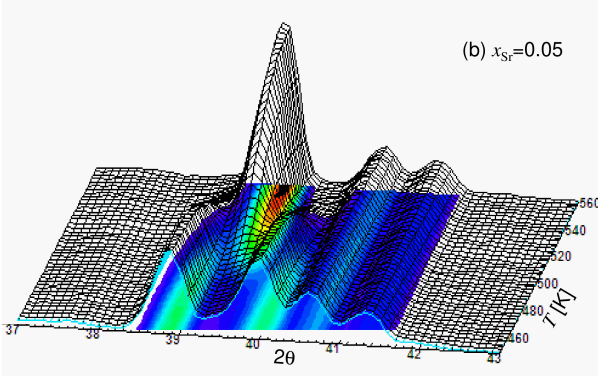
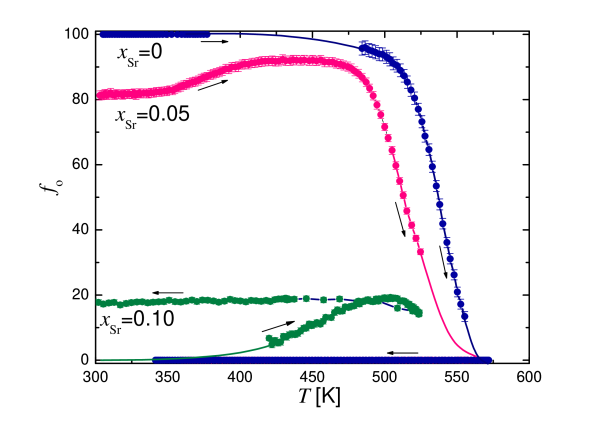
The sample with shows a similar evolution with temperature, as shown in Fig. 2(b). The transition here occurs at a lower temperature ( K), which is consistent with the fact that Sr addition already helps to stabilize the tetragonal structure. However, we observe a slight but noticeable increase in the O122 phase fraction with increasing temperature between 350 K 400 K, which can be interpreted as the gradual stabilization of the O122 phase due to oxygen mobility and its tendency to become ordered, until the oxygen loss leads to the complete transformation to the vacancy-disordered T112 phase. The evolution of the phase fractions for samples and is presented in Fig. 3. At the end of the temperature ramp, both samples were kept at 570 K for 30 minutes and then cooled down to RT with a controlled ramp. The transformation to the T-phase was already complete and irreversible. This was expected considering that the furnace was sealed and with a vacuum of bar so that oxygen was irreversibly lost.
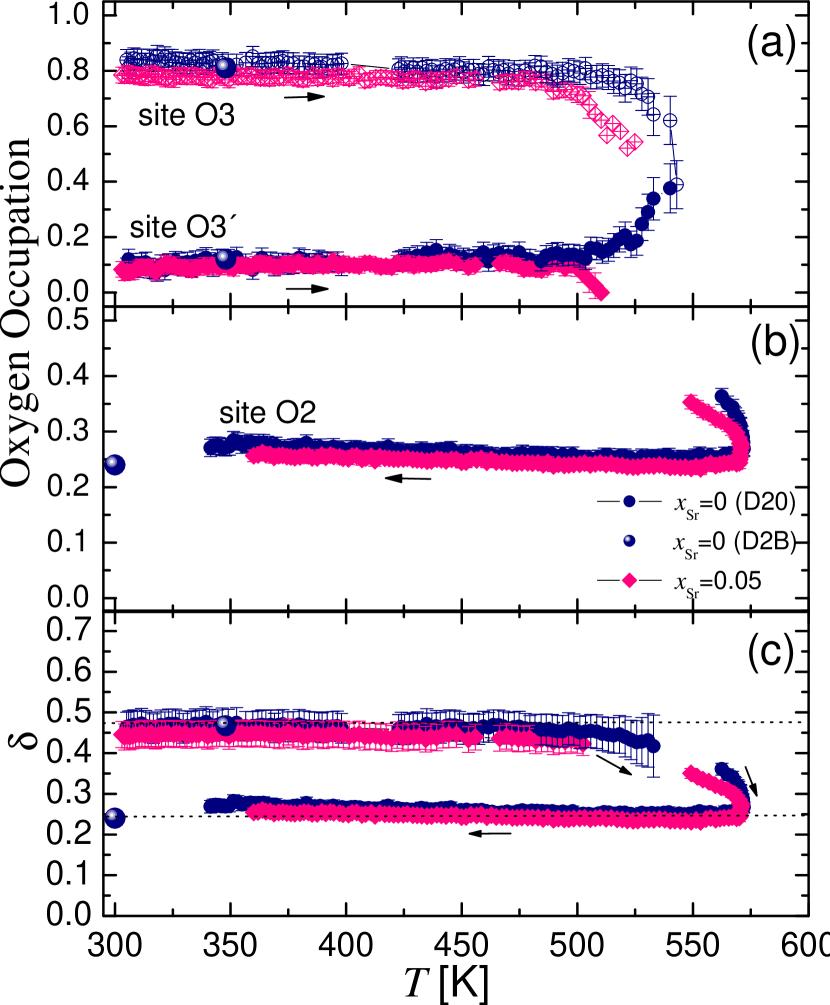
To study the evolution of oxygen vacancies during the heating-dwelling-cooling process, we analysed the occupancies of the relevant crystallographic sites occupied by oxygen atoms, obtained from the
refinement of D20 data. In the notation adopted for the present work, the sites O3O3’ of the space group (O122 phase) are occupied/unoccupied by oxygen atoms located in the [YOδ] plane. They correspond to the apical oxygens which define octahedra and pyramids (Whykoff positions and respectively) and they are indicated in Fig. 1(a). In the ideal “122” structure the site O3 is completely occupied (50% octahedra) and site O3’ is completely empty (50% pyramids), although it is frequent to find a small degree of disorder even at low temperature [13]. In the present refinements, we have allowed for disorder in this array by setting these occupancies as free parameters. The results are presented in Fig. 4(a) for the and samples. The elevated degree of order among pyramids and octahedra remains unaltered just until the transition at 530 K. At this temperature, we observe for the sample a sudden rearrangement of vacancies, leading to both sites having the same occupancy (0.5), in agreement with the transition to the T112 phase in which pyramids and octahedra are distributed randomly. For the sample the same rearrangement occurs, although it is not so neatly observed: it should be noticed that in this sample there is already a fraction of T phase in coexistence blurring the results.
After the transition, data were refined in the tetragonal space group. In this description, oxygen vacancies are still located in the [YOδ] plane defining the apices of the octahedra, but as there is no particular order there is only one crystallographic site for apical oxygen in this structure. In the present notation it is called O2 site (Whykoff position ). When the O2 site is completely occupied then , when completely unoccupied . Figure 4(b) shows the evolution of the O2 site occupancy in the T-phase after the transition. It can be observed that the samples loose oxygen during the final steps of the heating ramp, decreasing the occupancy of the O2 site, and they continue to do so during the 30 minute dwell at 570 K. The bottom
panel (Fig. 4(c)) corresponds to the evolution of the value for both samples. It has been calculated combining data on site occupancies (Occ) and phase fractions (), following the equation
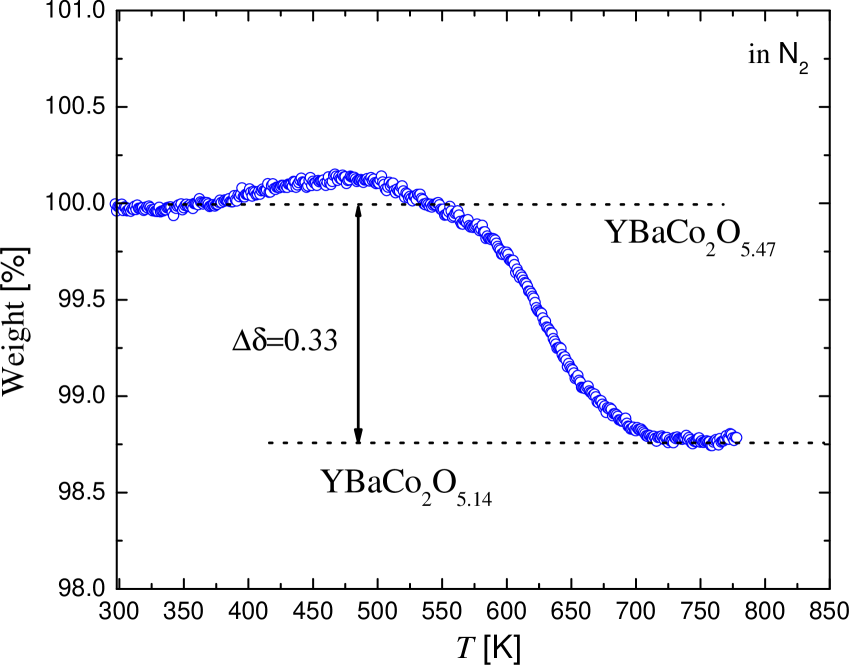
We observe in Fig. 4(c) a smooth transition from the initial value 0.47 to a final value of 0.24 in both samples. The same final value for the oxygen content was also obtained from the refinement of RT high-resolution data collected after the D20 experiments, even after a further structural transition occurs during the cooling ramp, as we will show in the following section, giving consistency to the results. Certainly, a different oxygen content would be atteined by varying the dwell time, until an equilibrium is reached at 570 K under the conditions of vacuum used in the experiment. A thermogravimetric analysis was performed on the parent compound, under a nitrogen flow of 60 cmmin and with a heating rate of min from 298 K to 773 K. Figure 5 shows that the oxygen loss under nitrogen flow begins at around 550-600 K, in good agreement with Ref. [18]. In such conditions, the sample ends with a value of close to under the assumption that the starting oxygen content corresponds to that obtained from the neutron diffraction experiments and that all the weight lost corresponds to oxygen atoms. Note that this final oxygen content is stable from K. Moreover, it is expected that the cobaltites present a larger oxygen loss under nitrogen than under oxygen flow [34], so the final value in both exeperiments seems consistent. For the objectives of the present work, the irreversible oxygen loss in our neutron diffraction experiment was exploited to compare the parent compound and the 5% Sr-substituted samples for an oxygen content much lower than . In addition, the thermal treatment mimics the one performed during the experiments at the Faraday balance (described in the following) and help us understand the behavior observed after cooling again to RT.
Sample
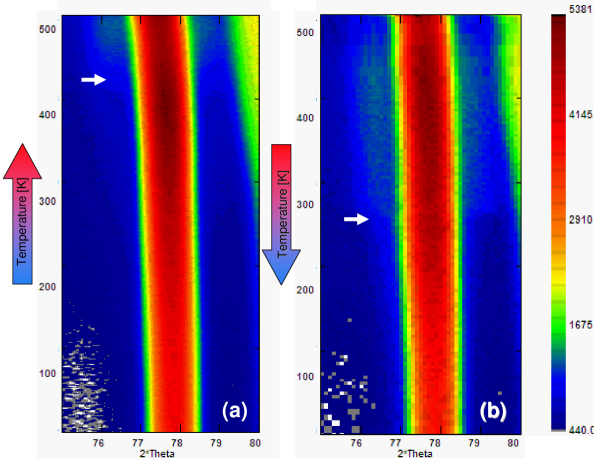
As we mentioned above, the initial state for this sample corresponds completely to the T112-phase although the initial oxygen content is the same as in the other samples. This means that pyramids and octahedra in the structure are still in a ratio close to but, due to the disorder introduced by Sr replacement, they are not anymore ordered along the -axis. However, we observed at high–temperature the unexpected formation of the ordered O122-phase around 425 K. To illustrate this, the diffraction data collected on warming projected to the plane, for the Bragg reflection (2 0 0)T are presented in Fig. 6(a). The arrow indicates the onset of the O122 phase, showing up as rather diffuse shadows (actually, the (0 4 0)O and (2 0 0)O Bragg reflections of the O122-phase) at each side of the major (2 0 0)T reflection. As in the former samples, this small fraction of O-phase begins to transform to a T-phase at 500 K but the transformation could not proceed because the maximum temperature reached by the furnace this time was 525 K for technical reasons. This can be observed in Fig. 3 for the phase fraction of the O-phase. The warming ramp ends with a sample which is 85% in the T-phase and % in the O-phase. But most importantly, there occurs no oxygen loss because the heating stopped before reaching the onset of the desorption, and we immediately started the cooling ramp without a dwell. In Fig. 6(b), where the data collected on cooling are presented, we can see how this phase is retained until the typical distortion of this phase occurs near RT (at the metal-insulator transition temperature) indicated by the arrow in (b) and discussed in the next section.
3.3 Structures retained on cooling
Samples and with
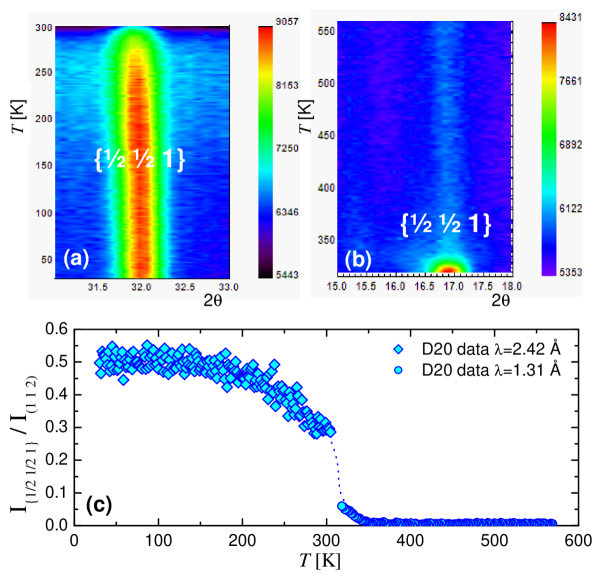
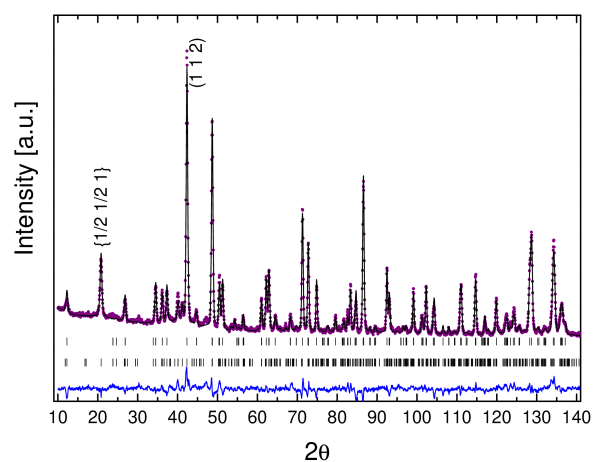
Samples and were kept for 30 minutes at 570 K and then cooled at the same rate (1.2 K/min) down to 343 K () and 313 K (). No transformations were observed upon cooling for the sample. On the other hand, the onset of a magnetic ordering was observed in the sample which was cooled to a lower temperature. This magnetic transition above RT corresponds to a G-type AFM ordering as observed in YBaCo2O5 [35]. It is illustrated in Fig. 7 where we present in panel (b) a projection of the family of magnetic reflections . In panel (c) the intensity of this magnetic peak is plotted normalized to the most intense nuclear reflection (1 1 2). The data presented below RT and the projection in Fig. 7(a) correspond to the second experiment performed in D20 but with a wavelength of 2.42 Å. We can see a smooth transition between both data sets and interpolate them to estimate the magnetic transition temperature. The transition also occurs in our parent compound sample, but unfortunately we could not reach the transition temperature on cooling. However, the high-resolution diffractogram collected at D2B after the experiment confirms that there is a G-type AFM order in the structure. It has been reported by Vogt et al. [35] that the magnetic transition is accompanied by a tetragonal to orthorhombic distortion. We have therefore refined the high-resolution data for samples and in the orthorhombic space group (of course as the cell is now “112”) and using a G-type AFM magnetic model for K, 250 K and 300 K. In Fig. 8 we show one of such refinements for sample at 100 K. The most intense magnetic and nuclear reflections are indicated. In Table 1 the structural details of the phase in our samples (for ) are presented, obtained from the refinement of high-resolution data.
-
K K K K Co 0.259(1) 0.2584(6) 0.2584(6) 0.2572(6) O2 0.3111(8) 0.3116(7) 0.3110(5) 0.3101(5) O3 0.2984(8) 0.2963(4) 0.2979(5) 0.2990(5) O4 0.24(1) 0.24(1) 0.24(1) 0.23(1) (Å) 3.8752(6) 3.8731(2) 3.8745(2) 3.8720(2) (Å) 3.8777(6) 3.8763(2) 3.8717(2) 3.8661(2) (Å) 7.4992(4) 7.4993(2) 7.4910(4) 7.4754(4) (Å) 0.70(5) 0.76(5) 0.96(5) 1.18(5) 10.2 5.6 8.5 9.4 18 8.5 17 14 1.4 2.9 3.1 5.6 Co-O distances (Å) (ap) 1.945(7) 1.938(4) 1.936(4) 1.923(4) (pl) 1.976(2) 1.977(1) 1.977(1) 1.976(1) (pl) 1.961(2) 1.959(1) 1.958(1) 1.957(1) (ap) 1.804(7) 1.812(4) 1.810(4) 1.815(4)
Sample and
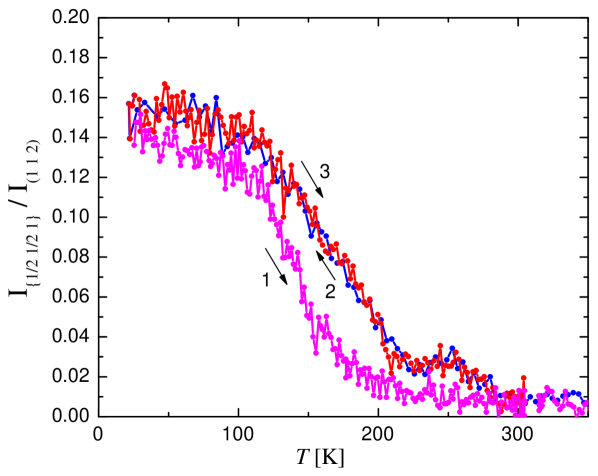
After reaching a maximum temperature of 525 K, the sample with 10% Sr doping was immediately cooled down to 20 K at 2 K/min. The stabilization of the O122-phase observed in the heating ramp was not reverted and the sample kept this 17% O122-phase during the rest of the experiment, as shown in Fig. 12. Upon cooling we observed a series of transitions, which were successfully identified with those expected for the coexistence of the two phases, in the same way as reported in our previous work [14]. The first transition on cooling appears at 285 K and corresponds to the distortion of the O122-phase occurring at the metal-insulator transition temperature [13, 14]. Below this temperature, the O122-phase is expected to present a ferrimagnetic order in a narrow temperature range as in YBaCo2O5.5 and YBa0.95Sr0.05Co2O5.5 [13]. It is also possible that a concommitant structural transition occurs to a monoclinic space group below the metal-insulator transition temperature, as recently proposed by Malavasi et al. [36] and Padilla-Pantoja et al. [32] based on high-resolution synchrotron X-ray diffraction data. Our current data do not allow a refinement of the ferrimagnetic phase, but an increase in the diffracted intensity is observed at the position where the most intense magnetic reflection is to be expected, as shown in Fig. 9. The figure presents the intensity of the most intense magnetic peak (corresponding to the families and ) normalized to the most intense nuclear reflection. The numbers in the figure correspond to the sequence of thermal treatments applied to the sample. Number 1 corresponds to data collected on warming of the original sample. Number 2 corresponds to data obtained on cooling after the sample had been heated to 525 K and 3 corresponds to the subsequent warming to RT. The curve measured before the high–temperature treatment indicates that there is only one magnetic phase in the sample, corresponding to the AFM-G order in the T-phase, which is consistent with the monophasic nature of the sample at RT. However, after having heated to 525 K, there appears a small bump in the intensity between 220 K and 285 K which is consistent with the ferrimagnetic order in the O-phase. The remaining 83% T-phase in the sample transforms to AFM-G below 200 K, in excellent agreement with the behavior described in our previous work [14].
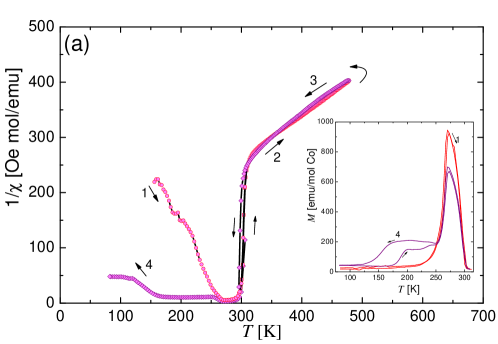
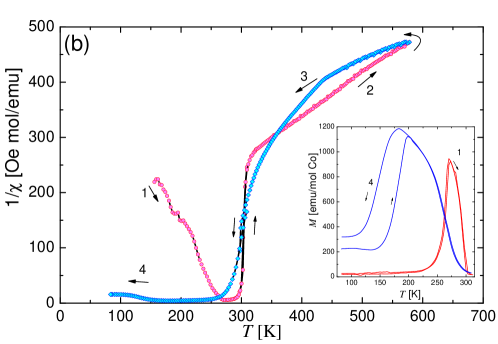
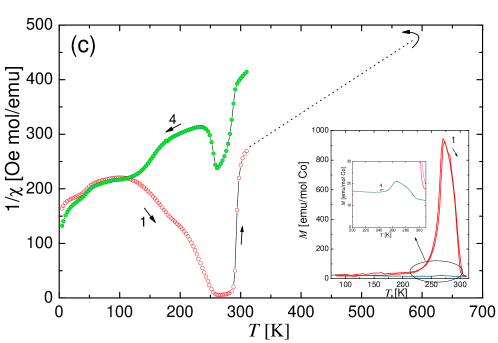
The thermal effects on the magnetic behavior of the parent compound are also reflected on the susceptibility measurements. Figure 10 shows the temperature dependence of the inverse susceptibility of the parent compound during and after three different thermal treatments. In panel (a) the original sample was warmed to 473 K and immediately cooled to RT in the Faraday balance. The inverse susceptibility data on warming and cooling do not show any change above 300 K, but when the low-temperature magnetization was measured again after the experiment, the resulting curve was different. The low field magnetization (inset in Fig. 10(a)) suggests the presence of a second magnetic phase. Given that we do not expect any significant oxygen loss when heating to 473 K, this result points to a rearrangement of oxygen vacancies and again highlights the competition of phases. It is clear that the magnetization is the most sensitive property even to slight variations in the amount and degree of order of oxygen atoms. Panel (b) shows the results of a similar experiment, but this time the sample was heated up to 573 K in the Faraday balance. As we have seen in our neutron diffraction experiments, at such temperature we do expect some oxygen loss. Effectively, although the sample was immediately cooled, the inverse susceptibility curve measured on cooling is different to the one measured on warming. The magnetization curve also changes dramatically after the thermal treatment, and indicates a new value of to 0.45 [1] which agrees very well with the loss of mass of our sample. Moreover, the RT symmetry results tetragonal instead of orthorhombic as determined by X-ray diffraction (data not shown) in line with the work by Akahoshi [1]. In the inset of Fig. 10(c) we present the magnetization curves collected before and after the experiment at ILL, where the sample was heated to 570 K and kept there for 30 minutes before cooling. The magnetization curve agrees well with data from [1] for the refined value of 0.24.
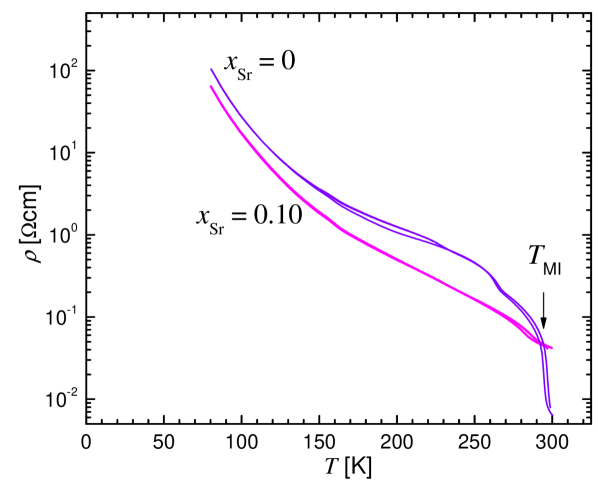
Finally, we include here a brief comment on transport properties. It has been shown that the metal-insulator transition is only observed in the O-phase, i.e., for values very close to 0.5 [2]. The T-phase, on the other hand, presents a higher resistivity above RT and behaves as a semiconductor. To illustrate this, we present in Fig. 11 the resistivity curves under zero-applied magnetic field collected for samples with and with , for the samples before been heated to high-temperatures. It must be emphasized that even though this is called a metal-insulator transition, the behavior above RT of the O-phase is not actually metallic, but also semiconductor-like with a lower activation energy. On the other hand, it has been shown for GdBaCo2O5+δ that the high–temperature T-phase is metallic [22] so further work on transport properties is in progress to study the role of vacancies.
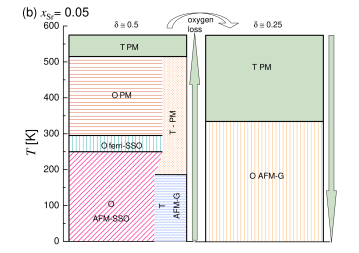
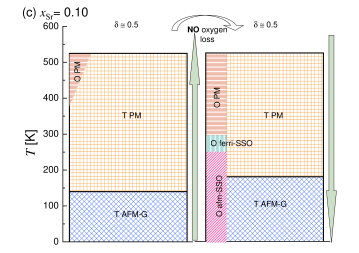
To sum up, the series of phases and transformations observed in our whole set of experiments for the Sr-substituted samples are summarized in Fig. 12. The column on the left represents the evolution on warming, while the column on the right corresponds to the subsequent cooling. Once again, it results striking how complex the phase diagram is for when compared to lower values. However, this complexity is quite consistent among the different samples and the phase separation scenario is clearly confirmed. For the O-phase to stabilize in this system, it is necessary to get very close to : a value of already presents tetragonal symmetry. The cation disorder at the Ba site also favors the T-phase. On the contrary, an increase in temperature favors the stabilization of the O-phase probably due to oxygen mobility, but the sample needs to be heated in an adequate atmosphere to prevent oxygen loss, otherwise it will transform to the T-phase. As we have shown above, these transformations may have profound implicancies in the transport properties as they certainly have them on the magnetic behaviour, therefore the importance of building a complete phase diagram to finally correlate all these variables.

4 Conclusions
The layered cobaltites RBaCo2O5+δ have received increasing attention in the past years, and there is still much to be studied to understand and systematize all the variables involved in their physical properties. In this paper, a study has been presented of the high–temperature stability and structure of the two major phases in the system, the vacancy-ordered (orthorhombic) 122-phase and the vacancy-disordered (tetragonal) 112-phase. By performing in-situ thermal treatments in the D20 diffractometer we could follow structural and magnetic transitions in real time. Further structural analysis as a function of temperature will be reported in a separate article. In the present work, we have focused on the combined effect of temperature and dopant concentration, as well as that of different oxygen contents as a result of the experimental conditions, to obtain a mapping of these variables over the system’s phase diagram. We observe that the range of stability of the O-phase lies very close to and : the cation disorder at the Ba site favors the T-phase, as well as the vacancy disordering due to oxygen loss at high temperature. On the contrary, an increase in temperature could favor the stabilization of the O-phase in a case in which vacancies were initially disordered, but oxygen loss must imperatively be prevented otherwise the system will transform to the T-phase. The fact that samples with both and show the same final value after a similar thermal treatment confirms our initial assumption that the substitution with Sr (or Ca) has no influence on the oxygen incorporation or desorption, but only the synthesis conditions and thermal history do. The landscape of phases outlined in the present work may be useful for the design of compounds with tuned physical properties. The study of these fascinating cobalt oxides is continuously in progress and further work is necessary to clarify the intimate relation between structure, transport and magnetism.
References
References
- [1] D Akahoshi, Y Ueda, Journal of Solid State Chemistry 156, 355 (2001).
- [2] A Taskin, A Lavrov, Y Ando, Physical Review B 71, 134414 (2005).
- [3] C Frontera, A Caneiro, A Carrillo, J Oró-Solé, J García-Muñoz, Chemistry of Materials 17, 5439 (2005).
- [4] V Plakhty, Y Chernenkov, S Barilo, A Podlesnyak, E Pomjakushina, E Moskvin, S Gavrilov, Physical Review B 71, 214407 (2005).
- [5] D Khalyavin, Physical Review B 72, 134408 (2005).
- [6] C Frontera, J García-Muñoz, A Carrillo, M Aranda, I Margiolaki, A Caneiro, Physical Review B 74, 054406 (2006).
- [7] D Khalyavin, D Argyriou, U Amann, A Yaremchenko, V Kharton, Physical Review B 75, 134407 (2007).
- [8] H Luetkens, M Stingaciu, Y Pashkevich, K Conder, E Pomjakushina, A Gusev, K Lamonova, P Lemmens, H H Klauss, Physical Review Letters 101, 017601 (2008).
- [9] D Khalyavin, D Argyriou, U Amann, A Yaremchenko, V Kharton, Physical Review B 77, 064419 (2008).
- [10] C Frontera, J L García-Muñoz, O Castaño, Journal of Applied Physics 103, 07F713 (2008).
- [11] Y Díaz-Fernandez, L Malavasi, M C Mozzati, Phys. Rev. B 78, 144405 (2008).
- [12] M Motin Seikh, V Caignaert, V Pralong, C Simon, B Raveau, Journal of Physics: Condensed Matter 20, 015212 (2008).
- [13] G Aurelio, J Curiale, R D Sánchez, G J Cuello, Physical Review B 76, 214417 (2007).
- [14] G Aurelio, J Curiale, R D Sánchez, G J Cuello, Journal of Physics: Condensed Matter 21, 326002 (2009).
- [15] T Nakajima, M Ichihara, Y Ueda, Journal of the Physics Society Japan 74, 1572 (2005).
- [16] C Martin, A Maignan, D Pelloquin, N Nguyen, B Raveau, Applied Physics Letters 71, 1421 (1997).
- [17] A Maignan, C Martin, D Pelloquin, N Nguyen, B Raveau, Journal of Solid State Chemistry 142, 247 (1999).
- [18] D Akahoshi, Y Ueda, Journal of the Physics Society Japan 68, 736 (1999).
- [19] D P Kozlenko, Z Jirák, N O Golosova, B N Savenko, The European Physical Journal B 70, 327 (2009).
- [20] B Raveau, M Seikh, V Pralong, V Caignaert, Bulletin of Materials Science 32, 305 (2009).
- [21] A Tarancón, S J Skinner, R J Chater, F Hernández-Ramírez, J A Kilner, Journal of Materials Chemistry 17, 3175 (2007).
- [22] A Tarancón, J Peña Martínez, D Marrero López, A Morata, J C Ruíz-Morales, P Núñez, Solid State Ionics 179, 2372 (2008).
- [23] A Tarancón, D Marrero López, J Peña Martínez, J C Ruíz-Morales, P Núñez, Solid State Ionics 179, 611 (2008).
- [24] Y Liu, Journal of Alloys and Compounds 477, 860 (2009).
- [25] J H Kim, M Cassidy, J T S Irvine, J Bae, Journal of The Electrochemical Society 156, B682 (2009).
- [26] X Zhang, M Jin, Journal of Power Sources 195, 1076 (2010).
- [27] M B Choi, S Y Jeon, J S Lee, H J Hwang, S J Song, Journal of Power Sources 195, 1059 (2010).
- [28] D Tsvetkov, V Sereda, A Zuev, Solid State Ionics 180, 1620 (2010).
- [29] J H Kim, M Cassidy, J T S Irvine, J Bae, Journal of The Electrochemical Society 156, B682 (2009).
- [30] J Rodríguez-Carvajal. Fullprof: A program for rietveld refinement and pattern matching analysis. In: Abstracts of the Satellite Meeting on Powder Diffraction of the XV Congress of the IUCr, Toulouse, France, page 127 (1990).
- [31] L Malavasi, Y Díaz-Fernández, M Cristina Mozzati, C Ritter, Solid State Communications 148, 87 (2008).
- [32] J Padilla-Pantoja, C Frontera, O Castaño, J L García-Muñoz, Physical Review B 81, 132405 (2010).
- [33] S Streule, A Podlesnyak, E Pomjakushina, K Conder, D Sheptyakov, M Medarde, J Mesot, Physica B: Condensed Matter 378-380, 539 (2006).
- [34] H Hao, L Zheng, Y Wang, S Liu, X Hu, J Rare Earths 25, 275 (2007).
- [35] T Vogt, P Woodward, P Karen, B Hunter, P Henning, A Moodenbaugh, Phys. Rev. Lett 84, 2969 (2000).
- [36] L Malavasi, M Brunelli, Y Díaz-Fernández, B Pahari, P Mustarelli, Physical Review B 80, 153102 (2009).