An expanding HI photodissociated region associated with the compact HII region G213.880-11.837 in the GGD 14 (catalog ) complex
Abstract
We present high angular and spectral resolution HI 21 cm line observations toward the cometary-shaped compact HII region G213.880-11.837 in the GGD 14 (catalog ) complex. The kinematics and morphology of the photodissociated region, traced by the HI line emission, reveal that the neutral gas is part of an expanding flow. The kinematics of the HI gas along the major axis of G213.880-11.837 shows that the emission is very extended toward the SE direction, reaching LSR radial velocities in the tail of about 14 km s-1. The ambient LSR radial velocity of the molecular gas is 11.5 km s-1, which suggests a champagne flow of the HI gas. This is the second (after G111.61+0.37) cometary HII/HI region known.
Subject headings:
HII regions, ISM: individual objects (GGD 12-15, GGD 14, G213.880-11.837), radio lines: ISM1. Introduction
The spatial morphology, abundance, and kinematics of the neutral gas around compact HII (CHII) regions and its relation with other physical parameters remains poorly studied for most HII regions. To date, only a few photodissociated regions (PDR) have been observed at radio wavelengths with high angular resolution (e.g. Lebrón & Rodríguez, 1997; Gómez et al., 1998; Garay et al., 1998; Brogan et al., 1999; Lebrón et al., 2001; Cappa et al., 2008). GGD 14 (catalog ) is an active star forming region, part of the group of red nebulous objects GGD 12/13/14/15 (Gyulbudaghian, Glushkov, & Denisyuk, 1978) embedded in the Monoceros molecular cloud at a distance of d1 kpc (Rodríguez et al., 1980). There is an extended (1.8 pc) bipolar outflow in the region, traced by CO emission with a major axis along the NW-SE direction (Rodríguez et al., 1982; Little et al, 1990; Qin et al., 2008). This bipolar outflow seems to be excited by a small region of free-free emission (named VLA 7 by Gómez, Rodríguez & Garay, 2000), possibly a thermal jet (Eisloffel et al., 2000). The powering source of this bipolar outflow is also associated with an H2O maser (Rodríguez et al., 1982), a hydrogen molecular emission object (Fang & Yao, 2004) and coincident in position with a class I/0 source, recently detected in the mid-infrared (IRS 9Mc; Sato et al., 2008).
The GGD 14 (catalog ) star forming region contains a cluster of radio sources dominated by the compact (0.01 pc) cometary-shaped HII region (VLA 1; G213.880-11.837), which is excited by a B0.5 ZAMS star (Rodríguez et al., 1980; Kurtz et al., 1994; Gómez et al., 1998; Gómez, Rodríguez & Garay, 2000, 2002) and is associated with IRAS 06084-0611. A detailed kinematic study of the gas within the cometary HII region, presented by Gómez et al. (1998), shows that the ionized gas is undergoing a champagne flow with the head of the ionized champagne flow located to the NW and the extended emission toward the SE. There is a velocity gradient along the major axis of the ionized champagne flow with the LSR radial velocity increasing from 11 km s-1 at the head of the flow to 15 km s-1 at the tail. In a champagne flow the velocity at the head is expected to be very similar to the velocity of the ambient molecular gas, and this is the case for the champagne flow in GGD 14 where the ambient velocity is about 11 km s-1 (Torrelles et al., 1989; Qin et al., 2008).
In addition of the ionized champagne flow, Gómez et al. (1998) reported the existence of an unresolved PDR surrounding the ionized gas. The distribution of the molecular gas in the GGD 14 (catalog ) region is complex with the presence of different velocity components (Rodríguez et al., 1980; Güsten & Marcaide, 1986; Torrelles et al., 1989; Little et al, 1990; Anglada et al., 1996). Recent 13CO(21) observations by Qin et al. (2008) toward the GGD 14 (catalog ) region show that the molecular emission peaks at a velocity of 11.5 km s-1, that could be considered as the velocity of the ambient molecular gas.
In the present work we analyze new HI 21 cm line observations toward the cometary HII region G213.880-11.837 in GGD 14 (catalog ) with higher angular (15′′) and spectral (1 km s-1) resolution than the data presented by Gómez et al. (1998). These new observations resolve the morphology of the HI region that surrounds the ionized material. In §2 we present the observations, in §3 the results, in §4 an interpretation of the HI observations, and in §5 the conclusions.
2. Observations
The HI 21 cm ( = 1420.406 MHz) observations toward the star forming region GGD 14 (catalog ) were made using the Very Large Array (VLA) of the NRAO111The National Radio Astronomy Observatory is operated by Associated Universities, Inc., under cooperative agreement with the National Science Foundation.. The observations were taken on December 23, 1998 in the C configuration (under project AL459). The total bandwidth of 0.781 MHz was centered at a VLSR of 12 km s-1, with 256 channels 0.64 km s-1 wide each (3.1 kHz). Hanning smoothing was applied to the line resulting in a spectral resolution of 1.2 km s-1. The flux density scale was determined from observations of the amplitude calibrator 0134+329, for which a flux density of 15.87 Jy was adopted. The phase calibrator was 0605-085 for which a bootstrapped 1.4 GHz flux density of 2.11 0.01 Jy was obtained. The data were edited and calibrated following standard procedures and images were made using the NRAO software AIPS. Line images were made by subtracting the continuum (line-free) channels from the visibility data using the task UVLSF. The images were made with the task IMAGR, using the ROBUST parameter equal to zero (Briggs, 1995), resulting in a synthesized beam of 17 14, P.A.=26∘. The noise level in a single spectral line channel, after Hanning smoothing, is 2.0 mJy beam-1.
3. Results
The detected radio continuum emission at 21 cm, made with the line-free channels, is marginally resolved (4329, P.A.=148∘), with a flux density of 722 mJy and peak position at (2000)= 06h 10m 50607 0004, (2000)=06∘ 11′ 5010 005. The HI 21 cm line, is detected both in absorption and emission in the velocity range from 1 to 20 km s-1, in agreement with previous results reported by Gómez et al. (1998).
Figure 1 shows the HI 21 cm spectrum integrated over the whole source in a box with size of 1313. As was noted by Gómez et al. (1998), the HI absorption component is considerably broad towards blueshifted velocities, showing three minima and extending from velocities of 1 km s-1 to 12 km s-1. In Table 1 we present the results of a Gaussian fit for the three HI absorption components plus a single Gaussian for the emission component (the fit is shown as a dashed-line in Figure 1). In this Table we give the peak flux (Sl), the center velocity (VLSR) and the FWHM (full width at half maximum) of the line (V) for each Gaussian component. The HI absorption components are centered at VLSR of 1, 6 and 11 km s-1 (see Table 1). On the other hand, the HI emission is present in a velocity range from 13 to 20 km s-1, with the maximum centered at VLSR=15.5 km s-1 (Figure 1 and Table 1).
Figure 2 shows individual channel images of the HI 21-cm line toward GGD 14. The unresolved HI absorption appears coincident with the 1.4 GHz continuum peak position (named VLA 1 by Gómez, Rodríguez & Garay, 2000), marked with a cross. The triangle, towards the NE of the CHII region, indicates the radio continuum peak position of the radio source VLA 7, which has been proposed as the exciting source of the bipolar outflow (Gómez, Rodríguez & Garay, 2000, 2002) and is coincident with the H2O maser emission in the region (Rodríguez et al., 1980). As observed in the HI line in emission, the PDR in GGD 14 appears spatially resolved with a deconvolved angular size of 4540′′, P.A.=34∘ (0.2 pc) and with a peak intensity spatially shifted toward the SE side of the cometary HII region (the PDR peaks at (2000)= 06h 10m 513, (2000)=06∘ 11′ 52′′ 2′′, about 0.1 pc in projected separation from the peak of the CHII region).
4. Discussion
4.1. Physical parameters of the HI line
The individual HI 21 cm channels, toward GGD 14 (Figure 2), show an extended emission component toward the SE and a strong line absorption coincident with the cometary HII region. The PDR, traced by the HI region, is thus being produced mainly by the B0.5 ZAMS star that also ionizes the cometary HII region (VLA1; G213.880-11.837).
It is possible to estimate the HI optical depth toward the CHII region using the HI absorption profile. Assuming that the continuum source is located behind a homogeneous HI cloud, the observed line brightness temperature is given by (see Rohlfs & Wilson, 2003):
where Tex is the excitation temperature of the HI, Tc is the continuum brightness temperature of the CHII region at the frequency of the HI line, fHI and fc are the beam filling factors of the HI and the continuum, f0 is the fraction of the continuum source covered by the HI cloud and is the optical depth of the HI gas at a velocity . In this case, we consider that the continuum source is completely covered by the HI cloud, f0=1. The estimation of the filling factor commonly uses a comparison between the beam solid angle () with the source solid angle (), such that , but other geometric factors can be included.
Since the HI cloud shows a velocity gradient across the region (see Figure 2), we will assume that at the velocity of the absorption feature (V11 km s-1), we only have to take into account the effect of the absorbing gas, neglecting the contribution to the emission (f0), since this occurs mostly at other velocities. Then, the transfer equation at the center of the absorbing line is,
The resulting optical depth value is obtained using the expression:
The beam-averaged brightness temperature of the continuum can be computed from the total flux density (S72 mJy), and the deconvolved angular size measured in the 1.4 GHz continuum image (), by the expression T, with , obtaining Tc=3,600 K. The filling factor is f/, where is the beam size (), thus fc=0.05. The observed line brightness temperature, at the center of the absorbing line T, for S=69 mJy and =15, is 177 K. Then the mean optical depth has a very large value 5. As we note, the derived values for T and fcTc are similar, such that the ratio T/fcTc will be very close to unity, making the estimation of the optical depth very uncertain. Moreover, If we include the uncertainty in the estimated angular size and temperatures, the error in the mean optical depth will be around 60, 53.
A lower limit to the HI mean density can be set by assuming an optical depth, . This assumption is supported by our previous estimate, , but with large uncertainties. Then taking simply 1, T300 K and the FWHM of the line V=2 km s-1 (see Table 1) we can estimate a lower limit for the HI column density, computed in the standard way (Rohlfs & Wilson, 2003),
giving N1.11021 cm-2. This column density is consistent with that expected for PDRs (Hollenbach & Tielens, 1997). We will further assume that the physical depth of the region producing the HI absorption is approximately one half of the diameter of the HI in emission (42′′; 0.2 pc). Therefore an estimate of the average neutral hydrogen density, NHI/L, where L0.1 pc, is 3.5103 cm-3.
The neutral hydrogen mass associated to the HI emission can be obtained assuming a spherical cloud with an HI radius of 21 (0.1 pc) and average hydrogen density 3.5103 cm-3, from the expression , where is the radius of the HI emission region, and is the hydrogen atomic mass. We obtain that the HI mass M(HI)0.4 M⊙. This value should be taken as a lower limit, since the average hydrogen density is also a lower limit. Gómez et al. (1998) used a line emission model for the PDR to estimate the total HI mass, obtaining a value as high as 5 M⊙. Molecular mass estimates, derived from CO, indicate that GGD 14 has a molecular mass in the range from 640 to 1500 M⊙ (Ridge et al., 2003; Higuchi et al., 2009), which means that the PDR mass is very low (1 of the total gas mass). Of course, the PDR around G213.880-11.837 extends only over 1, while the CO is detected over 5 (Higuchi et al., 2009).
4.2. Kinematics of the HI gas in GGD 14
The high optical depth toward the CHII region (1) supports the existence of high density atomic gas, where the cometary CHII region (G213.880-11.837) is embedded. The spatial extension of the cometary HI 21-cm emission (42) is 10 times larger than the ionized CHII region (3.5 at 1.4 GHz). In the champagne model a strong density gradient is required, with the head of the cometary CHII region embedded in the densest part of the molecular clump and the ionized gas expanding asymmetrically out of the dense clump (Garay & Lizano, 1999). For G213.880-11.837, Gómez et al. (1998) interpreted the kinematics of the ionized gas, derived from the H92 line, as a champagne flow due to the presence of a velocity gradient measured from the head (located to the NW with V11 km s-1) to the tail (located to the SE with V15 km s-1).
Recent numerical results, show that an expanding H II region should be an efficient trigger for star formation in molecular clouds if the mass of the ambient molecular material is large enough (Hosokawa & Inutsuka, 2006). In the particular case of the GGD 14 complex, a dense molecular region should exist in the vicinity of G213.880-11.837, where recently a cluster of low-mass pre-main-sequence stars has been found. In addition to the radio continuum compact sources (Gómez, Rodríguez & Garay, 2000, 2002), there are infrared studies in the 2-100 m range (Harvey et al., 1985; Hodapp, 1994; Fang & Yao, 2004) that provide evidence for a recently formed cluster of sources in the vicinity of G213.880-11.837. Fang & Yao (2004) estimated the age of this cluster in the order of 25 106 yrs.
The molecular gas detected toward GGD 14 shows a complex velocity structure with the presence of a CO molecular outflow with the major axis along the NW-SE direction (P.A.=60∘), and centered near the radio source VLA 7. In particular, we note that, in the CO(21) images (Little et al, 1990; Qin et al., 2008), there is strong self-absorption of this line at V11 km s-1, which correspond to the ambient molecular gas velocity. Qin et al. (2008) shows a 13CO(21) spectrum toward this region (not affected by self-absorption), that peaks at a velocity of 11.5 km s-1. In what follows we will assume this value for the ambient molecular gas toward GGD 14. There is also NH3 (Torrelles et al., 1983; Güsten & Marcaide, 1986; Anglada et al., 1996), CS (Anglada et al., 1996) and HCO+ emission (Heaton et al., 1988), toward GGD 14, with velocities in the range from 9 to 12 km s-1. These results point out that there is a dense region in the vicinity of the CHII region that could be responsible of the champagne morphology observed in both the CHII and the HI region.
4.2.1 Champagne HI flow around G213.880-11.837?
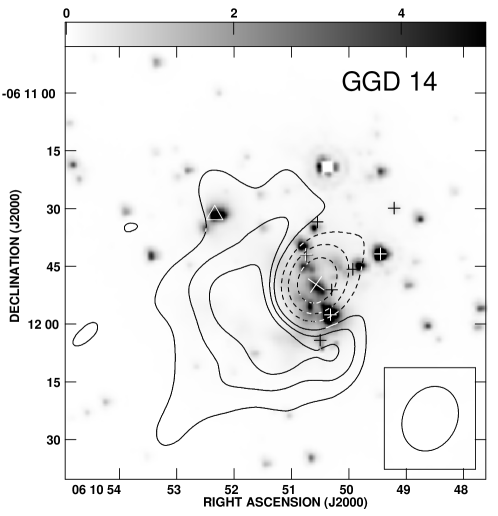
Figure 3 shows a near-IR continuum image at 4.5 m of Spitzer Space Telescope222The Spitzer Space Telescope, is operated by the Jet Propulsion Laboratory, California Institute of Technology under a contract with NASA. toward GGD 14. We used the processed Spitzer IRAC (Fazio et al., 2004) Basic Calibrated Data (PID: 6. PI: Giovanni Fazio), which are available in the archive of the Spitzer Science Center. In this image the stellar cluster is clearly appreciated. We overlay in this image the with integrated HI 21 cm line, from 1 to 20 km s-1. The stellar cluster is mainly located toward the HI absorption region. We notice that the compact radio sources VLA 1 (G213.880-11.837) and VLA 7 have strong 4.5 m counterparts not observed at 2.2 m (Gómez, Rodríguez & Garay, 2002), which suggests that these sources are deeply embedded. The 4.5 m counterpart toward VLA 1 is first reported in this work, and that toward VLA 7 was recently detected by Sato et al. (2008). The near-IR source IRS 9Mc reported by Sato et al. (2008) is localized near VLA 7, and shows a bipolar infrared nebula aligned in the same direction as the bipolar molecular outflow (NW-SE; Rodríguez et al., 1982). We also notice that several of the compact radio sources reported by Gómez, Rodríguez & Garay (2002), indicated with crosses, have 4.5 m counterparts.
Figure 3 shows the velocity integrated HI 21 cm line toward G213.880-11.837, which exhibits a cometary like morphology, resembling (at much larger scales) that of the ionized gas at high frequencies (Tofani et al., 1995; Kurtz et al., 1994; Gómez et al., 1998). The limb brightened PDR expected at the head of the cometary region G213.880-11.837 is not observed. This can be due to the HI absorption feature that complicates the full imaging of the PDR or to the low angular resolution of the HI observations. In the latter case, one can set a lower limit to the HI volume density at the head of the cometary. Assuming a PDR size equal to the beam size, , and a column density of the PDR such that the dust opacity is of order unity, , which is a reasonable density for molecular clouds. Molecular line observations with high spatial resolution are required to try to detect this high density molecular gas at the head of the cometary.
In order to assess whether or not the HI emission is produced by a champagne flow, we made position-velocity diagrams of the HI emission along two perpendicular directions, centered on the CHII region (peak continuum emission). The cuts are at position angles of +25∘ and 65∘ which correspond to the orientations of the minor and major axis of the ionized cometary CHII region (Gómez et al., 1998). Figure 4 shows the PV diagrams of the HI gas along these two directions. They both exhibit absorption and emission features. The spatially unresolved HI line in absorption seen at the position of the CHII region is strikingly broad in velocity, ranging from 5 to 13 km s-1. We also see that at this position the HI emission reaches its maximum redshifted velocities with a value of about 18 km s-1. Qin et al. (2008) have shown that the velocity of the ambient molecular gas toward GGD 14 is 11.5 km s-1. We interpret these two features as indicating the presence of an expanding shell of HI gas around the CHII region, with an expansion velocity of about 6.5 km s-1.
The PV diagram along the position of 65∘ shows that the emission is very extended toward the SE direction, reaching velocities in the tail of about 14 km s-1. Since the ambient velocity of the molecular gas is 11.5 km s-1, we interpret the PV structure seen SE of the CHII region as indicating a champagne flow of the HI gas. In a champagne flow the gas accelerates to 2 3 times the sound speed (see Table 2 of Shu et al., 2002). Since the observed velocity shift in the ionized gas is 15 km s 11 km s-1 = 4 km s-1 (Gómez et al., 1998) while a shift of 20 30 km s-1 is expected, this ionized flow can be understood as a champagne flow only if the source is inclined close to the plane of the sky, with an angle , and has a small opening angle. Gómez et al. (1998) correctly interpreted the kinematics of the ionized gas as a champagne flow but they did not estimate the inclination angle of the flow with respect to the plane of the sky, they only suggest that the tail should be going away to explain the redshifted velocities. In the present interpretation we propose that in fact the orientation of the ionized champagne flow should be close to the plane of the sky with the tail having the redshifted velocities. On the other hand, in a PDR, one expects gas temperatures of K, i.e., sound speeds 2 km s-1. Thus, for a champagne flow in the HI neutral gas, the expected velocity shift is of the order of 4 6 km s-1. Thus, the observed velocity shift, 3 km s-1, is consistent with a champagne flow of the HI gas, with a large opening angle such that the observed velocity in the line-of-sight is small. Note that the scale of this HI flow is 10 times larger than the ionized champagne flow, therefore, the collimation of this HI neutral gas is probably much lower supporting the presence of a larger opening angle.
In contrast, in the cut along the perpendicular direction to the symmetry axis passing through the HII region (P.A.=+25∘), the HI gas in emission is seen at both sides of the cometary head and no velocity gradient is appreciated. High angular resolution molecular observations are needed to confirm this kinematics. Another HII region that shows a cometary morphology in both the continuum and HI emission is G111.61+0.37, where a champagne interpretation was also proposed (Lebrón et al., 2001).
Hydrodynamical and radiative transfer models by Hosokawa (2007) show that an inhomogeneous medium can change the time evolution of expanding HII regions and PDRs (as compared with the evolution in a homogeneous medium). In a medium with a radial density profile of the form with , the dense shell formed by the shock front shields the far-ultraviolet (FUV) radiation and prevents the expansion of the dissociation front beyond the shell. The CHII region is surrounded by a cold molecular envelope in this case. In a stepper density gradient with , as expected in a “champagne flow,” shielding of the FUV radiation becomes inefficient and an extended PDR develops around the HII region. However, only if , the H2 dissociation front propagates through the ambient cloud. Since in G213.880-11.837 and G111.61+0.37 we observe extended PDRs around the HII regions, it is likely that steep density gradients exist in both objects.
5. Conclusions
We present high angular resolution (15) VLA observations of the HI 21 cm line toward the compact HII region G213.880-11.837. The HI gas, produced by a photodissociated region around the CHII region, exhibits a cometary morphology with an extension, along the major axis, of 45. The kinematics and morphology of the HI gas around G213.880-11.837 indicates that the neutral hydrogen gas is in expansion in a similar way as the ionized gas. In both cases the gas accelerates toward lower density regions and redshifted velocities (from 11 to 14 km s-1). The peak position of the HI absorption coincides with the peak continuum emission of the CHII region (VLA 1; G213.880-11.837). This is the second (after G111.61+0.37) cometary HII/HI region known. These observations suggest the existence of champagne flows in PDRs associated with cometary HII regions.
References
- Anglada et al. (1996) Anglada, G., Estalella, R., Pastor, J., Rodríguez, L. F. & Haschick, A. D. 1996, ApJ, 463, 205
- Briggs (1995) Briggs, D. 1995, Ph.D. thesis, New Mexico Institute of Mining and Technology
- Brogan et al. (1999) Brogan, C. L., Troland, T. H., Roberts, D. A., & Crutcher, R. M. 1999, ApJ, 515, 304
- Cappa et al. (2008) Cappa, C., Niemela, V. S., Amorín, R. & Vasquez, J. 2008, A&A, 477, 173
- Eisloffel et al. (2000) Eisloffel, J., Mundt, R., Ray, T. P., & Rodríguez, L. F. 2000, Protostars and Planets IV, 815
- Fang & Yao (2004) Fang, M., & Yao, Y. Q. 2004, ChA&A, 28, 308
- Fazio et al. (2004) Fazio, G. G. et al. 2004, ApJS, 154, 10
- Garay et al. (1998) Garay, G., Gómez, Y. Lizano, S., & Brown, R.L. 1998, ApJ, 501, 699
- Garay & Lizano (1999) Garay, G. & Lizano, S. 1999, PASP, 111, 1049
- Gómez et al. (1998) Gómez, Y. Lebrón, M., Rodríguez, L. F., Garay, G., Lizano, S., Escalante, V., & Cantó, J. 1998, ApJ, 503, 297
- Gómez, Rodríguez & Garay (2000) Gómez, Y., Rodríguez, L. F. & Garay, G. 2000, ApJ, 531, 861
- Gómez, Rodríguez & Garay (2002) Gómez, Y., Rodríguez, L. F. & Garay, G. 2002, ApJ, 571, 901
- Güsten & Marcaide (1986) Güsten, R. & Marcaide, J. M. 1986, A&A, 164, 342
- Gyulbudaghian, Glushkov, & Denisyuk (1978) Gyulbudaghian, A.L., Glushkov, Yu. I., & Denisyuk, E.K. 1978, ApJ, 224, L137
- Harvey et al. (1985) Harvey, P. M., Wilking, B. A., Joy, M., Lester, D. F. 1985, ApJ, 288, 725
- Heaton et al. (1988) Heaton, B. D., Little, L. T., Andersson, M. & Dent, W. R. F. 1988, A&A, 203, 99
- Higuchi et al. (2009) Higuchi, A. E., Yasutaka, K., Masao, S. & Ryohei, K. 2009, ApJ, 705, 468
- Hodapp (1994) Hodapp, K. W. 1994, ApJS, 94, 615
- Hollenbach & Tielens (1997) Hollenbach, D. J., & Tielens, A. G. G. M. 1997, ARA&A, 35, 179
- Hosokawa & Inutsuka (2006) Hosokawa, T. & Inutsuka, S-i. 2006, ApJ, 646, 240
- Hosokawa (2007) Hosokawa, T., 2007, A&A, 463, 187.
- Kurtz et al. (1994) Kurtz, S., Churchwell, E. & Wood, D. O. S. 1994, ApJS, 91, 659
- Lebrón & Rodríguez (1997) Lebrón, M. & Rodríguez, L.F. 1997, Rev. Mexicana Astron. Astrof., 33, 165
- Lebrón et al. (2001) Lebrón, M. E., Rodríguez, L. F., & Lizano, S. 2001, ApJ, 560, 806
- Little et al (1990) Little, L. T., Heaton, B. D. & Dent, W. R. F. 1990, A&A, 232, 173
- Qin et al. (2008) Qin, Sheng-Li, Wang, Jun-Jie, Zhao, G., Miller, M. & Zhao, Jun-Hui, 2008, A&A, 484, 361
- Ridge et al. (2003) Ridge, N. A., Wilson, T. L., Megeath, S. T., Allen, L. E. & Myers, P. C. 2003, AJ, 126, 286
- Rodríguez et al. (1980) Rodríguez, L.F., Moran, J.M., Ho, P.T.P., & Gottlieb, W. 1980, ApJ, 235, 845
- Rodríguez et al. (1982) Rodríguez, L. F., Carral, P., Ho, P. T. P. & Moran, J. M. 1982, ApJ, 260, 635
- Rohlfs & Wilson (2003) Rohlfs, K. & Wilson, T. L., ’Tools of Radio Astronomy’, Springer 2003 4th Edition, pp. 319.
- Sato et al. (2008) Sato, Y. et al. 2008, PASJ, 60S, 429
- Shu et al. (2002) Shu, F. H., Lizano, S., Galli, D., Cantó, J., & Laughlin, G. 2002, ApJ, 580, 969
- Tofani et al. (1995) Tofani, G., Felli, M., Taylor, G. B. & Hunter, T. R. 1995, A&AS, 112, 299
- Torrelles et al. (1983) Torrelles, J. M., Rodríguez, L. F., Cantó, J., Carral, P., Marcaide, J., Moran, J. M. & Ho, P. T. P. 1983, ApJ, 274, 214
- Torrelles et al. (1989) Torrelles, J. M., Verdes-Montenegro, L., Ho, P. T. P., Rodríguez, L. F., & Cantó, J. 1989, ApJ, 346, 756


| Sl | VLSR | V |
|---|---|---|
| (mJy) | (km s-1) | (km s-1) |
| -9836 | 1.20.6 | 31 |
| -4924 | 6.41.5 | 53 |
| -6927 | 11.10.6 | 21 |
| 26718 | 15.50.1 | 41 |