Unveiling First Order CMR Transitions in the Two-Orbital Model for Manganites
Abstract
Large scale Monte Carlo simulation results for the two-orbital model for manganites, including Jahn-Teller lattice distortions, are here presented. At hole density and in the vicinity of the region of competition between the ferromagnetic metallic and spin-charge-orbital ordered insulating phases, the colossal magnetoresistance (CMR) phenomenon is observed with a magnetoresistance ratio . Our main result is that this CMR transition is found to be of first order in some portions of the phase diagram, in agreement with early results from neutron scattering, specific heat, and magnetization, thus solving a notorious discrepancy between experiments and previous theoretical studies. The first-order characteristics of the transition survive, and are actually enhanced, when weak quenched disorder is introduced.
pacs:
75.47.Lx, 75.30.Mb, 75.30.KzIntroduction. The manganese oxides known as manganites continue attracting considerable attention due to the presence of several competing tendencies in their rich phase diagrams, with a variety of spin, charge, and orbital orders otherreviews ; review . Moreover, these compounds display the famous CMR effect, where the resistivity is drastically reduced by fields of a few Teslas. Early theoretical investigations science remarked the importance of phase competition to understand the CMR, which occurs when an insulating state, typically also spin-charge-orbital ordered, is close in energy to the low-energy ferromagnetic (FM) metallic ground state induced by double exchange. These effects were clear in simplified phenomenological models and resistor-network simulations when in the presence of disorder burgy . However, it is important to verify at a more fundamental level if the basic model Hamiltonians that are widely perceived as being realistic for manganites, including double-exchange, superexchange, and lattice distortion tendencies, are indeed compatible with the CMR phenomenology. Recently, our group and others initiated this effort based on Monte Carlo (MC) simulations verges ; kumar ; sen06 ; sen07 . This is a challenging task since computer efforts based on the exact solution of the fermionic sector, for fixed MC-generated classical spin and lattice configurations, have a CPU time growing as , with the number of cluster sites times the number of orbitals. For this reason, recent efforts at realistic electronic densities have used only one orbital, considerably reducing the CPU demands sen07 . However, it is clear that the more complete two orbitals model must be investigated for a full understanding of the CMR physics. Alas, since this is far more time consuming, MC results for two orbitals are only scattered in the literature and they have not reached sufficient accuracy to unveil the true properties of this model in the CMR regime.
In addition, an important qualitative difference still persists with regards to the order of the CMR transitions. Until now, MC simulations carried out at CMR realistic hole densities, such as or , have indicated the presence of a rapid crossover, yet continuous, transition from the low- FM metal to the high- paramagnetic (PM) insulator. This occurs even in the clean limit of the MC simulations, i.e. without quenched disorder. While these results are in agreement with the phenomenology of many CMR manganites review , there are notorious examples where the CMR transition is of first order, such as for PCSMO , SSMO ; SSMO2 , NSBSMO , and others. In fact, early experimental studies already reported signs of irreversibility at the CMR transition for one of the most widely studied manganites, La1-xCaxMnO3 (LCMO) at , suggesting that its transition is weakly first-order lynn96 . Subsequent magnetization and specific heat analysis clarified that indeed the LCMO transition is of first order mitchell . Recent investigations have also addressed the order of the CMR transition, revealing multicritical characteristics in RE0.55Sr0.45MnO3 (RE = Rare-Earth) multicritical .
Our main goal in this publication is to solve this puzzling theory-experiment disagreement by carrying out a large-scale computational study of the two-orbital model for manganites at . It will be shown that our MC data unveils the presence of a first-order CMR FM-PM transition in this realistic model and density.
Model and techniques. The two-orbital model Hamiltonian used here is widely considered the minimal model for the proper description of the electronic properties of manganites and it has been extensively discussed before hotta2001 . For this reason only a schematic description will be here provided. The model is given by hotta-coul . At every Mn site it contains electrons and localized spins. represents the nearest-neighbors double exchange (DE) electron hopping at infinite Hund coupling. This term favors ferromagnetism away from the electronic density . is the coupling between fermions and oxygen breathing and Jahn-Teller lattice distortions, with coupling strength . The sum is Eq.(4) of Ref. sen06, , with the hopping along for orbital , , as the energy unit. is the standard nearest-neighbors Heisenberg antiferromagnetic coupling among the (classical) spins. Finally, is the quenched disorder term, with ( = disorder strength; = bimodal random number 1 or -1).
Details of the computer simulation. The methodology of our MC simulations, based on the fermionic sector exact diagonalization described before, is standard and readers should consult review for details. However, the extensive characteristics of the present MC simulations merits a detailed discussion. The procedure was the following. For the clean-limit results , a random spin and lattice configuration was chosen at the highest studied temperature, , to initiate the runs. After 10,000 MC steps, was reduced and another 10,000 steps were performed. This “cooling down” process continued, using a grid with 23 temperatures (lowest 1/300) that was denser near the critical temperatures . After this already demanding first step, the cooling-down results (obtained by measuring during the last 5,000 MC steps per ) revealed sharp, yet continuous, transitions at all couplings. However, at particular s in the MC time evolution indications of insufficient convergence were found. Thus, next for each the results were further refined using additional 10,000 MC steps for extra thermalization, followed by 100,000 MC steps for measurements. By monitoring the results during the final MC evolution it was observed that this large effort produces now fairly stable results, revealing the first-order transitions in the region of phase competition discussed below.
The clean-limit effort needed standard computer clusters with nodes. However, a similar procedure with quenched disorder, requiring 40 disorder configurations, 6 disorder strengths (), and 20 temperatures for each , would have been impossible. Thus, the results with disorder reported below were obtained using the UT-ORNL Kraken supercomputer (Cray XT5), where up to 5,000 processors were employed simultaneously for periods of 24 hours. This amounts to a total computational effort in Figs. 3(c) and 3(d) (see below) of 250,000 hours (30 years if ran serially).
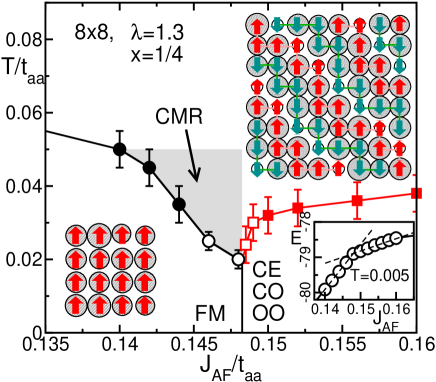
Clean limit phase diagram. The clean-limit phase diagram of the two-orbital model is in Fig. 1. The chosen coupling is representative of the regime where metallic and Jahn-Teller distorted insulating phases are in competition. The hole density is in the realistic range of experimental CMR investigations. Varying , and via the MC procedure described before, a systematic analysis of spin and charge correlations (e.g. see Fig. LABEL:Figure2) leads to a phase diagram where the FM metallic phase generated by the DE mechanism competes with a previously discussed C0.25E0.75 insulator hotta-CE (shown in Fig. 1). This “CE” state is the natural generalization to of the well-known CE state otherreviews ; review ; science , and they only differ in the shape of the zigzag chains. Like in all computational based efforts, here relatively small clusters are used, but it is well known that locating the temperature range where the relevant correlation lengths are as large as the cluster size provides qualitatively correct estimations of trends and critical temperatures.
The main novelty of the phase diagram in Fig. 1 is the identification of a first-order transition separating the FM metallic phase from the PM high- state, in the coupling range close to the competing CE insulator. Previous MC investigations had not reached sufficient accuracy to detect this first-order transition at realistic hole densities, such as . While previous efforts had clearly established the first-order nature of the direct low- FM-CE transition (see inset of Fig. 1), now observing the more subtle first-order FM-PM transition represents qualitative progress in the modeling of manganites.
Figure LABEL:Figure2(a) illustrates how the spin structure factor varies with . At q=(0,0) and close to the region of CE competition, a discontinuous transition exists between the FM and PM states. There is also a first-order transition from the CE to the PM state, close to the FM region. our new results reveal that the true phase diagram of clean-limit manganite models actually has “multicritical” characteristics, with the robust FM-CE first-order transition at low splitting into still first-order FM-PM and CE-PM transitions with increasing , each ending at critical points (whose precise location is beyond our accuracy). These results are compatible with recent multicritical characteristics revealed in some manganites multicritical .
CMR effect. The first-order nature of the transitions observed here dramatically affects the transport properties. Using the standard Kubo formula to calculate conductances verges ; sen06 , Fig. 3 shows the resistivity () vs. obtained in our simulations. Fig. 3(a) are results in the clean limit, varying in the region of FM-CE competition. At couplings such as =0.148, is insulating upon cooling, closely following results for =0.16 with a CE ground state. However, at the FM transition 0.02 ( 100 K, if =0.5 eV), becomes metallic via an abrupt discontinuity, in excellent agreement with several experiments PCSMO ; SSMO ; SSMO2 ; NSBSMO ; lynn96 ; mitchell . As increases, moving the system further away from the CE state, the transition becomes continuous and at =0.12 the FM transition is barely noticeable in the slope of vs. . For completeness, in Fig. 4(c) results using a 1212 cluster for only one set of couplings - (due to its high CPU cost) are shown, indicating that cluster size effects are small comment-cube .

Figure 3(b) contains the curves in the presence of magnetic fields . The observed trends are again in excellent agreement with experiments PCSMO ; SSMO ; SSMO2 ; NSBSMO ; lynn96 ; mitchell , with an overall rapid decrease of and with -peak positions moving to higher with increasing , and all the curves merging at approximately room (i.e. if eV). At a small field , the magnetoresistance is also in good agreement with CMR phenomenology.
Influence of Quenched Disorder. Experiments and theoretical calculations have shown the importance that quenched disorder has over the CMR effect review . It is expected that the clean-limit fine tuning of couplings needed to obtain a CMR (Fig. 1) will be removed once disorder is incorporated. Thus, it is important to analyze the influence of disorder on our results. Using the on-site quenched disorder form described before, results are in Figs. 3(c,d). Panel (c) illustrates how the clean-limit first-order transition is eventually rendered continuous by increasing the disorder strength. However, the discontinuity in first increases with increasing before it is reduced. This result is compatible with the observed multicritical behavior even with disorder multicritical . Also as in experiments, when the clean-limit transition is second order, quenched disorder decreases the where the peak occurs while increasing (panel (d)).
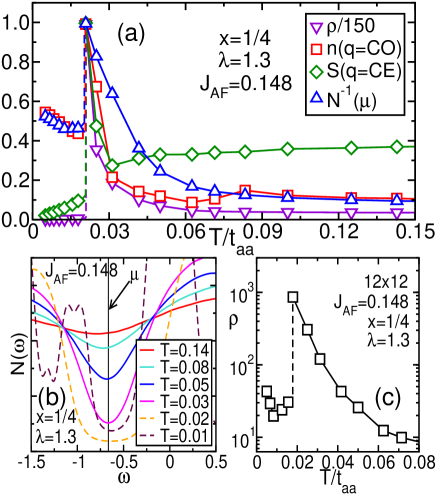
The CMR effect observed in our clean-limit MC simulations can be understood qualitatively via measurements of a variety of observables, similarly as in previous investigations sen07 . For instance, Fig. 4(a) contains the spin and charge structure factors, and , at the momenta of relevance for the CE phase, but in the CMR regime where the ground state is FM. As decreases, not only rapidly increases but so do and , showing that the system behaves as if the ground state were CE, developing robust CE short-range correlations. However, at an abrupt transition occurs to the true FM ground state. This switch from CE-dominated to FM-dominated characteristics with cooling may occur if the high- short-range-ordered CE state has a high entropy. Note also that at low-, the charge correlations in the FM state are still robust at short distances. Finally, also note that at a , considerably higher than , the CE tendencies start developing upon cooling argyriou , and this occurs concomitantly with the presence of a density-of-states pseudogap (Fig. 4(b)), as also observed in photoemission experiments PG . It is gratifying to observe similar results above for both the present model and the model studied in Ref. sen07, . Finally, note that the many observations of FM signals above in several manganites review are not incompatible with the clean-limit Fig. 4 since quenched disorder is known to increase the strength of the FM component.
Conclusions. The observation of first-order CMR transitions in models for manganites was here reported, solving a notorious theory-experiment discrepancy. A large-scale computer simulation was needed to reach our conclusions. Robust CMR ratios were found, as well as a CMR state above with short range CE characteristics. Weak quenched disorder preserves the first-order transitions, as in recent experiments multicritical .
Acknowledgment. This work was supported by the NSF grant DMR-0706020 and by the Division of Materials Sciences and Engineering, Office of Basic Energy Sciences, U.S. DOE. The computer simulations were possible in part by a NSF allocation of advanced computing resources at the Kraken (Cray XT5) supercomputer located at the National Institute for Computational Sciences (http://www.nics.tennessee.edu/). A portion of this research was conducted at the Center for Nanophase Materials Sciences at ORNL. This research used the SPF software (http://www.ornl.gov/~gz1/spf/).
References
- (1) M. Salamon and M. Jaime, Rev. Mod. Phys. 73, 583 (2001); J. De Teresa et al., Nature 386, 256 (1997); M. Uehara et al., Nature 399, 560 (1999).
- (2) E. Dagotto et al., Phys. Rep. 344, 1 (2001).
- (3) A. Moreo et al., Science 283, 2034 (1999).
- (4) J. Burgy et al., Phys. Rev. Lett. 87, 277202 (2001); ibid, Phys. Rev. Lett. 92, 097202 (2004); M. Mayr et al., Phys. Rev. Lett. 86, 135 (2001).
- (5) J. A. Vergés et al., Phys. Rev. Lett. 88, 136401 (2002).
- (6) S. Kumar and P. Majumdar, Phys. Rev. Lett. 96, 016602 (2006); ibid, Phys. Rev. Lett. 96, 136601 (2005).
- (7) C. Şen et al., Phys. Rev. B 73, 224441 (2006).
- (8) C. Şen et al., Phys. Rev. Lett. 98, 127202 (2007).
- (9) Y. Tomioka and Y. Tokura, Phys. Rev. B 66, 104416 (2002).
- (10) Y. Tomioka et al., Phys. Rev. B 74, 104420 (2006).
- (11) Y. Tomioka et al., Phys. Rev. B 80, 174414 (2009).
- (12) Y. Tomioka and Y. Tokura, Phys. Rev. B 70, 014432 (2004).
- (13) J. W. Lynn et al., Phys. Rev. Lett. 76, 4046 (1996).
- (14) D. Kim et al., Phys. Rev. Lett. 89, 227202 (2002).
- (15) L. Demko et al., Phys. Rev. Lett. 101, 037206 (2008).
- (16) T. Hotta et al., Phys. Rev. Lett. 86, 4922 (2001).
- (17) The Hubbard effects are mild at large Hund coupling, T. Hotta et al., Phys. Rev. B 62, 9432 (2000).
- (18) T. Hotta et al., Phys. Rev. Lett. 90, 247203 (2003).
- (19) Preliminary results on 444 clusters (not shown) suggest that a similar CMR peak is obtained in three dimensions, but the first order transition is smeared by the frustration effect caused by the geometry of the CE zigzag chains that do not fit into 44 layers. Simulations on unfrustrated 888 clusters are currently impossible, justifying why our present effort has focused on two dimensions. Fortunately, there are no reasons to suspect that two and three dimensions will behave differently with regards to the first-order transition.
- (20) D. N. Argyriou et al., Phys. Rev. Lett. 89, 036401 (2002).
- (21) D. Dessau et al., Phys. Rev. Lett. 81, 192 (1998); A. Moreo et al., Phys. Rev. Lett. 83, 2773 (1999).