33email: vattakunnel@oats.inaf.it,trussoni@oato.inaf.it,capetti@oato.inaf.it, baldi@oato.inaf.it
Accretion and nuclear activity in Virgo early-type galaxies.
We use Chandra observations to estimate the accretion rate of hot gas onto the central supermassive black hole in four giant (of stellar mass ) early-type galaxies located in the Virgo cluster. They are characterized by an extremely low radio luminosity, in the range . We find that, accordingly, accretion in these objects occurs at an extremely low rate, yr-1, and that they smoothly extend the relation accretion - jet power found for more powerful radio-galaxies. This confirms the dominant role of hot gas and of the galactic coronae in powering radio-loud active galactic nuclei across 4 orders of magnitude in luminosity. A suggestive trend between jet power and location within the cluster also emerges.
Key Words.:
galaxies: active, galaxies: jets, galaxies: elliptical and lenticular, cD, galaxies: ISM1 Introduction
The origin of the energetic processes occurring in active galactic nuclei (AGN) has been one of the most relevant astrophysical problems in the last decades. It is well established that the main driving mechanism is the release of gravitational energy of flows accreting on supermassive black holes (SMBH) for both radio-loud and radio-quiet AGN. While in the latter class the energy is mainly released into electromagnetic radiation, in radio-loud AGN a substantial fraction of the accretion power is converted into the kinetic power of relativistic jets. What is still a matter of debate is the origin of the accreting material that fuels the AGN, how this is channeled onto the SMBH, and whether and how it is eventually accelerated into a relativistic collimated outflow.
| Source | Alt. names | sub cl. | Log | Log | ||||
| VCC 731 | NGC 4365 | 0.00415 | 23.3 | B | 6.2 | 246 | 25.84 | 8.59 |
| VCC 798 | M 85, NGC 4382 | 0.00243 | 17.9 | A | 1.8 | 578 | 25.60 | 7.93 |
| VCC 881 | M 86, NGC 4406 | -0.00081 | 17.9 | A | 0.7 | 1584 | 25.94 | 8.52 |
| VCC 1535 | NGC 4526 | 0.00149 | 16.5a | B | 549 | 27.03 | 8.59 | |
| VCC 763 | M 84, NGC 4374 | 0.00354 | 18.4 | A | 1.2 | 247 | 28.87 | 9.00 |
| VCC 1226 | M 49, NGC 4472 | 0.00333 | 17.1 | B dom. | - | - | 27.10 | 8.78 |
| VCC 1316 | M 87, NGC 4486 | 0.00436 | 17.2 | A dom. | - | - | 29.99 | 9.53 |
| VCC 1632 | M 89, NGC 4552 | 0.00113 | 16.2 | A | 1.0 | 967 | 28.24 | 8.54 |
| VCC 1939 | NGC 4636 | 0.00313 | 15.6b | B | 2.7 | 59 | 27.02 | 8.16 |
| VCC 1978 | M 60, NGC 4649 | 0.00373 | 17.3 | A | 0.9 | 190 | 27.82 | 9.30 |
Column description: 1) name; 2) alternative name; 3) spectroscopic redshift from the NED database; 4) distance in Mpc ( Mpc) from Mei et al. (2007); 5) sub-cluster to which each galaxy belongs, with the dominant galaxies marked; 6) and 7) three dimensional distance (Mpc) and velocity (km s-1) along the line of sight with respect to the dominant components of the sub-clusters Virgo A or B; 8) radio core luminosity () from Capetti et al. (2009); for NGC 4636 we adopted the value of BBC08, adjusted at the distance assumed in this paper; 9) mass of the central SMBH in units of derived from the stellar velocity dispersion reported in the HyperLeda database or from direct measurements as listed by Marconi & Hunt (2003) (when not reported, we adopt an intrinsic error of 0.23 dex, related to the dispersion of the - relation).
a For this object there is no distance measurement thus we adopted the average Virgo distance to estimate luminosities; accordingly its three dimensional distance from the cluster is a lower limit, equal to the offset from M 49 in the plane of the sky.
X-ray observations of radio-loud galaxies recently indicated that in these objects spherical accretion of hot gas can provide the necessary level of accretion to power the active nucleus. Indeed, Allen et al. (2006) found a strong correlation between the jet and the accretion powers in a sample of nine objects. The jet kinetic energy was estimated from the mechanic work needed to inflate the cavities observed in their X-ray images. The same X-ray data also provided information on the physical parameters of the hot inter-stellar medium (ISM), yielding estimates of the accretion power exploiting the Bondi model (1952).
Balmaverde et al. (2008, here after BBC08) extended Allen’s work considering a larger number of radio-galaxies. Because X-ray cavities are visible only in a minority of objects, they took advantage of the relation between jet and radio-core power calibrated by Heinz et al. (2007). In this approximation, the jet kinetic power is estimated directly from the radio core luminosity, a quantity readily measurable in radio-galaxies. For a sample of 23 objects with X-ray data of sufficient quality (including the sources analyzed in Allen et al.) they showed that the correlation between the jet and accretion power holds over 3 decades, down to a jet power of . Another result of this correlation is moreover that on average of the available accretion power is converted into jet kinetic energy, independently of the AGN luminosity. Similar results were obtained also by Hardcastle et al. (2007) following a different approach.
Taking advantage of the recent surveys of early-type galaxies in the Virgo cluster performed in the optical (Côté et al. 2004), radio (Capetti et al. 2009), and X-rays (Gallo et al. 2008) we are in the position of testing the validity of the correlation accretion/jet powers by including objects of even lower luminosities than those discussed in the previous studies. We then isolated four giant galaxies (of stellar mass ) characterized by an extremely low radio luminosity (two of these sources are actually undetected in radio observations), in the range erg s-1Hz-1, more than 5 orders of magnitude lower than the brightest objects considered by Allen et al. (2006) and BBC08.
Furthermore, we have now a total of 10 radio-galaxies located in the Virgo cluster. It will then be possible to test whether in this environment the connection between the jet and accretion rates also holds and whether and how galaxies show different properties, depending on their positions inside the cluster.
In the following Sect. 2 we outline the main properties of the selected galaxies, in Sect. 3 we summarize how we estimated, through the X-ray and radio data, the values of the jet and accretion powers. In Sect. 4 we discuss our results and their implications for the sample considered by BBC08 with the addition of the four Virgo galaxies examined here. The summary of our results are reported in Sect. 5. In the Appendix we provide the details of the analysis of the Chandra X-ray data.
2 The sample
We considered the sample observed by Côté et al. (2004) for their Hubble Space Telescope survey of the Virgo cluster (ACS/VCS). They selected a sub-set of 100 early-type galaxies from the Virgo cluster catalog (VCC, Binggeli et al. 1987) that consists of 2096 galaxies within this 140 deg2 region. These data provide us with a detailed analysis of their optical brightness profiles (Ferrarese et al. 2006).
Balmaverde & Capetti (2006) found that the nuclear multiwavelength properties of early-type galaxies are related to their optical brightness profile. In particular, radio-loud AGN are found only in ‘core-galaxies’ (hereafter CoreG), i.e. objects whose brightness profile is better fit by a core-Sérsic model compared to a pure ‘power-law’ Sérsic model (hereafter SG) extending to the innermost regions (Trujillo et al. 2004).
We here focus on the properties of the sub-sample formed by the nine CoreG present in the Virgo sample111The low luminosity VCC 1250 is also classified as a core-galaxy but this classification is considered as marginal and should be interpreted with caution because the galaxy morphology is severely affected by dust patches and a bright nuclear source.. The VCC/CoreG are the brightest early-type galaxies in the sample (with the only pure Sérsic interloper represented by 9th ranked VCC 1903). This was expected, considering the well known link between brightness profiles and luminosity (e.g. Lauer et al. 2007). Because the VCC is complete down to B and all CoreG have BT 10.78, the VCC/CoreG sub-sample is also complete. These galaxies can be well compared with the radio-galaxies studied by Allen et al. (2006) and BBC08 considering the similarity of their host properties.
Capetti et al. (2009) performed a radio survey of the Virgo Cluster, observing with the Very Large Array (VLA) in A configuration and at 8.4 GHz the 63 early-type galaxies covered by the ACS/VCS, limiting to those brighter with BT 14.4. We here reproduce their Fig. 1, where the nuclear radio luminosity is plotted against the stellar mass of the galaxy (see Fig. 1). In agreement with previous studies (e.g. Best et al. 2005; Mauch & Sadler 2007), in the Virgo cluster the detection of a radio source is also highly favored in more massive galaxies. The nine VCC/CoreG have similar masses, all within the range M☉. Conversely, they show a large scatter in their nuclear radio luminosity, over more than 4 orders of magnitude. Indeed, while seven are detected in radio, we could only set an upper limit for the remaining two. They differ even more in terms of total radio power (measured at 1.4 GHz, see Capetti et al. 2009), spanning at least over a factor of . This confirms the idea that the relation between radio and optical luminosity can only be described in terms of a probability distribution.
Below we explore the possibility that the energetic output in these galaxies is correlated with the accretion rate of the hot, X-ray emitting gas, in analogy with the results obtained on more powerful sources. Of particular interest are the four VCC/CoreG222For easier reference we will use the more common Messier or NGC numbers for these sources. with the lowest radio luminosity (namely NGC 4365, M 85, M 86, and NGC 4526), not analyzed in previous studies, that reach levels as low as erg s-1Hz-1, a further factor of lower than the faintest objects considered in BBC08.
In Table 1 we list the main data of the four sources of interest. As we are also looking for possible connections between the accretion properties and the cluster environment, we consider the relationships between the galaxies of our sample and the two main cluster’s sub-structures (Virgo A and Virgo B, with M 87 and M 49 as dominant components, respectively, see Binggeli et al. 1987). Accordingly we reported also the relative distances and velocities (along the line of sight) of the various galaxies with respect to the dominant galaxy of each sub-cluster.
At this stage, we also include in the sample the CoreG VCC 1939 (i.e. NGC 4636). This source is not covered by the ACS/VCS because it is reported by Binggeli et al. (1987) to be a possible cluster member, owing to its relative large angular distance from (2.3 Mpc) from M 49. However, its membership appears to be rather secure, considering its distance of Mpc (compared to D=17.1 Mpc of M 49) and its recession velocity of only 69 relative to M 49. In Table 1 we provide the data for easy reference also for the six VCC/CoreG already discussed in previous studies.

| Name | log | log | |||||
| NGC 4365 | 29 | 1.2 | 0.44 0.08 | 4.6 | -1.68 | ||
| M 85 | 5.5 | 0.8 | 0.51 0.23 | 0.2 | -1.83 | ||
| M 86 | 17 | 0.4 | 0.65 0.02 | 0.5 | -1.61 | ||
| NGC 4526 | 19 | 0.7 | 0.68 0.21 | 1.1 | -0.83 | ||
| M 84 | 47 | 0.55 | 0.71 0.05 | 0.9 | 6.6 | 1.58 | 0.18 |
| M 49 | 28 | 0.36 | 0.90 0.16 | 0.8 | 12.0 | 1.83 | -0.09 |
| M 87 | 142 | 0.00 | 0.80 0.01 | 0.17 | 24.0 | 2.13 | 0.53 |
| M 89 | 17 | 0.83 | 0.67 0.09 | 1.3 | 4.4 | 1.38 | -0.80 |
| NGC 4636 | 9 | 0.31 | 0.54 0.11 | 0.4 | 0.34 | -1.52 | |
| M 60 | 83 | 1.0 | 0.80 0.02 | 0.16 | 11.0 | -0.27 |
Column description: 1) name; 2) Bondi radius in pc; 3) slope of the density profile; 4) temperature at the Bondi radius in keV; 5) number density at the Bondi radius in cm-3; 6) Bondi accretion rate in yr-1; 7) accretion power in erg s-1; 8) jet power in erg s-1 (when not reported a fixed error of 0.4 dex has been assumed, the other values are from Allen et al. 2006).
| X | Y | N | r | a | b | rms | ||
|---|---|---|---|---|---|---|---|---|
| 10 | 0.94 | 0.79 | 0.018 | 1.17 0.16 | -2.13 0.23 | 0.25 | ||
| 27 | 0.81 | 0.79 | 1.05 0.13 | -1.96 0.27 | 0.51 | |||
| 10 | 0.93 | 0.79 | 0.03 | 0.91 0.17 | -1.38 0.16 | 0.29 | ||
| 27 | 0.62 | 0.64 | 0.002 | 1.27 0.21 | -1.24 0.27 | 0.69 | ||
| 10 | 0.86 | 0.80 | 0.016 | 1.71 0.36 | -15.6 3.1 | 0.37 | ||
| 27 | 0.59 | 0.64 | 2.20 0.41 | -19.5 3.6 | 0.73 | |||
| 10 | - | 0.49 | 0.14 | - | - | - | ||
| 27 | 0.42 | 0.39 | 0.05 | 1.67 0.38 | 4.10 0.52 | 0.80 |
Column description: 1) dependent variable, and 2) independent variable (superscripts indicate that only the Virgo sample is considered); 3) number of objects; 4) linear correlation coefficient; 5) Spearman rank correlation; 6) probability of obtaining the observed (or a higher) value of under the null hypothesis of no correlation between the two variables; 7) slope, and 8) intercept of the correlation (Y = a X + b; the two upper limits on for NGC 4365 and M 85 are not considered); 9) scatter of the correlation.
⋆ The density measured at the innermost annulus (see text) is adopted to estimate .
3 Jet and accretion powers
In this section we estimate the jet’s kinetic energies and the accretion powers of the four CoreG with the lowest radio luminosity. The main assumptions and the details of the methods adopted to obtain and are outlined and discussed in BBC08 (and references therein).
3.1 Jet power
As already mentioned in the introduction, the jet kinetic power can be estimated from the work done by the jets to inflate the ISM cavities observed in the X-ray images. This method can be used only in objects with high X-ray data quality and, obviously, when such bubbles are visible. Heinz et al. (2007) showed that the radio core luminosity, , can also be used to estimate . Using a sample of radio-galaxies for which could be measured from the presence of cavities, they calibrated a relation in the form that enables one to evaluate from a simple measurement of core radio power , with a typical uncertainty (based on the rms of the relation) of 0.4 dex.
The four galaxies under scrutiny have rather different radio properties with respect to those considered by in previous studies. Indeed, while the galaxies considered in Allen et al. (2006) and BBC08 have well-developed double radio structures, only NGC 4526 has an extended morphology indicative of a jet origin. The radio emission of M 86 is instead unresolved, while it is undetected in NGC 4365 and M 85. The very presence of jets in these last three sources cannot be taken for granted. We might refer more precisely to our analysis of the connection between accretion and jet power as a study of the link between accretion and the AGN radio emission. Nonetheless, because and differ only for the scaling relation reported above, we prefer to maintain the jet power as a reference quantity, to facilitate comparison with previous works.
This assumes that the - relation holds for the sources discussed here, with a core power at least 10 times fainter than those considered by Heinz et al. (2007), i.e. that their jets properties are similar to those of brighter radio-galaxies. In particular, there is the possibility that low-power jets are substantially slower, even non relativistic. Implicitly adopting the average de-boosting factor for radio cores of more powerful sources for our sources, , might cause an overestimate of the jet kinetic power of up to a factor of (adopting from Giovannini et al. 2001). Although this is not a negligible effect, it does not significantly affect our main conclusions.
Because the estimates of based on cavities can be considered as primary calibrators, while those derived from are secondary estimators, we preserved these more direct measurements for the nine objects of Allen et al. for the analysis that will follow in Sect. 4.
3.2 Accretion power
The accretion power is deduced assuming a steady, spherically symmetric model for accretion onto a gravitational body (Bondi 1952). For the sake of simplicity we have assumed an efficiency ; the accretion rate, , is defined at the Bondi radius ( is the sound speed, the mass of the SMBH) as
| (1) |
where , , and are the mass and number densities, and the temperature at , respectively.
The mass of the SMBH has been estimated from the stellar velocity dispersion, available for all sources from the HyperLeda database, using the Tremaine et al. (2002) relation. In three CoreG of the Virgo sample, the mass of the SMBH has been measured directly and we adopted the value reported by Marconi & Hunt (2003).
The temperature and density were deduced from the properties of the hot ISM through Chandra X-ray observations. The data analysis and the results of these observations are presented in detail in the appendix, where we derive the deprojected profiles of temperature and density across the coronae for the four VCC sources. The temperature profiles across the coronal regions are essentially constant, with typical values of keV. For the calculation of the Bondi accretion rate we assumed that is equal to the temperature at the innermost shell. The value of was extrapolated down to assuming a relation , with deduced from a power-law fit to the density profile of the ISM (see the appendix for details).
The values of these quantities, with the derived accretion and jet powers, are reported in Table 2, which also includes the data for the other Virgo objects from BBC08.333A few misprints in their Table 2 have been corrected. We remark that for our four VCC objects the quality of the data is such that we were able to derive an estimate of with a typical uncertainty of a factor of 3. Besides these purely statistical uncertainties, systematic effects can also play a role. For example we will discuss in the next Section the effects of the assumption of the power-law dependence of the density on radius.
4 Discussion
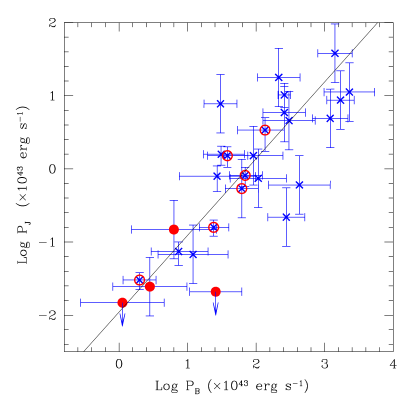
4.1 Accretion versus jet power
In the left panel of Fig. 2 we compare the jet and the accretion power, i.e. and . The four radio-faint VCC/CoreG are all located in the bottom left corner of this diagram. This indicates that their low radio luminosity is associated with a low level of accretion and with values consistent with the correlation between and derived for larger powers. The results of the statistical analysis are reported in Table 3: the parameters of the linear correlations are deduced from the bisectrix of the fits interchanging the two related quantities (excluding upper limits) as independent and dependent variables (Isobe et al. 1990).
The inclusion of these four objects only marginally alters the statistical parameters describing the vs. relation with respect to the results of BBC08 (see our Table 3 in comparison with their Table 3), yielding
where both powers are given in units of erg s-1.
Focusing on the sub-sample of 10 Virgo galaxies, and are also well correlated, with Spearman rank correlation , corresponding to a probability of obtaining the observed (or a larger) value of under the null hypothesis of no correlation. Slope and intercept agree within the errors with those found for the full sample. Because these sources represent the majority of the low power sources, this indicates that the results of BBC08 also hold for very low accretion rates and jet powers, and in particular that the conversion efficiency from accretion to radio or jet power does not significantly vary over 4 orders of magnitude.
We also tested how critical our assumption is that the density can be extrapolated using a relation in the form down to the Bondi radius. Indeed, even though the density profiles in our sources appear to monotonically increase toward the center (with the exception of M 87, see Allen et al. 2006) in the inner regions which are not probed by the Chandra data, they might flatten (as pointed out by Hardcastle et al. 2007). We then explored the effects of adopting as the value of the density at the innermost annulus of the profile (), which can be considered as a strict lower limit to the actual density at . Despite the very large range in the value of the innermost radius compared to the Bondi radius, renormalizing the value of with , the correlation holds (with and = 0.03 and 0.002, respectively; see Table 3). The quasi linear dependence is maintained, although with a slightly higher scatter, and with an intercept (and thus a conversion efficiency) increased by a factor of 5.
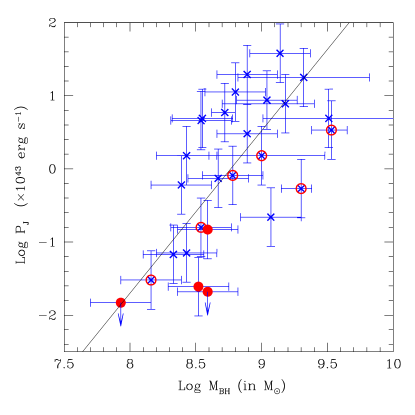
Following BBC08, we looked for possible relationships between the jet power and the single quantities defining through Eq. (1). No correlation was found between and the temperature at the Bondi radius. A correlation emerges only when the whole sample is considered () but with a large scatter (rms = ), an indication that the highest jet powers are in general found in the densest (at their Bondi radius) coronae. A stronger relationship of with is conversely present as shown by the right panel of Fig. 2 and in Table 3. The slope of the fit ( for the full sample and for the Virgo sub-sample) agrees with that predicted by the dependence of the accretion rate from . We must remark however that the scatter of the correlation - is larger than for the - relation. From these arguments it is clear that the mass of the SMBH is the dominant parameter in driving the accretion process and powering the jet, but that the density at the Bondi radius plays an important role, reducing the scatter of the correlation.
4.2 and large scale properties of the ISM
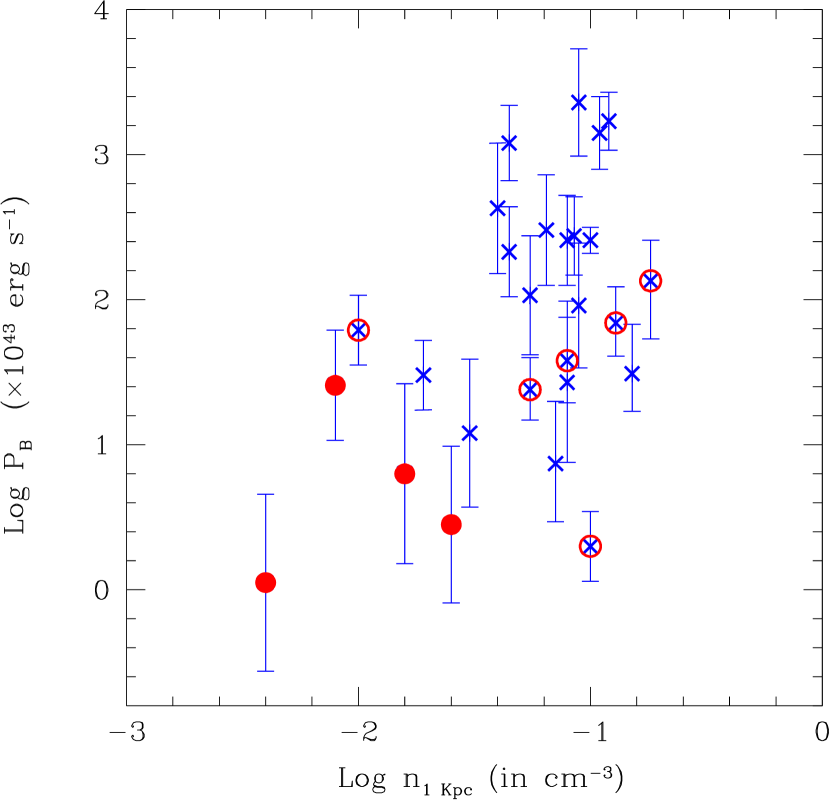
Balmaverde et al. (2008) found that the different levels of nuclear activity are related to global differences in the structure of the galactic hot coronae. Indeed, a relation links the jet power with the corona X-ray surface brightness, albeit with a large scatter. This suggests that a substantial variation in the jet power must be accompanied by a global change in its ISM properties. As the temperature is quite uniform across the ISM, the density in the external region is the most relevant parameter that could be related to the accretion process occurring in the core. We here re-examine this issue, but instead of considering the surface brightness of the corona, we measured its de-projected density at a fixed radius of 1 kpc, , 1 – 2 orders of magnitude larger than the Bondi radius, interpolating the neighboring points in the density profile. In Fig. 3 we compare with .
For the complete sample of 27 galaxies, the correlation analysis between and provides and .444No convincing correlation is found though considering only the 10 Virgo galaxies, see Table 3. The residuals have a rms of 0.8 dex. A similar relation is present also between and . The inclusion of the four low-power VCC galaxies is crucial to unveil the connection between these quantities, because it extends the range covered by both variables, providing the necessary leverage to the data. We thus confirm that the level of AGN activity is connected with the overall properties of the hot corona.
The rather loose relation between accretion rate and coronal density is not surprising. Indeed, assuming typical sound speeds of km s-1, the outer (1 kpc) and inner regions ( pc) of the ISM are causally connected on dynamical timescales on the order of a few years. The large scatter observed can be related to events occurring inside the ISM on shorter timescales. These could be of external origin, e.g. transient changes due to mergers or interactions with the ISM, but the accretion flow can also be affected ‘from inside’, e.g. due to a variable release of jet kinetic energy into the corona.
4.3 Accretion and the structure of the Virgo Cluster
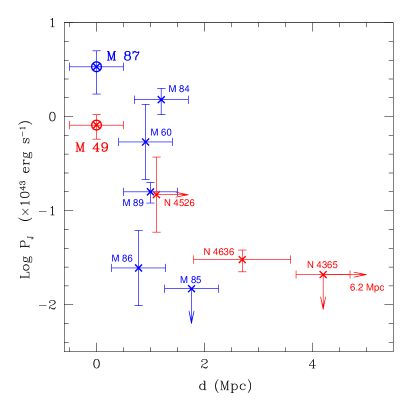
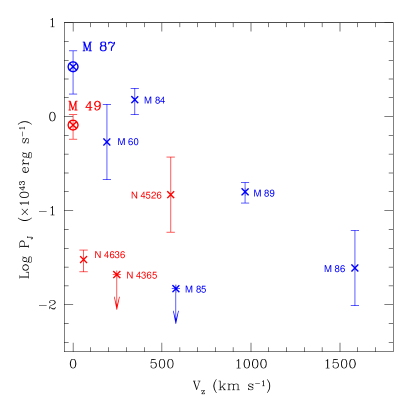
We now look for possible relationships between the jet power (strictly connected to the nuclear activity) of the Virgo CoreG and their location within the cluster, and in particular with respect to the dominant galaxies of Virgo A and B (see Table 1). In Fig. 4 we compare with (left panel) the three dimensional distance of each galaxy with respect to its relative sub-cluster dominant component and (right panel) also in terms of difference of recession velocity.
A suggestive trend between distance from the dominant galaxy of each subcluster and jet power emerges; galaxies located closer to the center of each sub-cluster have a larger jet power than those at larger distances. Due to the large uncertainties and to the low number of objects this does not anyway correspond to a statistically significant correlation between and . An analogous trend appears when considering the absolute value of the relative radial velocities, in the sense that high jet powers are not found in objects with the higher velocities. Clearly this analysis is limited because we are only able to measure one of the velocity components.
The clearer picture is derived by looking at distance and velocity simultaneously. The case of M 86 is particularly instructive. It is located at 1 Mpc from M 87, at a distance similar to that of M 84, M 89, and M 60. With respect to these sources, M 86 has a jet power times lower (and a similarly lower accretion rate). This could be due to different dynamical effects in these galaxies. Indeed, M 86 has the highest radial relative velocity with respect to M 87 ( km s-1, being actually blue-shifted with respect to the galaxy) and its Chandra image shows a long tail in the NW direction (Randall et al. 2008), a clear evidence of ram pressure stripping. The coronal gas content is progressively depleted at each passage in the central regions of the cluster, possibly causing the lower level of activity.
From the available data it is difficult to separate these environmental effects from a possible mass segregation that would cause the more massive galaxies to be preferably found closer to the cluster’s center. These would have correspondingly higher SMBH masses that due to the important role played by might be associated with objects with higher accretion and higher jet power.
5 Summary and conclusions
We have extended previous studies on the connection between accretion of hot gas and jet power in radio-loud AGN with a sample of four objects belonging to the Virgo cluster, characterized by extremely low radio luminosity. Two of them are actually undetected in 8.4 GHz VLA observations, corresponding to a limit to their radio luminosity of erg s-1. These four galaxies are particularly interesting because they have similar properties to those typical of the hosts of radio-loud AGN from the point of view of their brightness profiles (they are giant early type galaxies with a flat nuclear stellar core) and are associated with black holes of large mass (M☉). Nonetheless, these objects are times fainter than the radio core of M 87 (the brightest VCC galaxy) and times fainter in total radio power. Among the various alternatives that can be proposed we here explore the possibility that this is due to an extremely low accretion rate.
We used Chandra observations of these sources to estimate the power available from accretion of hot gas, , in a spherical approximation. This was obtained by de-projecting the temperature and density profiles of each source. Because the diffuse emission in these targets is on average much fainter than in those considered in previous studies, we considered and removed the contamination from stellar sources to isolate the genuine ISM emission. The quality of the data is such that we could estimate with a typical uncertainty of a factor of 3.
Furthermore, we now have a complete sample formed by all 10 core-galaxies located in the Virgo cluster. It has then been possible to verify whether the connection between jet and accretion rates holds also in this environment and whether galaxies show different properties, depending on their positions inside the cluster.
Our results can be summarized as follows.
1. The estimated accretion rates of the four radio-faint VCC galaxies are among the lowest of the sample considered. This indicates that their low radio luminosity is most likely due to a correspondingly low level of accretion.
2. The correlation between the accretion and the jet powers spans over 4 decades down to very low values of and , with an approximately constant conversion rate of . This even holds relaxing our assumption that the density profile can be extrapolated with a power-law to estimate its value at the Bondi radius. The mass of the SMBH is the main driving parameter of the correlation.
3. The correlation between and is also found for the subsample of the 10 Virgo sources, with parameters similar to those describing the full sample.
4. A rather loose relation links the accretion rate and coronal density at 1 kpc, suggesting that a substantial variation in the jet power must be accompanied by a global change in its ISM properties.
5. A suggestive trend (that however does not correspond to a statistically significant correlation) is present between the location (and relative velocity) of a source with respect to the cluster’s center and its jet power. In one case, this is clearly due to ram pressure stripping of hot coronal gas from a galaxy moving at high speed with respect to the cluster.
The main findings of this work are additional support for a linear relation between the power available from accretion of hot gas and the jets kinetic power and that the efficiency of this process is apparently independent of the level of luminosity, of the black hole mass, and of the environment. Although we are still far from understanding the dynamics of the accreting gas close to the SMBH, these results represent robust constraints on the processes of jets formation.
With the current instrumentation it is unlikely that a much larger range of AGN luminosity can be probed, considering (at the low end) the depth of the available radio observations and (at the high end) the limit imposed by the spatial resolution of the X-ray images in more distant and powerful AGN.
It would instead be important to detect the two galaxies still elusive in our VLA survey in deeper radio images (currently within reach thanks to the Extended VLA) to confirm (or disprove) that they are genuine active galaxies, even though of very low luminosity. They can be very useful to probe the properties of accretion and jet production at extreme low powers, in particular NGC 4365 which is already a marginal outlier in the diagram.
In the objects considered until now the accretion process is highly radiatively inefficient and the electromagnetic output from the nucleus is negligible with respect to what emerges as kinetic power (BBC08). The situation is rather different for radio-quiet AGN, which are brighter by a factor than radio-loud AGN in the X-ray band at equal radio power (e.g. Panessa et al. 2007). It would be of great interest to explore whether, in analogy to the relation in radio-loud sources, a correlation between the accretion power and radiative output (e.g. a link between and ) exists in radio-quiet objects. An initial attempt in this direction was made by Soria et al. (2006a, b) analyzing a sample of eight galaxies selected for their low X-ray luminosity. No correlation was found, but these objects span only a factor of 10 in and . An extension to radio-quiet sources covering a much larger range of X-ray luminosity is clearly needed to firmly test this point.
Acknowledgements.
The authors thank the anonymous referee and Barbara Balmaverde for helpful suggestions about the data analysis and acknowledge partial financial support from ASI grant I/023/050. This publication makes use of data products from the Two Micron All Sky Survey (which is a joint project of the University of Massachusetts and the Infrared Processing and Analysis Center/California Institute of Technology, funded by the National Aeronautics and Space Administration and the National Science Foundation) and of the NASA/IPAC Extragalactic Database (NED) (which is operated by the Jet Propulsion Laboratory, California Institute of Technology, under contract with the National Aeronautics and Space Administration), and of the HyperLeda database (http://leda.univ-lyon1.fr).References
- Allen et al. (2006) Allen, S. W., Dunn, R. J. H., Fabian, A. C., Taylor, G. B., & Reynolds, C. S. 2006, MNRAS, 372, 21
- Balmaverde et al. (2008) Balmaverde, B., Baldi, R. D., & Capetti, A. 2008, A&A, 486, 119 (BBC08)
- Balmaverde & Capetti (2006) Balmaverde, B. & Capetti, A. 2006, A&A, 447, 97
- Best et al. (2005) Best, P. N., Kauffmann, G., Heckman, T. M., et al. 2005, MNRAS, 362, 25
- Binggeli et al. (1987) Binggeli, B., Tammann, G. A., & Sandage, A. 1987, AJ, 94, 251
- Bondi (1952) Bondi, H. 1952, MNRAS, 112, 195
- Capetti et al. (2009) Capetti, A., Kharb, P., Axon, D. J., Merritt, D., & Baldi, R. D. 2009, AJ, 138, 1990
- Côté et al. (2004) Côté, P., Blakeslee, J. P., Ferrarese, L., et al. 2004, ApJS, 153, 223
- Ferrarese et al. (2006) Ferrarese, L., Côté, P., Jordán, A., et al. 2006, ApJS, 164, 334
- Gallo et al. (2008) Gallo, E., Treu, T., Jacob, J., et al. 2008, ApJ, 680, 154
- Giovannini et al. (2001) Giovannini, G., Cotton, W. D., Feretti, L., Lara, L., & Venturi, T. 2001, ApJ, 552, 508
- Hardcastle et al. (2007) Hardcastle, M. J., Evans, D. A., & Croston, J. H. 2007, MNRAS, 376, 1849
- Heinz et al. (2007) Heinz, S., Merloni, A., & Schwab, J. 2007, ApJ, 658, L9
- Irwin et al. (2003) Irwin, J. A., Athey, A. E., & Bregman, J. N. 2003, ApJ, 587, 356
- Isobe et al. (1990) Isobe, T., Feigelson, E. D., Akritas, M. G., & Babu, G. J. 1990, ApJ, 364, 104
- Kriss et al. (1983) Kriss, G. A., Cioffi, D. F., & Canizares, C. R. 1983, ApJ, 272, 439
- Lauer et al. (2007) Lauer, T. R., Gebhardt, K., Faber, S. M., et al. 2007, ApJ, 664, 226
- Marconi & Hunt (2003) Marconi, A. & Hunt, L. K. 2003, ApJ, 589, L21
- Mauch & Sadler (2007) Mauch, T. & Sadler, E. M. 2007, MNRAS, 375, 931
- Mei et al. (2007) Mei, S., Blakeslee, J. P., Côté, P., et al. 2007, ApJ, 655, 144
- Panessa et al. (2007) Panessa, F., Barcons, X., Bassani, L., et al. 2007, astro-ph/0701546
- Randall et al. (2008) Randall, S., Nulsen, P., Forman, W. R., et al. 2008, ApJ, 688, 208
- Revnivtsev et al. (2007) Revnivtsev, M., Churazov, E., Sazonov, S., Forman, W., & Jones, C. 2007, A&A, 473, 783
- Revnivtsev et al. (2008) Revnivtsev, M., Churazov, E., Sazonov, S., Forman, W., & Jones, C. 2008, A&A, 490, 37
- Sivakoff et al. (2003) Sivakoff, G. R., Sarazin, C. L., & Irwin, J. A. 2003, ApJ, 599, 218
- Soria et al. (2006a) Soria, R., Fabbiano, G., Graham, A. W., et al. 2006a, ApJ, 640, 126
- Soria et al. (2006b) Soria, R., Graham, A. W., Fabbiano, G., et al. 2006b, ApJ, 640, 143
- Tonry et al. (2001) Tonry, J. L., Dressler, A., Blakeslee, J. P., et al. 2001, ApJ, 546, 681
- Tremaine et al. (2002) Tremaine, S., Gebhardt, K., Bender, R., et al. 2002, ApJ, 574, 740
- Trujillo et al. (2004) Trujillo, I., Erwin, P., Asensio Ramos, A., & Graham, A. W. 2004, AJ, 127, 1917
Appendix A X-Ray data and ISM properties of the four radio-faint VCC galaxies
The Chandra Archive information for the four VCC galaxies analyzed here are reported in Table 4. For the X-ray data reduction and analysis we followed the same procedures and software packages as in BBC08. To account for the possible contamination from the active nucleus, we excluded the innermost region from the analysis, adopting a minimum radius of 15. This is rather conservative, because a faint X-ray central point source is seen only in NGC 4365 (Sivakoff et al. 2003).
Since the diffuse emission in these targets is on average much fainter than in those discussed in BBC08, the contamination from stellar sources must be taken into account. These sources mainly belong to two classes: low-mass X-ray binaries (LMXB) and stars of old populations with hot coronae, mainly cataclysmic variables (CVs) and active binaries (ABs).
| Source | Alt. name | ObsId | Date | Exp.(ks) |
|---|---|---|---|---|
| VCC 731 | NGC 4365 | 5921 | 04/28/2005 | 40.0 |
| VCC 798 | M 85 | 2016 | 05/29/2001 | 40.3 |
| VCC 881 | M 86 | 0963 | 04/07/2000 | 14.9 |
| VCC 1535 | NGC 4526 | 3925 | 11/14/2003 | 44.1 |
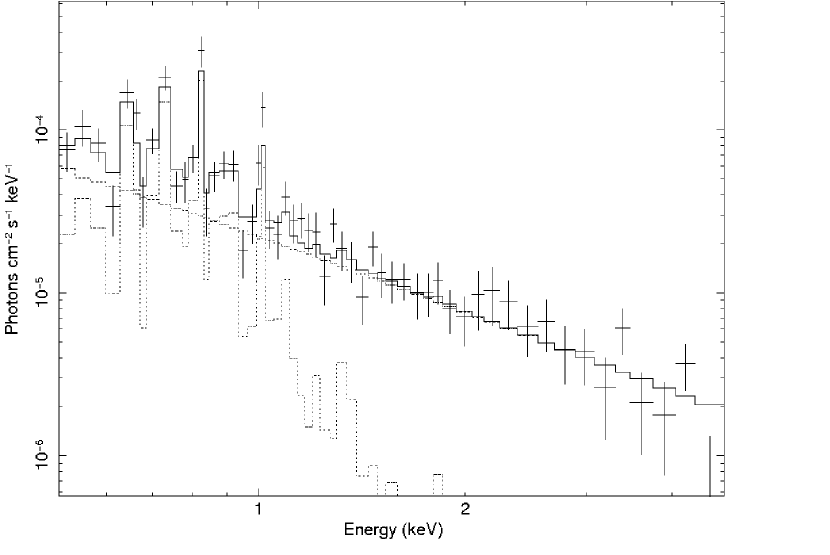
The brightest LMXB appear in the X-ray images as discrete sources superimposed to the diffuse coronal emission: they have been localized and removed from the event files through the wavedetect command. However, less luminous, unresolved LMXB can still have a non negligible contribution to the extended luminosity. As their emission is well described by a power-law model, they can be separated from the hot gas thermal emission through a spectral decomposition.
For this purpose we performed a two-components spectral fit, Mekal + Pow Law, adopting the galactic values for the column densities . For the thermal model the metalicity is fixed to half the solar abundances, while for the power-law the spectral index has been fixed to the value found from the discrete sources for each galaxy. The resulting power-law photon indices are in the range , in good agreement with the measurements of Irwin et al. (2003). We repeated this procedure considering four annuli for each galaxy. In three objects the integrated contribution of the unresolved LMXB is at a similar level of the thermal emission from the ISM, while it is negligible in NGC 4526. As an example we show in Fig. 5 the results obtained for NGC 4365.


The second contaminating component originates from the stellar coronae of CVs and ABs; their contribution cannot be separated through a spectral analysis as for LMXB, because their thermal X-ray emission is similar to that of the ISM (e.g. Revnivtsev et al. 2007). We exploit conversely the result obtained by Revnivtsev et al. (2008): they show that the old stars contribution to the X-ray emission of early-type galaxies (per unit stellar luminosity in the K band) displays a small scatter (less than a factor of 2) around the value they measured for NGC 3379,
| (2) |
We then retrieved the K band surface brightness profiles of the four galaxies of interest from the 2MASS Large Galaxy Atlas. Assuming that the IR-to-X-ray scaling relationship also holds in our sources, we compared them with the X-ray brightness profiles obtained from our analysis. In Fig. 6 we show as an example the case of NGC 4365. This is the galaxy where we measured the largest (possible) contribution from old stars that amounts to 30 % of the total counts. We conclude that the diffuse soft X-ray light is dominated by the genuine emission from the galaxies hot coronae. Nonetheless, we corrected the observed profiles for this marginal contamination.
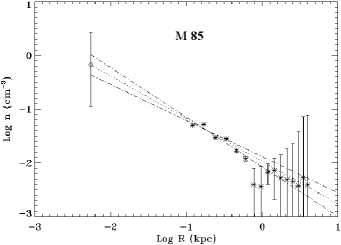
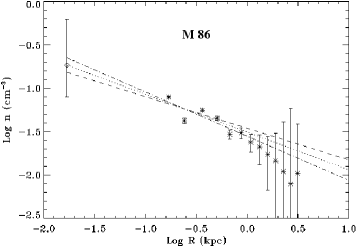
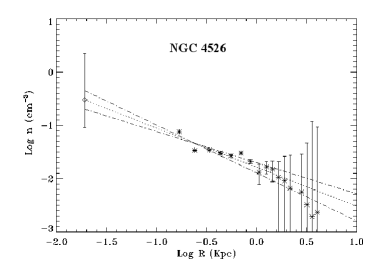
After removing the contribution from stellar sources, we followed the same procedure to derive the deprojected profiles of temperature and density as in BBC08, to which we refer the reader for further details. Very briefly, to measure the dependence of temperature with radius, we de-project the spectra assuming spherical symmetry using the PROJECT model in XSPEC, considering four annuli. The results are graphically reported in Fig. 7. Concerning the density, we first of all determined the X-ray surface brightness profile (SBP) extracting the counts in a series of circular annuli. The next step is to de-project the observed SBP, i.e. obtaining the number of counts emitted per unit volume as a function of radius. Assuming spherical symmetry, the count contribution provided by each spherical shell to the inner ones were determined following the calculation by Kriss et al. (1983). From the deprojected SBP we obtained assuming thermal emission and inverting the normalization coefficient of the spectral model.
As the Bondi radius is well inside the innermost annulus (by a factor between 3 and 20), the value of the density was extrapolated down to through a fit across the profile, assuming a power-law in the form . To limit systematic errors related to the arbitrary choice of the range of radii to be included in the fit, we performed the analysis twice by using four and six of the innermost density points. For each case we estimated the uncertainty related to the accuracy of the parameters of the fit describing the density behavior. We forced the density at to be higher (or equal) than its measured value at the innermost annulus. We finally adopted for the average of the values found in these two extrapolations and for its uncertainty the full range given by the overlap of the two individual error bars.