An expanded - diagram, and a new calibration of active galactic nuclei masses
Abstract
We present an updated and improved - diagram containing 64 galaxies for which measurements (not just upper limits) are available. Due to new and increased black hole masses at the high-mass end, and a better representation of barred galaxies at the low-mass end, the “classical” (all morphological type) - relation for predicting black hole masses is , with an r.m.s. scatter of 0.43 dex. Modifying the regression analysis to correct for a hitherto over-looked sample bias in which black holes with masses are not (yet) detectable, the relation steepens further to give . We have also updated the “barless” and “elliptical-only” - relations introduced by Graham and Hu in 2008 due to the offset nature of barred galaxies. These relations have a total scatter as low as 0.34 dex and currently define the upper envelope of points in the - diagram. They also have a slope consistent with a value 5, in agreement with the prediction by Silk & Rees based on feedback from massive black holes in bulges built by monolithic-collapse.
Using updated virial products and velocity dispersions from 28 active galactic nuclei, we determine that the optimal scaling factor — which brings their virial products in line with the 64 directly measured black hole masses — is . This is roughly half the value reported by Onken et al. and Woo et al., and consequently halves the mass estimates of most high-redshift quasars. Given that barred galaxies are, on average, located 0.5 dex below the “barless” and “elliptical-only” - relations, we have explored the results after separating the samples into barred and non-barred galaxies, and we have also developed a preliminary corrective term to the velocity dispersion based on bar dynamics. In addition, given the recently recognised coexistence of massive black holes and nuclear star clusters, we present the first ever - diagram and begin to explore how galaxies shift from their former location in the - diagram.
keywords:
Astronomical Data bases: catalogues — black hole physics — galaxies: active — galaxies: nuclei — galaxies: Seyfert — galaxies: quasars: general1 Introduction
The - relation (Ferrarese & Merritt 2000; Gebhardt et al. 2000a) is important because: (i) it enables one to predict supermassive black hole (SMBH) masses, , in galaxies for which only the bulge velocity dispersion, , is known; (ii) it allows one to calibrate other relations which can then be used to predict SMBH masses in active galactic nuclei (AGN) for which can not be readily measured; and (iii) it points toward a physical connection between the nuclei of galaxies and the properties of their host bulge. SMBH masses themselves, plus their demographics, accretion and activity is important for a number of reasons, in particular the influence that SMBHs are thought to have in dictating the growth of galaxies and galaxy clusters.
Most AGN are too distant to spatially resolve any material which is predominantly under the dynamical influence of their black hole. Therefore, less direct methods to determine the masses of these black holes are required. Reverberation mapping (RM: e.g. Bahcall, Kozlovsky & Salpeter 1972; Blandford & McKee 1982; Netzer & Peterson 1997) is the name given to observations which measure the time delay between direct continuum emission from a central AGN and the echoed emission-line signal from gas clouds in the so-called broad line region (BLR: Seyfert 1943) surrounding the AGN (Shields 1974, see also Souffrin 1968). Given the constant speed of light, such time delays correspond to a distance, . Coupled with the Doppler-broadened width of the emission lines from the clouds, and assuming that their motion is virialised and dominated by the central black hole’s gravity (e.g. Gaskell 1988, 2009a; Koratkar & Gaskell 1991; Wandel, Peterson & Malkan 1999; Onken & Peterson 2002), one can compute the virial product VP = . To convert these VPs into black hole masses requires the multiplication by a scaling factor which is related to the geometry and orientation of the clouds and effectively converts the measured velocity widths into an intrinsic Keplerian velocity (Peterson & Wandel 2000; Onken et al. 2004).
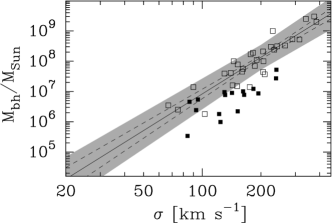
In diagrams that plot directly measured, and thus hopefully reliable, SMBH masses obtained from nearby, predominantly inactive galaxies versus some other galaxy property such as velocity dispersion, an empirical calibration of the above -factor can be performed by finding the value of which yields the optimal overlapping agreement between the virial products and the directly measured black hole masses. Adopting a fixed value of (Netzer 1990), this calibration of RM masses was first explored by Gebhardt et al. (2000b) and Ferrarese et al. (2001) using stellar velocity dispersions for seven and six AGNs, respectively.111The frequently used value of 3 is derived by taking the isotropic assumption of . However, because Gebhardt et al. (2000b) and Ferrarese et al. (2001) made use of the emission line’s full width at half maximum (FWHM), which Netzer took as 2, they quote an -factor of 3/4 rather than 3. The RM results which we discuss adopt the second moment of the line profile () as the measure of the emission line width, and the -factors we describe are appropriate to such data. Figure 1 presents the results from Onken et al.’s (2004) first ever empirical calibration of , which assumed that the 16 local AGNs they studied lie on the inactive galaxy relation. The initial - relations for inactive galaxies possessed a small total root mean square (r.m.s.) scatter in the direction of 0.34 dex (Merritt & Ferrarese 2001a; Tremaine et al. 2002) and therefore appeared well-suited for the above task of calibrating the -factor. However, as more (barred) galaxies have been added to the - diagram, the r.m.s. scatter has increased above 0.4 dex, particularly at the low mass end (e.g. Graham 2008b; Gaskell 2009c). Indeed, Graham (2007a, 2008a), Hu (2008) and Graham & Li (2009) have revealed that excluding barred galaxies, or using only elliptical galaxies, results in the recovery of a tight barless, or elliptical-only, - relation, a result reiterated by Gültekin et al. (2009b). The reason for this is not yet clear, but may be partly due to elongated orbits in bars or because bars can puff up the (face-on) central velocity dispersion as they evolve (see Gadotti & de Souza 2005; Gadotti & Kauffmann 2009; Perez et al. 2009; Saha, Tseng & Taam 2010).
Although bars are thin when they first form, vertical resonances (Combes & Sanders 1981; Combes et al. 1990; Raha et al. 1991) and possibly also hose instabilities (Merritt & Sellwood 1994) result in their growth out of the disc plane leading to boxy-peanut-shaped bulges (Combes & Sanders 1981; see also Illingworth 1981 and Kormendy & Illingworth 1982). Similarly, the torques due to the bar push gas inwards and can result in the formation of pseudo-bulges (Kormendy & Kennicutt 2004, Athanassoula 2005). Athanassoula & Misiriotis (2002, their figure 13) have shown how the velocity dispersion can increase dramatically, both out of the disc plane and along the length of the bar. Therefore, barred galaxies have a mechanism by which they can migrate off the - relation defined by non-barred galaxies. Failing to account for this offset population can not only bias one’s estimates of SMBH masses in AGN, but also impact on various evolutionary studies which may be using galaxy samples with varying barred galaxy fractions at different redshifts.
In Section 2.1 we introduce the (predominantly quiescent) galaxy sample for which 64 direct supermassive black hole mass measurements and velocity dispersions are available. These galaxies are used to define updated - relations. In Section 2.2 we introduce a sample of 28 AGN with available velocity dispersions and explain how their RM measurements and line widths have been converted into virial products. In Section 3 we derive the optimal -factor which brings the AGN in line with the distribution of () data for the galaxies with direct SMBH mass measurements. This factor provides the (sample average) calibration needed to convert virial products into SMBH masses. We also identify a potential sample selection bias which, if uncorrected, results in underestimation of the slope of the - relation. A lengthy discussion is provided in Section 4, addressing the slope and scatter of the - relation, sources of uncertainty on measures of and , and implications of the new -factor for AGN masses. Furthermore, a new equation providing a first order correction for the influence of bar dynamics on the host galaxy velocity dispersion is presented. We also probe how the coexistence of SMBHs and nuclear star clusters may alter our understanding of the - diagram/relation. Our main conclusions are summarised in Section 5.
2 An updated galaxy data set, and the - diagram/relation
2.1 Inactive galaxies
Graham (2008b) provided a catalogue of () values for 76 predominantly inactive galaxies having direct SMBH mass measurements which were carefully adjusted according to their adopted distance. Table 1 from that paper (based in part on Hu’s 2008 compilation and Ferrarese & Ford 2005) provides “reliable” entries for 50 galaxies, 36 of which are non-barred systems. Gültekin et al. (2009b) increased this sample222It is worth noting that there are differences among the adopted distances, and thus the adopted SMBH masses, between Graham (2008b) and Gültekin et al. (2009b), an issue already addressed by Graham & Driver (2007b, their Section 2.1). with the addition of 4 galaxies (Gültekin et al. 2009a)333Gültekin et al. (2009b) also includes 17 galaxies, not tabulated in Graham (2008b), for which only upper limits to their SMBH masses are available. An additional 105 upper limits can be found in Beifiori et al. (2009). and we include these here after adjusting their masses to the (Hubble constant)-independent distances reported by Tonry et al. (2001). Here we have, however updated the distance moduli that were reported by Tonry et al. (2001, their Table 1), and used in Graham (2008b), by decreasing their values by 0.06 mag, thereby reducing the associated galaxy distances by 3 per cent, and thus reducing the SMBH masses by this same amount. This small correction stems from Blakeslee et al.’s (2002, their Section 4.6) recalibration of the surface brightness fluctuation method using the final Cepheid distances given by Freedman et al. (2001, with the metallicity correction).
In addition to the following 8 galaxies (IC 2560, NGC: 2974; 3079; 3414; 4552; 4621; 5813; 5846) that were not included by Gültekin et al. (2009b), we further expand our () catalogue from Graham (2008b, his Table 1) with the inclusion of another ten galaxies (see Table 1). The following four were previously considered to have uncertain SMBH masses (NGC 1068, Lodato & Bertin 2003; NGC 3393, Kondratko et al. 2008; Abell 1836-BCG and Abell 3565-BCG, Dalla Bontà et al. 2009)444The references provided explain why these points are now considered reliable. while the following six are new galaxies: NGC 253 (Rodríguez-Rico et al. 2006); NGC 524 and NGC 2549 (Krajnović et al. 2009); NGC 1316 (Fornax A: Nowak et al. 2008); NGC 3368 and NGC 3489: (Nowak et al. 2010); This gives a total sample of 64 galaxies with reliable SMBH masses.
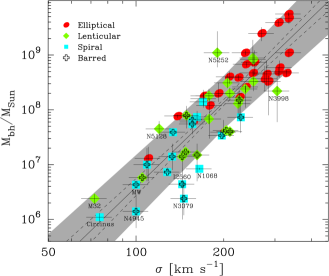
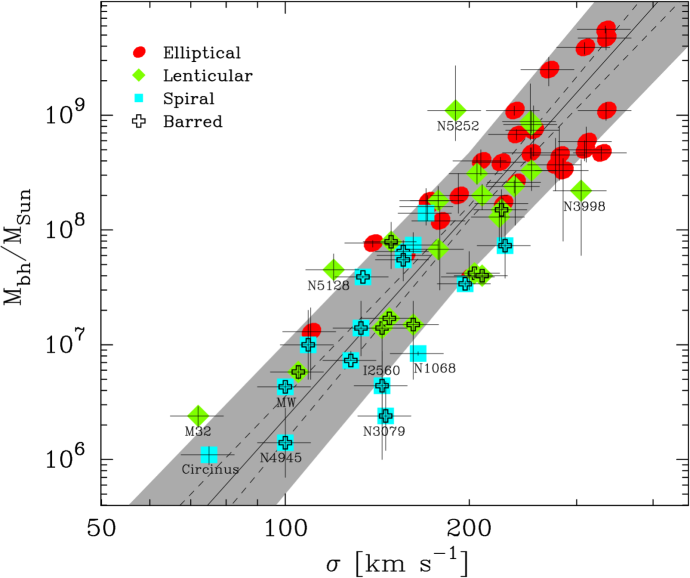
Aside from this expansion from 50 to 64 galaxies, we have updated the mass for the Milky Way’s SMBH (Gillessen et al. 2009) and roughly doubled the SMBH masses of NGC 3379, NGC 4486 and NGC 4649 (see Table 1). Recently published masses are increasingly secure due to refinements such as the use of triaxial orbit-based models rather than spherical or axisymmetric models, and better accounting for the range of orbital anisotropies and the influence of dark matter (Gebhardt & Thomas 2009; Shen & Gebhardt 2009; van den Bosch & de Zeeuw 2010). Following Gültekin et al.’s (2009b) identification of an error in the SMBH masses reported by Gebhardt et al. (2003), we have also increased the black hole masses, and their associated uncertainties, by a factor of 1.099 in the following 9 galaxies: NGC 821; NGC 2778; NGC 3384; NGC 3608; NGC 4291; NGC 4473; NGC 4564; NGC 4697; and NGC 5845. The expanded - diagram can bee seen in Figure 2.
| Gal. Id. | Type | Dist. | ||
| Mpc | km s-1 | |||
| 1 | 2 | 3 | 4 | 5 |
| New inclusions | ||||
| Abell 1836 | BCG | 157 [1a] | 309 [6] | [6] |
| Abell 3565 | BCG | 40.7 [1a] | 335 [7] | [6] |
| NGC 253 | SBc | 3.5 [2] | 109 [8] | [11] |
| NGC 524 | S0 | 23.3 | 253 | [12] |
| NGC 1068 | Sb | 15.2 [1b] | 165 [9] | [13] |
| NGC 1316 | SB0 | 18.6 [3] | 226 | [14] |
| NGC 2549 | SB0 [12] | 12.3 | 144 | [12] |
| NGC 3368 | SBab | 10.1 | 128 | [15] |
| NGC 3393 | SBab | 55.2 [1b] | 197 | [16] |
| NGC 3489 | SB0 | 11.7 | 105 | [15] |
| NGC 3585 | S0 | 19.5 | 206 | [17] |
| NGC 3607 | S0 | 22.2 | 224 | [17] |
| NGC 4026 | S0 | 13.2 | 178 | [17] |
| NGC 5576 | E3 | 24.8 | 171 | [17] |
| Updated data | ||||
| Milky Way | SBbc | 0.008 [4] | 100 [10] | [4] |
| NGC 821 | E | 23.4 | 200 | [18] |
| NGC 2778 | SB0 | 22.3 | 162 | [18] |
| NGC 3379 | E | 10.3 | 209 | [19] |
| NGC 3384 | SB0 | 11.3 | 148 | [18] |
| NGC 3608 | E2 | 22.3 | 192 | [18] |
| NGC 4291 | E2 | 25.5 | 285 | [18] |
| NGC 4473 | E5 | 15.3 | 179 | [18] |
| NGC 4486 | E0 | 15.6 | 334 | [20] |
| NGC 4564 | S0 | 14.6 | 157 | [18] |
| NGC 4649 | E1 | 16.4 | 335 | [21] |
| NGC 4697 | E4 | 11.4 | 171 | [18] |
| NGC 5128 | S0 | 3.8 [5] | 120 | [22] |
| NGC 5845 | E3 | 25.2 | 238 | [18] |
Unless otherwise specified, the distances have come from Tonry et al. (2001),
after reducing their distance moduli by 0.06 mag (see Section 2.1).
This small adjustment has been applied to all the galaxies from
Graham (2008b, his Table 1) which used the Tonry et al. (2001) distance moduli.
Unless otherwise specified, the velocity dispersions, , are the weighted values
from
HyperLeda555http://leda.univ-lyon1.fr (Paturel et al. 2003) as of March 2010.
The SMBH masses, , have been adjusted to the distances given in column 3.
References:
1a = NED: (Virgo + GA + Shapley)-corrected Hubble flow distance of the BCG’s
host cluster;
1b = NED: (Virgo + GA + Shapley)-corrected Hubble flow distance;
2 = Rekola et al. (2005);
3 = Madore et al. (1999);
4 = Gillessen et al. (2009);
5 = Karachentsev et al. (2007);
6 = Dalla Bontà et al. (2009);
7 = Smith et al. (2000);
8 = Oliva et al. (1995);
9 = Nelson & Whittle (1995);
10 = Merritt & Ferrarese (2001a);
11 = Rodríguez-Rico et al. (2006), a factor of 2 uncertainty has been
assigned here;
12 = Krajnović et al. (2009);
13 = Lodato & Bertin (2003);
14 = Nowak et al. (2008);
15 = Nowak et al. (2010);
16 = Kondratko et al. (2008);
17 = Gültekin et al. (2009a);
18 = Gebhardt et al. (2003), Gültekin et al. (2009b);
19 = van den Bosch & de Zeeuw (2010);
20 = Gebhardt & Thomas (2009);
21 = Shen & Gebhardt (2009);
22 = Neumayer (2010).
2.1.1 The - relation(s)
For predicting SMBH masses in other galaxies, one obviously desires a relation with the minimal amount of scatter in the vertical () direction. This is achieved with a non-symmetrical ordinary least squares regression of on (Feigelson & Babu 1992). Using the BCES code from Akritas & Bershady (1996) and assigning a 10 per cent uncertainty to the velocity dispersions of the 64 galaxies with direct SMBH mass measurements, one obtains
| (1) |
with a total r.m.s. scatter of dex, and an intrinsic scatter of dex, in the direction. This relation is shown in Figure 2. For reference, the equivalently produced relation using all 50 galaxies from Graham (2008b) has a slope and intercept of and , respectively, while Hu (2008) reported values of and . Using our updated data set, the slope drops to , while the intercept remains unchanged, when an uncertainty of 5 per cent — the value used by Tremaine et al. (2002) and Gültekin et al. (2009b) — is assigned to the velocity dispersions. Using Tremaine et al.’s (2002) modified FITEXY routine (Press et al. 1992) yields consistent results, with a slope and intercept of 4.86 and 8.15, respectively (when assigning a 5 per cent uncertainty to the velocity dispersions). Of the two commonly used uncertanties within the literature (namely, 5 and 10 per cent), we have elected to proceed using a 10 per cent uncertainty on our velocity dispersions, as an inspection of HyperLeda (Paturel et al. 2003, see also Section 6 in Nowak et al. 2010) reveals that a 5 per cent uncertainty is probably overly optimistic. Ideally though, one would like to have more accurate measurements and measurement errors for the velocity dispersions (see Section 4.2).
When using (only) the 44 non-barred galaxies, and a 10 per cent uncertainty on the velocity dispersions, the above regression of on gives the relation
| (2) |
with a total r.m.s. scatter of dex, and an intrinsic scatter of dex, in the direction.666When an uncertainty of 5 per cent is assigned to the velocity dispersion, the slope of the “barless” - relation drops to , while the intercept basically remains the same. As already noted by Graham (2008a) and Hu (2008), a similar relation is obtained when using only the elliptical galaxies (see Table 2). The r.m.s. scatter of the elliptical-only - relation is 0.34 dex, notably less than the value of 0.43 dex for the standard (full sample) - relation.
When using (only) the 20 barred galaxies, and a 10 per cent uncertainty on the velocity dispersions, the regression of on gives
| (3) |
with a total r.m.s. scatter of dex. For convenience, all of these - relations are tabulated in Table 2. This barred - relation is 0.45 dex (at km s-1) below the relation defined by non-barred galaxies, and reiterates the offset nature of the two populations first noted by Graham (2007a, 2008a,b) and Hu (2008).
| Sample (size) | ||||
| [dex] | [dex] | |||
| BCES regression of on | ||||
| Full (64) | 0.43 | |||
| Barred (20) | 0.36 | |||
| Non-barred (44) | 0.37 | |||
| Elliptical (25) | 0.34 | |||
| BCES regression of on | ||||
| Full (64) | 0.46 | |||
| Barred (20) | 0.41 | |||
| Non-barred (44) | 0.41 | |||
| Elliptical (25) | 0.37 | |||
Based on a 10 per cent uncertainty on the velocity dispersions . The intrinsic dispersion pertains to the direction.
Whilst we adopt the above approach for this section, we do note that Section 3.1 points out, for the first time, a potential sample bias which, once corrected for, results in steeper slopes for the various - relations. These are given in the second half of Table 2. In Section 4.1 we discuss the causes for the change in slope of the - relation.
2.1.2 Predicting
When predicting the SMBH mass of a new galaxy for which one knows the velocity dispersion, the associated maximum 1-sigma uncertainty on the black hole mass — acquired by assuming uncorrelated errors on the velocity dispersion and both the slope and intercept of the – relation — can be determined using Gaussian error propagation. For the linear equation , one has an error on equal to
In the presence of intrinsic scatter in the -direction, denoted by , the uncertainty on is
Using the standard - relation, given by equation 1, we have that , so , and therefore
| (4) | |||||
This represents the uncertainty when predicting a new black hole mass from a velocity dispersion measurement . Of course, if one knows the morphological type of the galaxy in question, then the relevant equation from Table 2 can be used to predict a more accurate black hole mass.
Before proceeding, we note that several ways of distinguishing pseudo bulges from classical bulges have been proposed in the literature. This includes morphology, kinematic properties, the Sérsic index and the distance from the Kormendy (1977) relation. Unfortunately there is no good agreement between these methods and often authors using one method criticize the method(s) used by others. On the other hand, whether a galaxy has a bar, or not, is a more clear cut question. We thus believe that this is a much safer way of addressing departures from the – relation.
2.2 Active galaxies
We have started with the homogenized time delays, , and broad line region velocity dispersion measurements for the 35 AGN listed in Table 6 of Peterson et al. (2004). Errors on both measurements are available, as are multiple measurements for many galaxies.777Potential problems with single epoch data are described in Gaskell (2009b). Below we describe how this data has been combined to acquire the single virial product,
| (5) |
for each AGN. Modulo the yet-to-be-determined -factor, this virial product represents the mass of each AGN’s central black hole.
When multiplying uncorrelated numbers with errors, the relative error on the product is the square root of the sum of the squares of the relative errors in the individual numbers. That is
When the numbers are correlated, the relative errors are simply added. Therefore, in deriving the virial product, , from the and values tabulated by Peterson et al. (2004), one has a relative uncertainty given by
These values are provided, for multiple measurements, in the final column of Table 6 from Peterson et al. (2004) and adopted here.
Assuming that these individual measurements, , of the virial products are distributed normally about the true value , one can use a maximum likelihood analysis to determine the (error-weighted average) optimal value and its associated uncertainty.888The one simplification is to average the slightly non-symmetrical errors associated with the virial product measurements, providing the values of used above. From the treatment of weighted averages by Taylor (1997, Chapter 7), one has that
and the uncertainty on the value of VP is given by
| (6) |
The resulting (single) virial product for each galaxy is listed in Table 4 (c.f. Peterson et al. 2004, their Table 8; and Woo et al. 2010, which appeared while we were preparing this work). Given that we ultimately find a different -factor to Woo et al. (2010), we felt that it was beneficial to show, in Table 4, the exact data that we have used.
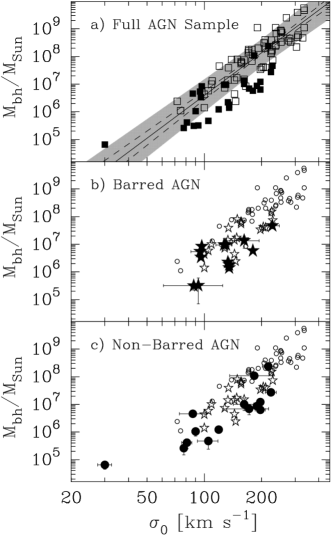
We have excluded PG 1211+143 and IC 4329A because the associated uncertainty on their virial products give values consistent with zero (Peterson et al. 2004). We have also excluded the virial product for 3C 390.3 because it has a double-peaked emission line profile. While NGC 5548 has the most extensive reverberation-mapping of all the AGN (Bentz et al. 2007), frustratingly, it also has an irregular emission line profile. As noted by Zhu & Zhang (2009) and Zhu, Zhang & Tang (2009; see also Wandel, Peterson & Malkan 1999), the determination of the line width is problematic for these last two galaxies. To err on the side of caution, we present our analysis both with and without NGC 5548, finding consistent results. We have however included 12 new galaxies (see also Woo et al. 2010) for which velocity dispersions were not available at the time of Onken et al.’s (2004) analysis. Table 4 lists 30 AGN with reverberation-mapping measures and velocity dispersions, two of which we exclude, and 13 of which belong to barred galaxies (see Bentz et al. 2009b, their Table 5). These data are plotted in Figure 3.
3 Analysis: The -factor
Figure 3a presents an updated version of Figure 1. Again, an -factor of 1 has been applied to the AGN virial products. Immediately apparent is that the AGN virial products no longer appear quite so offset from the directly measured SMBH masses, instead, the two populations somewhat overlap. The larger discrepancy seen in Figure 1 appears to have been a result of sample selection, specifically, due to the past under-representation of barred galaxies with direct SMBH masses.
As noted previously, the -factor is the normalization of the AGN virial product which is used to estimate such that
| (7) |
Here we seek the value of which best matches the AGN in the - diagram with the - relation defined by the local sample of galaxies with direct SMBH mass measurements.
The value that we minimise to determine this optimal value of is given by the expression
| (8) |
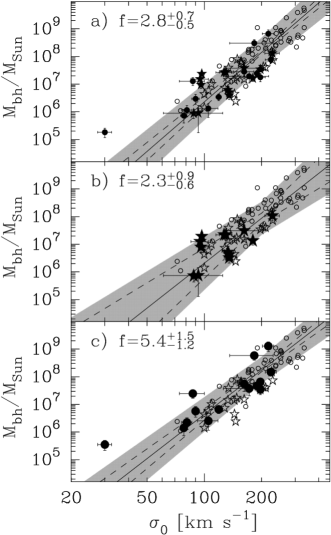
where and are the intercept and slope of the - relation, comes from equation 7, is given in equation 4, and is the uncertainty derived using equation 6 and listed in Table 4. Matching all 28 AGN to the standard (full sample) - relation given by equation 1 gives . This result is shown in Figure 4a. Excluding NGC 5548, .
As we have effectively seen, both here and in the literature, the inclusion of varying numbers of barred galaxies in the - diagram alters the best-fitting - relation that one obtains. We have therefore attempted to explore a derivation of the -factor using only barred galaxies, and then again using only non-barred galaxies.
A visual inspection of the barred galaxies in Figure 3b and 4b reveals that the virial products from the 13 barred AGN overlap with the territory occupied by the directly measured black hole masses of barred galaxies. That is, an -factor closer to a value of unity appears apt, and a formal treatment produces a value of .
Figure 3c reveals that 4 of the 15 unbarred AGN have black hole masses which agree exceedingly well with the relation defined by the 44 non-barred quiescent galaxies when the AGN virial products are multiplied by an -factor of 1. At the same time, 11 of the AGN appear to require an -factor significantly greater than a value of 1-3. Collectively, all 15 non-barred AGN generate an optimal -factor, relative to equation 2, of ( when excluding NGC 5548), while using the 11 most offset of these 15 AGN gives an unlikely -factor in excess of 10. Such a high value of produces SMBH masses for four of the non-barred AGN which are inconsistent with the upepr envelope of points in the - diagram defined using direct SMBH masses.
While none of these 11 galaxies display evidence of a bar, we do note that three are peculiar in appearance (Ark 120, Slavcheva-Mihova & Mihov 2010; Arp 151; and 3C 120), two may be too distant or small to discern a bar (PG 2130+099 and Mrk 202, respectively), and another two (Mrk 279 and Mrk 590) were modelled with an “inner bulge” by Bentz et al. (2009c), a feature that may be related to bars (Peng et al. 2002). If we have over-looked the presence of bars in (some of) our allegedly non-barred AGN sample, then our separation of AGN galaxies would obviously be in error and we would thus be comparing the wrong types of galaxies in Figure 4c, and likely over-estimating the value of . Unfortunately, we feel that it may therefore be more appropriate at this time to prefer the -value acquired without any attempted division into barred and non-barred galaxies (i.e. Figure 4a).
Since commencing this project, several other potential mechanisms which may cause offset behavior in the - diagram have come to our attention, all of which move galaxies below or rightward of the upper envelope of points in the - diagram. First, as we discuss later in Section 4.4, the offset nature of the barred galaxies in the - diagram may also be, in part, due to the exclusion of the nuclear star cluster mass. If so, this would further negate the appropriateness for the separation of galaxies solely on the basis of whether or not they contain a bar because (i) the mass of the neglected nuclear cluster may be important and (ii) non-barred galaxies can also be nucleated. A second issue, briefly raised in section 4.5, pertains to radiation pressure from the AGN. This may cause the derived virial product to erroneously fall below the - relation. If the broad line region has a flattened spatial distribution, then inclined AGN may appear to have narrower emission-line widths relative to those observed from an edge-on orientation, and hence their black hole mass may be under-estimated999AGN with BLRs significantly more edge-on than average could actually end up with over-estimated SMBH masses. In addition, if some AGN are effectively ignited by tidal interactions or minor mergers driving gas inward (e.g., Dasyra et al. 2007), this external trigger may potentially also elevate the velocity dispersion of the galaxy.
Regrettably, the above three issues effectively handicap our ability to proceed as we had hoped, and for the present time we fall back to the standard approach used to date, which is to neglect the morphological type in the analysis of the -factor. Nonetheless, our increased sample size is more representative of the galaxy population at large, and we feel that we are able to present a more appropriate measurement of this calibration factor.
3.1 Sample selection bias, and a re-derivation of the -factor
Collectively, we have not yet managed to directly, from spatially resolved kinematics, measure the masses of SMBHs below about at the centres of galaxies. This does not imply that such “intermediate mass black holes” (IMBHs) do not exist, indeed, evidence is accumulating that they probably do exist (e.g. Pox 52, Thornton et al. 2008; NGC 4395, Filippenko & Ho 2003; Greene & Ho 2004,2007; Dong et al. 2007; Naik et al. 2010; Seth et al. 2010). We do however note that if some fraction of IMBHs form outside of galactic cores, or are kicked out by a gravitational radiation recoil event (e.g. Komossa & Merritt 2008, and references therein), then the relatively long dynamical friction time-scale for them to inspiral to the centre may result in some fraction of IMBHs still wondering outside of galaxy cores. Indeed, evidence for such a non-central IMBH may have already been discovered in galaxy ESO 243-49 (Soria et al. 2010; Wiersema et al. 2010).
The non-detection of IMBHs, with resolved gravitational sphere’s of influence, at the centres of galaxies suggests that a (typically neglected) selection bias may exist within the - diagram. If our survey selection is such that SMBHs with masses less than are excluded, then it becomes necessary to modify the type of linear regression which is used if one is to construct a non-biased - relation. To avoid this sample selection bias requires a regression which minimises the residuals in the direction. A discussion of this problem and solution can be found in Lynden-Bell et al. (1988. their Figure 10).
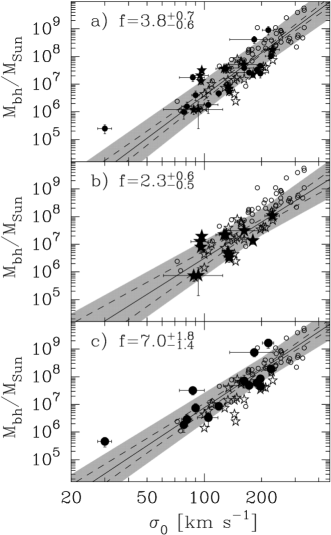
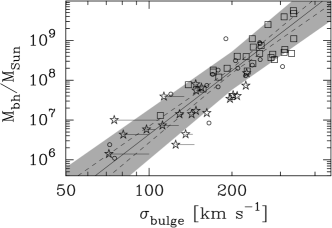
We have therefore repeated the previous analysis using an - relation constructed from a linear regression of on for (i) the full sample (see Figure 5), (ii) the barred galaxies and (iii) the non-barred galaxies. The resulting relations, provided in Table 2, are steeper than previously obtained.101010The slope of the VP- relation for the 28 AGN is , consistent with the associated slope of the - relation () for the 64 predominantly inactive galaxies. We have therefore not explored changes in as a function of black hole mass or velocity dispersion. Consequently, this results in a reduction to the optimal f-factors which are shown in Figure 6. Using the 28 AGN and 64 predominantly-inactive galaxies, the optimal ”bias-free” -factor is . This value is a factor of 2 less than reported by Onken et al. (2004) and Woo et al. (2010), but in good agreement (perhaps for different reasons) with the value of from Marconi et al. (2008, see section 4.5). Excluding the non-barred AGN NGC 5548 results in -factors of , and in Figures 6a), b) and c), respectively.
4 Discussion
4.1 The slope, and scatter, of the - relations
The slope of the - relation has received a lot of attention since Gebhardt et al. (2000a) reported a value of while Ferrarese & Merritt (2000) reported a value of . Such slopes had been predicted because of the way feedback from accretion onto the central massive black hole re-directs energy and momentum back into a galaxy, establishing a correlation in which scales with (Fabian 1999) or (Silk & Rees 1998; Haehnelt, Natarajan & Rees 1998). However, disagreement over the exact slope has continued, with Tremaine et al. (2002) claiming a value of and Ferrarese & Ford (2005) advocating . An insightful discussion as to why those measured slopes varied, depending on the type of regression used, is provided by Novak, Faber & Dekel (2006), see also Feigelson & Babu (1992) for background understanding.
Relative to the “classical” - relation based on the use of galaxies of every morphological type, Graham (2007a, 2008a) and Hu (2008) have revealed that there is a tighter relation based on the use of elliptical-only galaxies, or non-barred or pseudo bulge galaxies. In addition, these new relations have a different, shallower, slope than the one obtained using every galaxy. Using a symmetrical regression analysis, Gültekin et al. (2009b) recently reported a slope of for 41 allegedly non-barred galaxies with available SMBH mass measurements, almost identical to the slope of 4.28 previously reported by Graham (2008b) when using a sample of 36 non-barred galaxies and the same 5 per cent uncertainty assigned to the velocity dispersions. Using a non-symmetrical regression of on , Graham (2008a) had also shown that the slope of the “elliptical-only” - relation was as low as . Hu (2008) also constructed such an “elliptical-only - relation”, finding a slope of when using a 5 and 10 per cent uncertainty for the early- and late-type galaxies, respectively. Using an uncertainty of 5 per cent for the velocity dispersions, Gültekin et al. (2009b) subsequently reported a slope of 3.96 for their “elliptical-only” - relation, and a slope of 3.86 when using their early-type galaxies.
We have shown, with an updated and expanded data set, that the above slopes have increased. The reason is in part due to new data and the doubling of some previous SMBH masses at the high-mass end. Table 2 reveals that a symmetrical treatment of the data — obtained by averaging the slopes obtained when regressing on and on — yields a slope of (4.57+5.32=) 4.95 and (4.43+5.30=) 4.87 for the non-barred and elliptical-only galaxies, respectively. While this is equivalent to the (symmetrical regression)-derived slope reported by Ferrarese & Merritt (2000) and Ferrarese & Ford (2005), one needs to keep in mind that their slope pertained to a classical (barred plus unbarred) galaxy sample. Curiously, the optimal value for the slope of the barless and elliptical-only - relations has changed from 4 to 5, consistent with the prediction by Silk & Rees (1998) based on feedback from SMBHs in bulges built by monolithic-collapse. Given the potential sample bias which currently excludes SMBH masses less than about one million solar masses, the relations in the lower half of Table 2 should be preferred; these are consistent with a slope of 5. The slope for the full galaxy sample (barred plus unbarred galaxies) is steeper still. The reason for this is also partly due to the increase of some SMBH masses at the high-mass end, and the inclusion of more barred galaxies at the low-mass end. Given that the barred galaxies appear to define their own offset relation relative to the non-barred galaxies, coupled with the observation that they have velocity dispersions which only span the lower-half of the range spanned by the non-barred galaxies, their increased numbers results in a steepening of the “classical” - relation. Using all 64 galaxies yields a slope between 5 and 6 (see Table 2), a result which appears to be subject to the relative numbers of differing morphological type (barred versus unbarred galaxies) that one includes. Although, this latter remark may need to be revoked depending on the role that nuclear star clusters play.
Finally, it is worth noting that the scatter about the “classical” - relation remains in excess of 0.4 dex. It would thus appear that the velocity dispersion is not the fundamental/sole parameter driving the host galaxy connection with the SMBHs.111111Technically, it is the intrinsic scatter rather than the total scatter which reveals what physical quantity may control the SMBH mass. However, uncertainty in the measurement errors of the velocity dispersion render the intrinsic scatter a rather unreliable quantity. Nonetheless, using a 5 per cent uncertainty, Gültekin et al. (2009b) report an intrinsic scatter of dex for their full sample - relation. The - relation (Graham & Driver 2007a), which uses the major-axis Sérsic index , has a total scatter of only 0.31 dex. In addition, (Graham 2007b) has shown that the - relation (McLure & Dunlop 2002; Erwin et al. 2003; Marconi & Hunt 2003) currently has a total scatter of only 0.33 dex when (i) based on near-IR CCD images rather than optical photographic plates, (ii) using rather than modelling of the bulge light, (iii) after the correct identification of disc galaxies and thus the correct separation of bulge and disc light, and (iv) after applying internal dust corrections to spiral and lenticular galaxies. When such corrections are made, rather than using data from de Vaucouleurs et al. (1991), as done by Gültekin et al. (2009b), the uncertainty on the slope and intercept of the - relation are reduced, and the intrinsic scatter drops from 0.38 dex to 0.30 dex. Consequently, one may be tempted to conclude that the bulge luminosity and major-axis Sérsic index appear to be capable of predicting black hole masses with more accuracy than the stellar velocity dispersion. However, we note that Graham & Driver (2007a) contains only six barred galaxies, while Graham’s (2007b) re-analysis of the Marconi & Hunt (2003) galaxy sample contains only four barred galaxies. If, after an accurate modelling of the stellar light distribution, barred galaxies are not found to be offset in say the - diagram, and the scatter remains small, it would suggest that the values may be responsible for these galaxies’ offset nature in the - diagram. If, on the other hand, barred galaxies are similarly offset in the - diagram as they are in the - diagram, it may be suggestive of an underweight SMBH mass relative to the relation / upper-envelope defined thus far (see Batcheldor 2010).
4.2 Sources of uncertainty in and
There are many sources of uncertainty in the values of and . While typically not spoken about, they are present in all the previous studies of the - relation, and also this one. While Peterson (2010) have already provided cautionary remarks on the reliability of reverberation-mapping derived SMBH masses, Cappellari et al. (2010) do the same for direct measurements of gas and stellar dynamics around SMBHs. Attempting to resolve these issues is not only beyond the intended scope of this paper, but would certainly make it quite unwieldy. Nonetheless, we felt it was appropriate, and hopefully helpful, to list a few of our own concerns.
4.2.1 Cautionary remarks regarding
In regard to the SMBH mass, we list three issues. As we have seen from Table 1, observers continue to refine/modify their SMBH mass measurements as new data becomes available and new techniques are implemented (e.g., Valluri, Merritt & Emsellem 2004; Cappellari et al. 2010). Sometimes this reveals an under-estimation of past error bars on SMBH masses. Point 1) Using triaxial, rather than oblate or spherical, models can result in factor of two changes and possibly more (van den Bosch & de Zeeuw 2010). 2) Failing to allow for a NC with a different stellar mass-to-light ratio from the underlying bulge will bias one’s mass measurement of a SMBH. 3) A proper dynamical treatment of bars in regard to the mass measurement of SMBHs, has in general not been undertaken, and Krajnović et al. (2009) have remarked that “The bias introduced by modelling a likely barred galaxy using a model with a static, axisymmetric potential has so far not been well explored.”
4.2.2 Cautionary remarks regarding
At the top end of the - relation, one is working with massive elliptical galaxies which can have steep velocity dispersion gradients near their centre. We are referring to the profile beyond the SMBH’s sphere of influence, where the velocity dispersion profile is steep due to the high central concentration of stars, as traced by the Sérsic index (e.g. Trujillo, Graham & Caon 2001). Under poorer seeing conditions, the measured central velocity dispersion will be under-estimated as one effectively samples more of the surrounding light which has a lower velocity dispersion (cf. Graham et al.’s 1998 value of km s-1 and D’Onofrio et al.’s 1995 value of km s-1 for NGC 1399). Furthermore, given the declining nature of velocity dispersion profiles with radius, especially in big elliptical galaxies, the use of an average luminosity-weighted velocity dispersion over a larger aperture should be systematically different from the central velocity dispersion. The use of total, infinite aperture, luminosity-weighted velocity dispersion, rather than central velocity dispersion, would result in an - relation which is considerably steeper than the - relation. This is readily appreciated by looking at the aperture velocity dispersion profiles in Graham & Colless (1997, their figure 8) and Simonneau & Prada (2004, their figure 5).
At the lower-mass end of the - relation, when dealing with disc galaxies, the velocity dispersion can be over-estimated due to strong rotational gradients within the inner region used to measure . The transition in rotational velocity (), from say 220 km s-1 to 220 km s-1 (the rotational velocity of our Sun, e.g. Liu & Zhu 2010) across the centre of a disc galaxy can happen over a small radial range. Given that some fraction of this rotational velocity change will occur within one’s adopted aperture or fraction of the spectrograph’s slit-length, the absorption line profile from the integrated flux can be highly broadened in non-(face on) discs, thereby significantly increasing the measured velocity dispersion above the true value (see Epinat et al.’s 2010 work with emission lines). Needless to say, given that the apparently offset galaxies in the - relation tend to be disc galaxies (Graham 2008a; Hu 2008; Gültekin et al. 2009b), this scenario is rather interesting. In passing we remark, perhaps for the first time, that this issue may be a factor in explaining the high velocity dispersion measurements reported for some compact galaxies at high redshifts (van Dokkum, Kriek & Franx 2009).
Velocity dispersions can come from spectrograph slits placed along the major axis, the minor axis, or the bar axis. Apertures and slits can be of varying radius and length (and thus sample varying fractions of a bulge’s half-light radius); together with different galaxy distances, plus varying bar lengths, this can all act to modify the velocity dispersion that is actually measured. Detailed measurements, from integral field spectrographs, for the 64 galaxies with direct SMBH mass measurements would be a welcome contribution (see Batcheldor et al. 2005). Such uniform data, sampling spectral lines that are not particularly sensitive to young stars (such as the Ca Triplet lines), and whose acquisition is admittedly beyond the scope of this paper, would be preferable to the publicly available, hetereogeneous mix of velocity dispersions which are, thankfully, homogenised by HyperLeda (Paturel et al. 2003) following the precepts of McElroy (1995) to produce the galaxy velocity dispersions that we and others use. Having a combination of data from many authors does, however, reduce the impact that systematic biases — which may be present in some individual observing programs — can have.
The problem with young stars, alluded to above, is that they shine very bright, and can bias, and even dominate, one’s luminosity weighted velocity dispersion (e.g. Wozniak et al. 2003). One may therefore have a situation where a cold disc has been able to form new stars, and this young nuclear disc dominates the central emission but does not represent the dynamics of the classical bulge. Similarly, one may have a significant contribution from a relatively cold nuclear or inner bar. This may result in “sigma drops” where the central velocity dispersion is actually depressed (e.g. Franx et al. 1989; D’Onofrio et al. 1995; Graham et al. 1998; Héraudeau & Simien 1998) or the value at the ends of the inner bar is lowered (de Lorenzo-Cáceres et al. 2008).
Studying the nuclear region of three barred galaxies, Emsellem et al. (2001) observed the near-infrared CO-band head lines, where dust obscuration is far less of a concern than in the optical. Their observed sigma-drops, of generally per cent, were due to nuclear bars or discs, visible in part because of their sub-arcsecond seeing. Chung & Bureau (2004) subsequently reported on the detection of sigma-drops in a larger sample of edge-on galaxies. They too found decrements of up to 15-20 per cent due to likely central discs. These papers revealed that the sigma-drops are only present in a small fraction of galaxies, and that they provide a smaller perturbation compared to that capable of a large scale bar.
4.3 A first order correction to for bar dynamics
As already discussed, we found that the 20 galaxies with large scale bars, from among the 64 predominantly inactive galaxies with direct SMBH mass measurements, are somewhat offset from the barless - relation towards higher velocity dispersions. In this section we discuss how this may be linked to orbital bar dynamics. We do not, however, consider the potential bias due to nuclear/inner bars, or nuclear discs with young stars which can exist in both barred and non-barred galaxies. In what follows we offer a simplistic, statistical correction for the large scale bars.
When measuring the velocity dispersion in the innermost portion of an edge-on SA galaxy, one has contributions mainly from the bulge orbits. This is because in the zero-th order approximation, the orbits of disc stars are circular. Consequently, any disc stars seen (in projection) at the very center of the galaxy will have velocities perpendicular to our line-of-sight. Of course the disc star orbits are not exactly circular, and the measurements refer not only to the very center but to a region around it (see the previous subsection). Inspite of this, the contribution of the disc to the velocity dispersion will be small compared to that of the bulge and can be neglected. This is not the case for SB galaxies.
The situation is more complex in a barred galaxy. Here the building blocks are closed periodic orbits, whose shape changes a lot as a function of location within or around the bar (e.g. Athanassoula 1992, her figure 3). If these are stable, they trap around them regular orbits, which contribute to the velocity dispersion, in the same way as the orbits trapped around the near-circular orbits in SA galaxies. In the SB galaxies, however, there are further effects. Since the orientation of the bar is random with respect to the line of nodes, the velocity along the orbit is not necessarily perpendicular to the line-of-sight unless the bar is along the line of nodes, or is perpendicular to it (but, in this second case, for a much smaller inner radial range). Furthermore, some periodic orbits have loops which, if projected on the centre, can further increase the velocity dispersion. Readers wishing to understand these effects better can find more extensive explanations in Bureau & Athanassoula (1999), where individual periodic orbits are analysed. The bottom line is that the orbital structure of the bar will increase the observed velocity dispersion beyond that of the bulge alone, and will thus partly explain the (positive) sign of the deviation of barred galaxies from the regression line obtained from the remaining sample. Furthermore, the simulations analysed in Bureau & Athanassoula (2005) show that these effects can be quite strong and may enhance the observed velocity dispersion by as much as 10 – 40 per cent, depending on the bar’s strength and orientation (Bureau & Athanassoula 2005, their figure 1). This range is in agreement with the amplitude of the observed deviations. It is thus clear that these deviations may well be due to the orbital structure characteristics due to the bar potential.
Here we provide a simplistic estimate of the affect from large-scale bars on the velocity dispersion (in the disc plane). Imagine a bar with major- and minor-axis lengths of 4 and 2 kpc, respectively. The bar thus has and is some 8 kpc long. Seen end on, the bar is 4 kpc wide. To give some indication as to what fraction of the bar may be sampled by apertures used to measure a galaxy’s central velocity dispersion, 1 corresponds to 0.1 kpc at a distance of 20 Mpc. Central velocity dispersions are typically measured within the inner couple of arcseconds, thus sampling the inner 0.1 kpc in this example. The main family of orbits sustaining the bar are x1 orbits, which are like ellipses that are aligned with the bar and centred on the bar; these are of course different from purely radial orbits. As noted above, when this bar is viewed end-on, and at 90 degrees from this orientation (i.e. viewing the full length of the bar), the central stellar orbits will again be perpendicular to our line of sight. This, however, will not be the case at intermediate viewing angles. That is, the increase in velocity dispersion will be due to elliptical orbits entering the 0.1-0.2 kpc aperture when the bar has a position angle different from 0 or 90 degrees, with the maximum when the bar is at 45 degrees, contary to what one may at first imagine.
To roughly correct the observed central velocity dispersion () for broadening by non-circular disc motions due to a large-scale bar, and thus acquire the bulge velocity dispersion (), may require the use of an expression like
| (9) |
where is the inclination of the disc such that represents a face-on orientation, and is a value between 0 and 1 and proportional to the bar’s strength. The position angle of the bar, relative to the disc’s apparent minor axis, is denoted by . For the reason discussed above, the above correction is minimal when the bar is parallel to the projection axes (either major or minor axis). In passing we note the complication that as a disc’s inclination increases from face-on (0 degrees) to edge-on (90 degrees), the observed position angle of the bar can appear increasingly aligned with the (apparent) position angle of the disc (e.g. Debattista et al. 2002). Measured disc inclinations themselves can also be subject to the thickness of the disc, departures from circularity (e.g. Andersen et al. 2001) and potential ellipticity gradients in which the outer isophote shape depends on exposure depth.
In an effort to test if bar dynamics may be a viable (partial) explanation for the offset barred galaxies in the - diagram, we have, for an initial rough investigation, taken the disc inclination, position angle and measurements from Hyperleda (see Table 3), and assumed a -value of 0.7 for all. We note that the actual -value is currently unknown, and likely to be different for each galaxy, and we caution that the heterogeneous nature of the data that goes into HyperLeda will also be a source of scatter. Given the simplistic nature of equation 9, we were content, as a first approach, to estimate the bar’s position angle by eye. Figure 7 shows how the barred galaxies shift when using our rough estimate of rather than . One can see that, as expected, the corrections are significant only in the cases where , and thus MBH, are small, and that it shifts these cases towards smaller values.
Depending on the values of , this correction has the potential to improve the correlation. Obviously though, this work requires greater investigation than we are able to afford here. We also again remark that we have not dealt with the second, independent phenomena known as sigma-drops, which may potentially even account for some of the apparent over-shoot using equation 9.
| Gal. Id. | Type | incl.disc | P.A.bar | |
|---|---|---|---|---|
| km s-1 | deg. | deg. | ||
| IC 2560 | SBb | 196 | 65.6 | 70 |
| Milky Way | SBbc | 220 | 90.0 | 20 |
| NGC 253 | SBc | 194 | 78.0 | 45 |
| NGC 1023 | SB0 | 113 | 76.7 | 20 |
| NGC 1300 | SBbc | 167 | 49.3 | 60 |
| NGC 1316 | SB0 | 200 | 67.4 | 90 |
| NGC 2549 | SB0 | 70 | 90.0 | 20 |
| NGC 2778 | SB0 | 85 | 62.4 | 90 |
| NGC 2787 | SB0 | 182 | 66.2 | 10 |
| NGC 3079 | SBcd | 210 | 82.5 | 30 |
| NGC 3227 | SB | 130 | 68.4 | 70 |
| NGC 3368 | SBab | 194 | 54.7 | 55 |
| NGC 3384 | SB0 | 167 | 90.0 | 00 |
| NGC 3393 | SBab | 158 | 31.0 | 10 |
| NGC 3489 | SB0 | 157 | 63.7 | 70 |
| NGC 4151 | SBab | 144 | 60.0∗ | 10 |
| NGC 4258 | SBbc | 208 | 72.0 | 60 |
| NGC 4596 | SB0 | 155 | 36.7 | 15 |
| NGC 4945 | SBcd | 167 | 90.0 | 45 |
| NGC 7582 | SBab | 195 | 68.2 | 20 |
The maximum disc rotation velocities, , have been taken from HyperLeda. The disc inclinations have been obtained from available photometry, under the assumption that any intrinsic disc ellipticity is small and that the observed minor-to-major axis ratio is due to disc inclination (∗ taken from Graham & Li 2009). The rough position angle of the bars, P.A.bar, relative to the minor axis, has been estimated by eye.
4.4 Nuclear star clusters
The offset nature, or rather the location below the upper envelope of points, of some of the apparently non-barred AGN in the - diagram (Figure 3c) prompts one to consider alternative scenarios to bar dynamics. A couple of non-barred galaxies with direct SMBH mass measurements also appear to be offset from the barless - relation (see Figure 2). If they are not pseudo bulges, in which the bar has disappeared, then something other than elevated velocity dispersions may be responsible for their deviant nature.
It has already been noted by Graham (2008a) that the inactive galaxy NGC 2778 has only a weak bar, yet this nucleated galaxy is below the barless - relation by 0.7 dex. Curiously, the mass of the nuclear cluster in this galaxy is 5 times (i.e. 0.7 dex) greater than the mass of its black hole. Furthermore, the Milky Way and M32 have nuclear star cluster masses, , which are 10 more massive than their SMBH masses (Graham & Spitler 2009, and references therein).
Nuclear star clusters (Ferrarese et al. 2006; Wehner & Harris 2006) are now known to coexist with SMBHs at the centres of low- and intermediate-mass spheroids (Filippenko & Ho 2003; Graham & Driver 2007a; González Delgado et al. 2008; Seth et al. 2008; Graham & Spitler 2009). The star clusters undoubtedly contribute, at some level, to the feeding of the central black hole, whether by direct stellar infall (e.g., Lightman & Shapiro 1978; Merritt & Vasiliev 2010) or through stellar winds (e.g., Ciotti et al. 1991; Soria et al. 2006; Hueyotl-Zahuantitla et al. 2010). Schartmann et al. (2010), for example, describe how stellar mass loss from the nuclear star cluster (or nuclear disc, Davies et al. 2007) in NGC 1068 can feed the black hole of this active Seyfert galaxy. In unrelated work, Bekki & Graham (2010) argue why a seed SMBH in nuclear star clusters may be a necessary ingredient to explain the absence — through SMBH binary heating and ultimately erosion — of nuclear star clusters in massive galaxies built via hierarchical merging. Given the growing number of probable connections between SMBHs and nuclear star clusters, which is no doubt yet to be fully appreciated, it seems pertinent to explore the inclusion of the nuclear star cluster.
While we do not have nuclear star cluster masses for the AGN sample with (reverberation-mapping)-derived SMBH masses, and can not therefore re-derive the -factor, progress has commenced on acquiring star cluster masses for the local sample of predominantly inactive galaxies with direct SMBH mass measurements (Graham & Spitler 2009). In addition, Graham (2010, in prep.) tabulates yet more galaxies having both a massive black hole and a nuclear star cluster. Following Graham & Guzmán (2003) and Balcells et al. (2003, 2007), the nuclear star cluster fluxes have been derived by simultaneulsy fitting for the cluster, the host bulge and, when present, nuclear and large scale discs. Failing to account for these components can bias the Sérsic model used to describe the bulge light, and thus bias the flux of the nuclear star cluster. Foreground stars, background galaxies, and any apparent internal dust is masked out before the seeing convolved models are fit to each galaxy’s distribution of stellar light. The nuclear cluster fluxes are then converted into masses following the methodology in Graham & Spitler (2009).
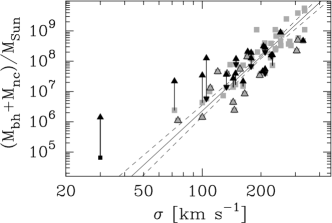
With this expanded data set, Figure 8 explores the speculation by Graham & Spitler (2009) that an insightful quantity to plot on the vertical axis may be the combination of the SMBH plus the nuclear star cluster mass. Nayakshin et al. (2009) discuss how competing feedback from a SMBH and a nuclear star cluster may explain either end of such an ()- relation (see also McLaughlin, King & Nayakshin 2006 and Cantalupo 2010). When both types of nuclei exist, it may make sense to combine their masses, and Figure 8 presents the first ever “()-” diagram showing this. Rather than treating galaxies as if they only have one type of nuclear component, Figure 8 shows that the low mass end of the - diagram flattens when transformed into the ()- diagram. While too far off topic for the present paper, Graham (2010, in prep.) expands this analyis to include (the transition to) low-mass galaxies for which only the nuclear star cluster mass is known.
If NCs have a different velocity dispersion than their host bulge, as is the case for NGC 205 (Carter & Sadler 1990, see their figure 2), then they could bias measurements of the host bulge’s central velocity dispersion . However, for most galaxies the NC-to-(host bulge) flux ratio will be small in typical ground-based aperture measurements, which could explain why observed “sigma-drops” are relatively rare, which is not to say that they do actually exist in great numbers. High spatial resolution spectra would be desirable for pursuing this issue of contamination at distances of the Virgo and Fornax galaxy clusters.
It is interesting that the galaxies with the smallest SMBHs in the left hand side of Figure 8 tend to be dusty Seyfert 2 galaxies with AGN flux that contaminates the nuclear stellar flux, and thus any NC mass measurement. These AGN with direct SMBH mass measurements are, like the reverberation-mapped AGN, offset below (or rightward of) the upper envelope of points in the - diagram. Their AGN flux, and dusty central region, may hide a nuclear star cluster and effectively bias these points low in the ()- diagram. Nonetheless, from Figure 8 it is apparent that the slope at the low-mass end of the ()- diagram is reduced relative to the - relation. As discussed in Graham (2010, in prep.), this behavior appears to track the change in slope seen in the luminosity-(velocity dispersion) diagram (e.g. De Rijcke et al. 2005; Matković & Guzmán 2005, and references therein), and is thus connected with the ()/ ratio.
4.5 Radiation Pressure
Marconi et al. (2008) explored the effect that radiation pressure (e.g. Mathews 1993), from the AGN’s continuum emission, may be having on the surrounding gas clouds, and thus the effect on measurements of the virial product. Such an outward force would counteract, at some level, the inward force of gravity on the gas. Marconi et al. (2008) therefore argued that neglecting the radiation pressure in reverberation mapping analyses results in a systematic under-estimation of true black hole masses. Armed with flux measurements at 5100Å, they empirically derived an -factor of 3.1, smaller than the value of 5.51.7 in Onken et al. (2004), but now with an extra luminosity-dependent term.
Marconi et al.’s (2008) radiation pressure term will result in an upward revision to the masses of high-accretion AGNs. Given that Narrow Line Seyfert 1 (NLS1) galaxies tend to have high accretion rates, and may reside below the M relation (Wandel 2002; Mathur & Grupe 2005; Wu 2009; but see Botte et al. 2005; Komossa & Xu 2007; Decarli et al. 2008a), Marconi et al. (2008) point out that the apparent offset of the NLS1 galaxies relative to the broad-line AGN may be due to past under-estimates of their black hole masses.
While Netzer (2009) concluded that radiation pressure is not significant, and that the empirically-determined value by Marconi et al. (2008) is too high, the rebuttal by Marconi et al. (2009) counters this. What remains unclear is whether the slight reduction in the scatter for the AGN relation is due to an improvement in the physical model or simply the addition of an extra fitting parameter (see Peterson 2010). Here we simply remark that a corrective term for radiation pressure would act to drive the -factor to even lower values. That is, while our present work has halved the commonly used value, it may still need to be revised further downward.
4.6 Implications for AGN
As a measure of the relationship between emission line widths and the gravitational potential of the central SMBH, the -factor is a direct constraint on the kinematics and geometry of the broad-line region. An value of 3 is implied for the simplest model of a BLR (Netzer 1990). The next level of sophistication in BLR modeling involves a flattening of the spatial distribution. Thin discs, thickened discs, or composites of planar and random motions have all been modeled by various groups (see discussions by Krolik 2001; Collin et al. 2006; Labita et al. 2006; Decarli et al. 2008b). The uniqueness of any of these solutions remains unclear, but improved estimation of both and the scatter around (to be expected with an inclination-dependent BLR model) are positive steps towards understanding the BLR geometry.
One consequence of our downward revision in the mean value of is to reduce the black hole masses for any AGNs calibrated to the Onken et al. (2004) result. Perhaps frustratingly, our lower value of gives masses quite similar to those which would have been produced by the simplistic BLR model which had been in use prior to the work by Onken et al. (modulo the relationship between FWHM and that one adopts). Obviously, the change in directly impacts any reverberation results that adopted the Onken et al. (2004) value (Peterson et al. 2004, 2005; Metzroth et al. 2006; Bentz et al. 2006, 2007, 2009a; Denney et al. 2006, 2009; Sergeev et al. 2007; Grier et al. 2008).
Furthermore, the single-epoch methods of SMBH mass estimation which were calibrated to the reverberation mapping results would be similarly affected (Vestergaard & Peterson 2006; McGill et al. 2008; Wang et al. 2009; Greene, Peng & Ludwig 2010). Because these single-epoch methods are the primary basis for estimating black hole masses from AGN spectra, the effects of changing can be far-ranging, from individual objects to large AGN surveys (Barth et al. 2005; Woo et al. 2006, 2008; Dong et al. 2007; Zhang et al. 2007; Treu et al. 2007; Vestergaard et al. 2008; Shen et al. 2008a,b; Trump et al. 2009; Merloni et al. 2010; Greene et al. 2010; Morgan et al. 2010; Lamastra et al. 2010).
For some applications, a new value has no significant ramifications: e.g., the evolution in the relationship between black holes and spheroids in AGN samples (e.g. Peng et al. 2006a,b; Bennert et al. 2010; Decarli et al. 2010a,b); or the slope of the active BH mass function (e.g. Kelly, Vestergaard & Fan 2009; Vestergaard & Osmer 2009). In other cases, the fact that the modifications at present are uniform to all BH masses means that the results are simply shifted by a factor of (e.g., the Eddington ratio distributions of AGNs: Kollmeier et al. 2006; the position of the peak in the black hole mass function: Kelly et al. 2009). In some circumstances, the shift in black hole masses may have a still larger impact (e.g., in modeling the growth of black holes over cosmic time: Yu & Lu 2008; Vestergaard & Osmer 2009).
However, it bears noting that, if differs for barred and non-barred AGNs, changes in the bar fraction with redshift and/or with galaxy mass could dramatically alter the conclusions of studies unaffected by a simple shift (i.e., the slope of the BH mass function, and the evolution of -galaxy relationships).
As a final example of potential implications, we discuss the growing evidence that massive black holes in high-redshift AGNs may pose a challenge to the notion that such objects can grow from stellar-mass seeds via normal (Eddington-limited) accretion in the time available since the Big Bang (Dietrich & Hamann 2004). To explore the impact of a revised value on such analyses, we focus on two particular objects. First, the M⊙ black hole found in the AGN, SDSS J1148+5251 (Willott, McLure & Jarvis 2003), was measured by a mass equation which assumed (for a line width measured by the FWHM). Our value would increase the BH mass for this object, making it even harder to grow such a massive BH at such an early time. In contrast, the BH mass in the AGN, Q0019+0107, of 9.5 M⊙ (Dietrich et al. 2009) would be halved, and would therefore no longer require a seed black hole quite so massive as 105 M⊙. These two cases demonstrate the complexity involved in comparing any SMBH masses in AGNs from the literature, especially since the pedigrees of such estimates are sometimes not clearly documented.
5 Conclusions
Using a sample of 64 galaxies with directly measured supermassive black hole masses, the “classical” or “standard” - relation (which contains galaxies of all morphological type) is shown here to have a steeper slope than previously recognised. Due to (i) the inclusion of more barred galaxies, which tend to be offset from the non-barred galaxies (Graham 2008a,b) and had previously been under-represented in the - diagram, along with (ii) increased black hole masses at the high-mass end of the - diagram (e.g. Gebhardt & Thomas 2009; Shen & Gebhardt 2009; van den Bosch & de Zeeuw 2010), and (iii) the use of a 10 per cent, rather than a rather optimistic 5 per cent, uncertainty on the velocity dispersion, the slope is now somewhere between 5 and 6 depending on the type of regression used (see Table 2). From a non-symmetrical regression of on , and using a 10 per cent uncertainty on the velocity dispersion, one has , with an r.m.s. scatter of 0.43 dex. While, formally, the intrinsic scatter is 0.32 dex, we note that a more detailed analaysis of the uncertainty in the velocity dispersions would be welcome.
If intermediate mass black holes exist (e.g. Greene & Ho 2004, 2007), and an observational selection bias is artificially truncating data in the - diagram below , then the above relation is biased. Using a regression of on gives the bias-free relation . When one doesn’t know the morphological type of their galaxy, these expressions are currently the best available estimators for from measurements of .
As was first pointed out by Graham (2007a, 2008a,b) and Hu (2008), the elliptical-only galaxies, and the non-barred galaxies, define tighter relations with less scatter and a reduced slope than is obtained when using the full galaxy sample. Furthermore, the barred - relation is shown here to reside 0.47 and 0.45 dex below the elliptical-only and barless - relations, respectively. When one knows the morphological type of their galaxy, these relations (given in Table 2) are preferred for predicting from measurements of (as described in Section 2.1.2). The barless and elliptical-only - relations have a total r.m.s. scatter of 0.37 and 0.34 dex, respectively, and a slope of 4.95 and 4.87 when constructed with a symmetrical treatment of the data. A slope which is also consistent (at the 1-sigma level) with a value of 5 is obtained from a linear regression of on (see Table 2).
In terms of an integer slope for the - relation, when constructed to address the “Theorist’s Question” (Novak et al. 2006), a value of 5 is thus preferred for elliptical galaxies, in agreement with the prediction by Silk & Rees (1998). Due to both new and refined SMBH masses, and increased values at the high-mass end, this slope has increased from the values around 4 that were reported by Graham (2008b), Hu (2008) and Gültekin et al. (2009b). The even steeper slope, close to a value of 6, which is obtained for the full galaxy sample is due to the relatively offset nature of the barred galaxies in the lower-left of the - diagram and the use of a linear regression not biased by sample selection which excludes BHs with .
Using a sample of 28 AGN with available virial products and host bulge velocity dispersion measurements, we have explored their location in the - diagram. We have then derived a new -factor for converting AGN virial products (equation 5) into black hole masses. Our value is a factor of two smaller than the commonly used value (Onken et al. 2004, see also Woo et al. 2010 who reported ). Moreover, this value might come down even further due to processes that may be acting to enhance the offset nature of AGN virial products from the - relation defined by predominantly inactive galaxies with direct measurements of their supermassive black hole. For example, radiation pressure from the AGN may be acting to partly counter-balance the inward force of gravity (on the broad line region clouds) due to the black hole, possibly resulting in anemic virial products (Marconi et al. 2008). Correcting for this possibility will only lower the derived -factor further. As such we conclude that our reduced -factor of ( when excluding NGC 5548) may still be an upper limit, and therefore some quasar and AGN masses in the literature are too high by at least a factor of 2. Some of the implications of this are discussed in Section 4.6.
This paper has also highlighted a number of issues. First, the impact of galaxy type (i.e. elliptical, barred, non-barred) and thus sample selection on the - relation is important. Depending on the relative numbers of barred and non-barred galaxies, the best-fitting - relation changes. This of course undermines past efforts which had focussed on the exact value of the slope. It also probably voids several evolutionary studies based on earlier - relations. The present study is also not immune from this, although the construction of barred and non-barred - relations for galaxies with directly measured SMBH masses is a positive step, plus this study is based on a larger and more representative sample of galaxies than ever before. Second, as the black hole masses continue to be updated and refined, systematic shifts in their masses can affect the - relation. For example, van den Bosch & de Zeeuw (2010) have shown how past assumptions that galaxies are either axisymmetric oblate spheroids or spherical, rather triaxial, has resulted in an underestimation of their SMBH mass. Gebhardt & Thomas (2009) have revealed how ignoring the dark matter’s influence on the stellar dynamics can bias the stellar mass-to-light ratio resulting in an underestimation of the SMBH mass. In the unlikely event that all of the current black hole masses at the high mass end are doubled, i.e. increased by 0.3 dex, it would result in a 10 per cent increase to the slope of the relation from to (i.e. over a range of 3 dex in SMBH mass). Third, this work confirms Graham’s (2007a;2008a,b) and Hu’s (2008) finding that the scatter about the - relation is quite large, and that velocity dispersion alone is therefore probably not the driving force which dictates SMBH mass; if it was all that mattered, then the barred galaxies would follow the same distribution as the non-barred galaxies in the - diagram.
There are several potential causes for this factor of 3 offset between the barred and non-barred galaxies in the - diagram, although it remains unclear what their various contributions are. Possibilities include heightened velocity dispersion measurements due to (i) elongated motions along a bar, (ii) vertical instabilities taking stars out of the disc plane, (iii) rotational shear due to approaching and receding parts of a disc within one’s aperture, and iv) the variety of orbital shapes in and around the bar. The previously ignored contribution from massive nuclear star clusters may also play a role (see Section 4.2). Nuclear star clusters are also prevalent in low-mass, elliptical galaxies. Including more of this galaxy type, to check for their offset behaviour in the - diagram, may be insightful. As a first step, we have presented the first ever - diagram (Figure 8), qualitatively showing how the slope at the low-mass end of the - diagram is shallower than it is at the high-mass end where nuclear star clusters are not detected.
| Gal. Id. | Class. | Virial Product | |
| [] | [km s-1] | ||
| 1 | 2 | 3 | 4 |
| 28 non-barred galaxies | |||
| 3C 120 | S0 (pec?) | 10.1 | 162 |
| Ark 120 | Sb pec | 27.23.5 | 239, |
| Arp 151 | S0 pec | 1.22A | 124, |
| Mrk 110 | Sc | 4.561.08 | 86, |
| Mrk 202 | Sc | 0.26A | 86, |
| Mrk 279 | S0 | 6.351.66 | 197 |
| Mrk 290 | E1 | 4.42B | … |
| Mrk 335 | S0/a | 2.580.67 | … |
| Mrk 509 | E2 | 26.12.1 | … |
| Mrk 590 | SA(s)a | 8.641.34 | 194, |
| Mrk 1310 | E | 0.41A | 50, |
| NGC 4395 | Sm | 0.065C | 25-35R, |
| NGC 4748 | Sa | 0.47A | 105 |
| NGC 5548 | (R’)SA(s)0/a | 12.1J | 183, |
| PG 0026+129 | E1 | 71.417.4 | … |
| PG 0052+251 | Sb | 67.313.7 | … |
| PG 0804+761 | E3 | 126.414.5 | … |
| PG 0844+349 | Sa | 16.87.0 | … |
| PG 0953+414 | E4 | 50.110.7 | … |
| PG 1226+023 | E3 | 160.634.1 | … |
| PG 1307+085 | E2 | 80.122.1 | … |
| PG 1411+442 | E4 | 80.526.5 | … |
| PG 1426+015 | E2 | 236.769.8 | 217 |
| PG 1613+658 | E2 | 50.7 | … |
| PG 1617+175 | E2 | 108.025.3 | 183 |
| PG 1700+518 | E1 | 142 | … |
| PG 2130+099 | (R)Sa | 6.9D | 172 |
| SBS 1116+583A | Sc | 1.05A | 50, |
| 14 barred galaxies | |||
| Fairall 9 | SBa | 46.310.0 | 228 |
| Mrk 79 | SBb | 9.522.61 | 130, |
| Mrk 142 | SB0/a | 0.40A | … |
| Mrk 817 | SBc | 9.46E | 142, |
| NGC 3227 | SAB(s) pec | 1.39B | 131, |
| NGC 3516 | (R)SB(s) | 5.76B | 144, |
| NGC 3783 | (R’)SB(r)a | 5.410.99 | 95 |
| NGC 4051 | SAB(rs)bc | 0.31B | 84, |
| NGC 4151 | (R’)SAB(rs)ab | 8.31F | 93, |
| NGC 4253 | SBa | 0.32A | 93 |
| NGC 4593 | (R)SB(rs)b | 1.8G | 124, |
| NGC 6814 | SBbc | 3.36A | 115, |
| NGC 7469 | (R’)SAB(rs)a | 2.210.25 | 152, |
| PG 1229+204 | SBc | 13.46.2 | 162 |
| 4 excluded galaxies | |||
| 1E 0754.6+3928 | ? | 21.0H | … |
| 3C 390.3 | Sa | 52.311.7 | 240, |
| IC 4329A | SA0 | 1.80I | 122 |
| PG 1211+143 | E2 | 26.5I,K | … |
Column 1. Galaxy Identification.
Column 2. Galaxy Classification from NED, except for Fairall 9 and PG 1229+204 which have been denoted as barred by Bentz et al. (2009b, their Table 5), plus Mrk 202 and SBS 1116+583A whose type has been assigned based on SDSS images and colour.
Column 3. Virial Product (and also black hole mass if ) using the data from Peterson et al. (2004) unless otherwise noted.
Column 4. Stellar velocity dispersions; the bold value is the weighted mean.
References and notes:
A Bentz et al. (2009a), line.
B Denney et al. (2010). C Peterson et al. (2005).
D Grier et al. (2008). E Weighted mean from Peterson et al. (2004) and Denney et al. (2010).
F Bentz et al. (2006). G Denney et al. (2006). H Sergeev et al. (2007).
I Time-lag uncertain (Peterson et al. 2004) and thus Virial Product not used.
J Weighted mean from Peterson et al. (2004), Bentz et al. (2009a) and Denney et al. (2010).
K Hβ and Hγ, but not Hα, line used here. L Nelson & Whittle (1995).
M Onken et al. (2004).
N Nelson et al. (2004).
O Greene & Ho (2006). P Woo et al. (2010).
Q Ferrarese et al. (2001), using their suggested 15 per cent uncertainty.
R Filippenko & Ho (2003, their section 3).
S Watson et al. (2008).
T Dasyra et al. (2007).
U Oliva et al. (1995). V Arribas et al. (1997).
W Green et al. (2004).
6 acknowledgment
We are grateful for Monica Valluri’s comments on an early version of this paper, in particular her words of caution regarding the accuracy and compatibility of literature velocity dispersions. E.Athanassoula acknowledges partial support from grant ANR-06-BLAN-0172. We acknowledge use of the HyperLeda database (http://leda.univ-lyon1.fr). This research has made use of the NASA/IPAC Extragalactic Database (NED).
After completion of this work we became aware of four additional velocity dispersion measurements for our AGN sample. Using a direct filtering method, Garcia-Rissmann et al. (2005) report velocities of 11620, 15324, 8311 and 12512 km s-1 for NGC 3783, 4593, 6814 and 7469, respectively. Within the quoted errors, these values agree with those used in this paper.
References
- [1] Akritas M.G., Bershady M.A., 1996, ApJ, 470, 706
- [2] Andersen D.R., Bershady M.A., Sparke L.S., Gallagher J.S. III, Wilcots E.M., 2001, ApJ, 551, L131
- [3] Arribas S., Mediavilla E., Garcia-Lorenzo B., del Burgo C., 1997, ApJ, 490, 227
- [4] Athanassoula E., 1992, MNRAS, 259, 328
- [5] Athanassoula E., 2005, MNRAS, 358, 1477
- [6] Athanassoula E., Misiriotis A., 2002, MNRAS, 330, 35
- [7] Bahcall J.N., Kozlovsky B.Z., Salpeter E.E., 1972, ApJ, 171, 467
- [8] Barth A.J., Greene J.E., Ho L.C., 2005, ApJ, 619, L151
- [9] Batcheldor D., et al., 2005, ApJS, 160, 76
- [10] Batcheldor D., 2010, ApJ, 711, L108
- [11] Beifiori A., Sarzi M., Corsini E.M., Dalla Bontà E., Pizzella A., Coccato L., Bertola F., 2009, ApJ, 692, 856
- [12] Bekki K., Graham A.W., 2010, ApJ, 714, L313
- [13] Bennert V.N., Treu T., Woo J.-H., Malkan M.A., Le Bris A., Auger M.W., Gallagher S., Blandford R.D., 2010, ApJ, 708, 1507
- [14] Bentz M.C., et al., 2006, ApJ, 651, 775
- [15] Bentz M.C., et al., 2007, ApJ, 662, 205
- [16] Bentz M.C., et al., 2009a, ApJ, 705, 199
- [17] Bentz M.C., Peterson B.M., Netzer H., Pogge R.W., Vestergaard M., 2009b, ApJ, 697, 160
- [18] Bentz M.C., Peterson B.M., Pogge, R.W., Vestergaard M., 2009c, ApJ, 694, L166
- [19] Blakeslee J.P., Lucey J.R., Tonry J.L., Hudson M.J., Narayanan V.K., Barris B.J., 2002, MNRAS, 330, 443
- [20] Blandford R.D., McKee C.F., 1982, ApJ, 255, 419
- [21] Botte V., Ciroi S., di Mille F., Rafanelli P., Romano A., 2005, MNRAS, 356, 789
- [22] Bureau M., Athanassoula E., 1999, ApJ, 522, 686
- [23] Bureau M., Athanassoula E., 2005, ApJ, 626, 159
- [24] Cantalupo S., 2010, MNRAS, 403, L16
- [25] Cappellari M., et al., in “Hunting for the Dark: The Hidden Side of Galaxy Formation”, Malta, eds. V.P. Debattista and C.C. Popescu, American Institute of Physics Conference Series, 1240, 211
- [26] Carter D., Sadler E., 1990, MNRAS, 245, 12P
- [27] Chung A., Bureau M., 2004, AJ, 127, 3192
- [28] Ciotti L., D’Ercole A., Pellegrini S., Renzini A., 1991, ApJ, 376, 380
- [29] Collin S., Kawaguchi T., Peterson B.M., Vestergaard M., 2006, A&A, 456, 75
- [30] Combes F., Debbasch F., Friedli D., Pfenniger D., 1990, A&A, 233, 82
- [31] Combes F., Sanders R.H., 1981, A&A, 96, 164
- [32] Dalla Bontà E., Ferrarese L., Corsini E.M., Miralda-Escudé J., Coccato L., Sarzi M., Pizzella A., Beifiori A., 2009, ApJ, 690, 537
- [33] Davies R.I., Sánchez F.M., Genzel R., Tacconi L.J., Hicks E.K.S., Friedrich S., Sternberg A., 2007, ApJ, 671, 1388
- [34] Dasyra K.M., et al., 2007, ApJ, 657, 102
- [35] Debattista V.P., Corsini E.M., Aguerri J.A.L., 2002, MNRAS, 332, 65
- [36] Decarli R., Dotti M., Fontana M., Haardt F., 2008a, MNRAS, 386, L15
- [37] Decarli R., Labita M., Treves A., Falomo R., 2008b, MNRAS, 387, 1237
- [38] Decarli R., Falomo R., Treves A., Kotilainen J.K., Labita M., Scarpa R., 2010a, MNRAS, 402, 2441
- [39] Decarli R., Falomo R., Treves A., Labita M., Kotilainen J.K., Scarpa R., 2010b, MNRAS, 402, 2453
- [40] Denney K., et al., 2006, ApJ, 653, 152
- [41] Denney K., et al., 2009, ApJ, 704, L80
- [42] Denney K., et al., 2010, IAU Symposium 267, 201
- [43] de Lorenzo-Cáceres A., Falcón-Barroso J., Vazdekis A., Martínez-Valpuesta I., 2008, ApJ, 684, L83
- [44] de Rijcke S., Michielsen D., Dejonghe H., Zeilinger W.W., Hau G.K.T., 2005, A&A, 438, 491
- [45] de Vaucouleurs G., de Vaucouleurs A., Corwin H.G.Jr., Buta R.J., Paturel G., Fouque P. 1991, Third Reference Catalogue of Bright Galaxies (Berlin: Springer)
- [46] Dietrich M., Hamann F., 2004, ApJ, 611, 761
- [47] Dietrich M., Mathur S., Grupe D., Komossa S., 2009, ApJ, 696, 1998
- [48] D’Onofrio M., Zaggia S.R., Longo G., Caon N., Capaccioli M., 1995, A&A, 296, 319
- [49] Dong, X., et al., 2007, ApJ, 657, 700
- [50] Emsellem E., Greusard D., Combes F., Friedli D., Leon S., Pécontal E., Wozniak H., 2001, A&A, 368, 52
- [51] Epinat B., Amram P., Balkowski C., Marcelin M., 2010, MNRAS, 401, 2113
- [52] Erwin P., Graham A., Caon, N., 2003b, in Carnegie Observatories Astrophysics Series, Vol. 1: Coevolution of Black Holes and Galaxies, ed. L.C.Ho (Cambridge: Cambridge Univ. Press)
- [53] Fabian A.C., 1999, MNRAS, 308, L39
- [54] Feigelson E.D., Babu G.J., 1992, ApJ, 397, 55
- [55] Ferrarese L., Pogge R.W., Peterson B.M., Merritt D., Wandel A., Joseph C.L., 2001, ApJ, 555, L79
- [56] Ferrarese L., et al., 2006, ApJ, 644, L21
- [57] Ferrarese L., Ford H.C, 2005, Space Science Reviews, 116, 523
- [58] Ferrarese L., Pogge R.W., Peterson B.M., Merritt D., Wandel A., Joseph C.L., 2001, ApJ, 555, L79
- [59] Ferrarese L., Merritt D., 2000, ApJ, 539, L9
- [60] Filippenko A.V., Ho L.C., 2003, ApJ, 588, L13
- [61] Franx M., Illingworth G., Heckman T., 1989, ApJ, 344, 613
- [62] Freedman W.L., et al., 2001, ApJ, 553, 47
- [63] Gadotti D.A., de Souza R.E., 2005, ApJ, 629, 797
- [64] Gadotti D.A., Kauffmann G., 2009, MNRAS, 399, 621
- [65] Gaskell C.M., 1988, ApJ, 325, 114
- [66] Gaskell C.M., 2009a, New Astronomy Reviews, 53, 140
- [67] Gaskell C.M., 2009b, in “Accretion and Ejection in AGNs: a Global View”, eds. L.Maraschi, G.Ghisellini, R.Della Ceca and F.Tavecchio, ASP Conf. Series, submitted (arXiv:0910.3945)
- [68] Gaskell C.M., 2009c, ApJ, submitted (arXiv:0908.0328)
- [69] Gebhardt K., et al., 2000a, ApJ, 539, L13
- [70] Gebhardt K., et al., 2000b, ApJ, 543, L5
- [71] Gebhardt K., et al., 2003, ApJ, 583, 92
- [72] Gebhardt K., Thomas J., 2009, ApJ, 700, 1690
- [73] Gillessen S., Eisenhauer F., Fritz T.K., Bartko H., Dodds-Eden K., Pfuhl O., Ott T., Genzel R., 2009, ApJ, 707, L114
- [74] González Delgado R.M., Pérez E., Cid Fernandes R., Schmitt H., 2008, AJ, 135, 747
- [75] Graham A.W., 2007a, Bulletin of the American Astronomical Society, 38, 759
- [76] Graham A.W., 2007b, MNRAS, 379, 711
- [77] Graham A.W., 2008a, ApJ, 680, 143
- [78] Graham A.W., 2008b, PASA, 25, 167
- [79] Graham A.W., Colless M.M., 1997, MNRAS, 287, 221
- [80] Graham A.W., Colless M.M., Busarello G., Zaggia S., Longo G., 1998, A&AS, 133, 325
- [81] Graham A.W., Driver S.P., 2007a, ApJ, 655, 77
- [82] Graham A.W., Driver S.P., 2007b, MNRAS, 380, L15
- [83] Graham A.W., Li I., 2009, ApJ, 698, 812
- [84] Graham A.W., Spitler L., 2009, MNRAS, 397, 2148
- [85] Green R.F., Nelson C.H., Boroson T., 2004, in Coevolution of Black Holes and Galaxies, ed. L.C.Ho (Pasadena: Carnegie Obs.)
- [86] Greene J.E., Ho L.C., 2004, ApJ, 610, 722
- [87] Greene J.E., Ho L.C., 2006, ApJ, 641, 117
- [88] Greene J.E., Ho L.C., 2007, ApJ, 670, 92
- [89] Greene J.E., Peng C.Y., Ludwig R.R., 2010, ApJ, 709, 937
- [90] Grier C., et al., 2008, ApJ, 688, 837 OA
- [91] Gültekin K., et al., 2009a, ApJ, 695, 1577
- [92] Gültekin K., et al., 2009b, ApJ, 698, 198
- [93] Haehnelt M.G., Natarajan P., Rees M.J., 1998, MNRAS, 300, 817
- [94] Héraudeau P., Simien F., 1998, A&AS, 133, 317
- [95] Hu J., 2008, MNRAS, 386, 2242
- [96] Hueyotl-Zahuantitla F., Tenorio-Tagle G., Wünsch R., Silich S., Palouš J., 2010, ApJ, 716, 324
- [97] Illingworth G., 1981, Structure and Evolution of Normal Galaxies, Cambridge University Press, p.27
- [98] Karachentsev I.D., et al., 2007, AJ, 133, 504
- [99] Kelly B.C., Vestergaard M., Fan X., 2009, ApJ, 692, 1388
- [100] Kollmeier J.A., et al., 2006, ApJ, 648, 128
- [101] Komossa S., Merritt D., 2008, ApJ, 689, L89
- [102] Komossa S., Xu D., 2007, ApJ 667, L33
- [103] Kondratko P.T., Greenhill L.J., Moran J.M., 2008, ApJ, 678, 87
- [104] Koratkar A.P., Gaskell C.M., 1991, ApJS, 75, 719
- [105] Kormendy J., 1977, ApJ, 218, 333
- [106] Kormendy J., Kennicutt R, 2004, ARAA, 42, 603
- [107] Kormendy J., Illingworth G., 1982, ApJ, 256, 460
- [108] Krajnović D., McDermid R.M., Cappellari M., Davies R.L., 2009, MNRAS, 399, 1839
- [109] Krolik J.H., 2001, ApJ, 551, 72
- [110] Labita M., Treves A., Falomo R., Uslenghi M., 2006, MNRAS, 373, 551
- [111] Lamastra A., Menci N., Maiolino R., Fiore F., Merloni A., 2010, MNRAS, 405, 29
- [112] Lightman A.P., Shapiro S.L., 1978, Reviews of Modern Physics, 50, 437
- [113] Liu J.-C., Zhu Z., 2010, Research in Astronomy and Astrophysics, 10, 541
- [114] Lodato G., Bertin G., 2003, A&A, 398, 517
- [115] Lynden-Bell D., Faber S.M., Burstein D., Davies R.L., Dressler A., Terlevich R.J., Wegner G., 1988, ApJ, 326, 19
- [116] Madore B.F., et al., 1999, ApJ, 515, 29
- [117] Marconi A., Hunt L.K., 2003, ApJ, 589, L21
- [118] Marconi A., Axon D.J., Maiolino R., Nagao T., Pastorini G., Pietrini P., Robinson A., Torricelli G., 2008, ApJ, 678, 693
- [119] Marconi A., Axon D.J., Maiolino R., Nagao T., Pietrini P., Risaliti G., Robinson A., Torricelli G., 2009, ApJ, 698, L103
- [120] Mathur S., Grupe D., 2005, ApJ, 633, 688
- [121] Matković A., Guzmán R., 2005, MNRAS, 362, 289
- [122] Mathews W.G., 1993, ApJ, 412, L17
- [123] McElroy D.B., 1995 ApJS, 100, 105
- [124] McGill K.L., Woo J.-H., Treu T., Malkan M.A., 2008, ApJ, 673, 703
- [125] McLaughlin D.E., King A.R., Nayakshin S., 2006, ApJ, 650, L37
- [126] McLure R., Dunlop J., 2002, MNRAS, 331, 795
- [127] McLure R., Dunlop J., 2004, MNRAS, 352, 1390
- [128] Merloni A., et al., 2010, ApJ, 708, 137
- [129] Merritt D., Ferrarese L., 2001a, ApJ, 547, 140
- [130] Merritt D., Ferrarese L., 2001b, in “The Central Kiloparsec of Starbursts and AGN: The La Palma Connection”, ASP Conference Proceedings Vol. 249. J. H. Knapen, J. E. Beckman, I. Shlosman, and T. J. Mahoney eds. San Francisco: Astronomical Society of the Pacific, p.335.
- [131] Merritt D., Sellwood J.A., 1994, ApJ, 425, 551
- [132] Merritt D., Vasiliev E., 2010, ApJ, submitted (arXiv:1005.0040)
- [133] Metzroth K.G., Onken C.A., Peterson B.M., 2006, ApJ, 647, 901
- [134] Morgan C.W., Kochanek C.S., Morgan N.D., Falco E.E., 2010, ApJ, 712, 1129
- [135] Naik S., Das M., Jain C., Paul B., 2010, MNRAS, 404, 2056
- [136] Nayakshin S., Wilkinson M.I., King A., 2009, MNRAS, 398, L54
- [137] Nelson C.H., Green R.F., Bower G., Gebhardt K., Weistrop D., 2004, ApJ, 615, 652
- [138] Nelson C.H., Whittle M., 1995, ApJS, 99, 67
- [139] Netzer H., 1990, Active Galactic Nuclei, SAAS-FEE Advanced Course 20, ed. T. J.-L. Courvoisier & M. Mayor (Berlin: Springer), 57
- [140] Netzer H., 2009, ApJ, 695, 793
- [141] Netzer H., Peterson B.M., 1997, in Astronomical Time Series, ed. D. Maoz, A. Sternberg, & E.M. Leibowitz (Dordrecht: Kluwer), 85
- [142] Neumayer N., 2010, PASA, in press (arXiv:1002.0965)
- [143] Novak G.S., Faber S.M., Dekel A., 2006, ApJ, 637, 96
- [144] Nowak N., Saglia R.P., Thomas J., Bender R., Davies R.I., Gebhardt K., 2008, MNRAS, 391, 1629
- [145] Nowak N., Thomas J., Erwin P., Saglia R.P., Bender R., Davies R.I., 2010, MNRAS, 403, 646
- [146] Oliva E., Origlia L., Kotilainen J.K., Moorwood A.F.M., 1995, A&A 301, 55
- [147] Onken C.A., et al., 2007, ApJ, 670. 105
- [148] Onken C.A., Ferrarese L., Merritt D., Peterson B.M., Pogge R.W., Vestergaard M., Wandel A., 2004, ApJ, 615, 645
- [149] Onken C.A., Peterson B.M., 2002, ApJ, 572, 746
- [150] Paturel G., Petit C., Prugniel P., Theureau G., Rousseau J., Brouty M., Dubois P., Cambrésy L., 2003, A&A, 412, 45
- [151] Peng C.Y., Ho L.C., Impey C.D., Rix H., 2002, AJ, 124, 266
- [152] Peng C.Y., Impey C.D., Rix H.-W., Kochanek C.S., Keeton C.R., Falco E.E., Lehar J., McLeod B.A., 2006a, ApJ, 649, 616
- [153] Peng C.Y., Impey C.D., Ho L.C., Barton E.J., Rix H.-W., 2006b, ApJ, 640, 114
- [154] Perez I., Sanchez-Blazquez P., Zurita A., 2009, A&A, 495, 775
- [155] Peterson B.M., 2010, IAU Symposium 267, 151
- [156] Peterson B.M., et al., 2004, ApJ, 613, 682
- [157] Peterson B.M., et al., 2005, ApJ, 632, 799
- [158] Peterson B.M., Wandel A., 2000, ApJ, 540, L13
- [159] Press W.H., Teukolsky S.A., Vetterling W.T., Flannery B.P., 1992, Numerical Recipes (2nd ed.; Cambridge: Cambridge Univ. Press)
- [160] Raha N., Sellwood J.A., James R.A., Kahn F.D., 1991, Nature, 352, 411
- [161] Rekola R., Richer M.G., McCall M.L., Valtonen M.J., Kotilainen J.K., Flynn C., 2005, MNRAS, 361, 330
- [162] Rodríguez-Rico C.A., Goss W.M., Zhao J.-H., Gómez Y., Anantharamaiah K.R., 2006, ApJ, 644, 914
- [163] Saha K., Tseng Y.-H., Taam R.E., 2010, ApJ, 721, 1878
- [164] Schartmann M., Burkert A., Krause M., Camenzind M., Meisenheimer K., Davies R.I., 2010, MNRAS, 403, 1801
- [165] Sergeev S.G., Klimanov S.A., Chesnok N.G., Pronik V.I., 2007, Astronomy Letters, 33, 429
- [166] Seth A., Agüeros M., Lee D., Basu-Zych A., 2008, 678, 116
- [167] Seth A., et al., 2010, ApJ, 714, 713
- [168] Seyfert C.K., 1943, ApJ, 97, 28
- [169] Shen J., Gebhardt K., 2010, ApJ, 711, 484
- [170] Shen J., Vanden Berk D.E., Schneider D.P., Hall, P.B., 2008a, AJ, 135, 928
- [171] Shen Y., Greene J.E., Strauss M.A., Richards G.T., Schneider D.P., 2008b, ApJ, 680, 169
- [172] Shields G.A., 1974, ApJ, 191, 309
- [173] Silk J., Rees M.J., 1998, A&A, 331, L1
- [174] Simonneau E., Prada F., 2004, Revista Mexicana de Astronomia y Astrofisica, 40, 69
- [175] Slavcheva-Mihova L., Mihov B., 2010, A&A, in press (arXiv:1011.1772)
- [176] Smith R.J., Lucey J.R., Hudson M.J., Schlegel D.J., Davies R.L., 2000, MNRAS, 313, 469
- [177] Soria R., Graham A.W., Fabbiano G., Baldi A., Elvis M., Jerjen H., Pellegrini S., Siemiginowska A., 2006, ApJ, 640, 143
- [178] Soria R., Hau G.K.T., Graham A.W., Kong A.K.H., Kuin N.P.M., Li I.-H., Liu J.-F., Wu K., 2010, MNRAS, 405, 870
- [179] Souffrin S., 1968, Annales d’Astrophysique, 31, 569
- [180] Taylor J.R., 1997, An introduction to error analysis: the study of uncertainties in physical measurements, edition 2, University Science Books
- [181] Thornton C.E., Barth, A.J., Ho L.C., Rutledge R.E., Greene J.E., 2008, ApJ, 686, 892
- [182] Tonry J., et al., 2001, ApJ, 546, 681
- [183] Tremaine S., et al., 2002, ApJ, 574, 740
- [184] Treu T., Woo J.-H., Malkan M.A., Blandford R.D., 2007, ApJ, 667, 117
- [185] Trujillo I., Graham A.W., Caon N., 2001, MNRAS, 326, 869
- [186] Trump J.R., et al., 2009, ApJ, 700, 49
- [187] Valluri M., Merritt D., Emsellem E., 2004, ApJ, 602, 66
- [188] van den Bosch R.C.E., de Zeeuw P.T., 2010, MNRAS, 401, 1770
- [189] van Dokkum P.G., Kriek M., Franx M., 2009, Nature, 460, 717
- [190] Vestergaard M., Fan X., Tremonti C.A., Osmer P.S., Richards G.T., 2008, ApJ, 674, L1
- [191] Vestergaard M., Osmer P.S., 2009, ApJ, 699, 800
- [192] Vestergaard M., Peterson B.M., 2006, ApJ, 641, 689
- [193] Wandel A., 2002, ApJ, 565, 762
- [194] Wandel A., Peterson B.M., Malkan M.A., 1999, ApJ, 526, 579
- [195] Wang J.-G., et al., 2009, ApJ, 707, 1334
- [196] Watson L.C., Martini P., Dasyra K.M., Bentz M.C., Ferrarese L., Peterson B.M., Pogge R.W., Tacconi L.J., 2008, ApJ, 682, L21
- [197] Wehner E.H., Harris W.E., 2006, ApJ, 644, L17
- [198] Wiersema K., Farrell S.A., Webb N.A., Servillat M., Maccarone T.J., Barret D., Godet O., 2010, ApJL, in press (arXiv:1008.4125)
- [199] Willott C.J., McLure R.J., Jarvis M.J., 2003, ApJ, 587, L15
- [200] Woo J.-H., Treu T., Malkan M.A., Blandford R.D., 2006, ApJ, 645, 900
- [201] Woo J.-H., Treu T., Malkan M.A., Blandford R.D., 2008, ApJ, 681, 925
- [202] Woo J.-H., et al., 2010, ApJ, 716, 269
- [203] Wozniak H., Combes F., Emsellem E., Friedli D., 2003, A&A, 409, 469
- [204] Wu Q., 2009, MNRAS, 398, 1905
- [205] Yu Q., Lu Y., 2008, ApJ, 689, 732
- [206] Zhang X.-G., Dultzin-Hacyan D., Wang T.G., 2007, MNRAS, 376, 1335
- [207] Zhu, L., & Zhang, S. 2010, Science in China G: Physics and Astronomy, 53, 196
- [208] Zhu L., Zhang S.N., Tang S., 2009, ApJ, 700, 1173