Segregation of receptor-ligand complexes in cell adhesion zones: Phase diagrams and role of thermal membrane roughness
Abstract
The adhesion zone of immune cells, the ‘immunological synapse’, exhibits characteristic domains of receptor-ligand complexes. The domain formation is likely caused by a length difference of the receptor-ligand complexes, and has been investigated in experiments in which T cells adhere to supported membranes with anchored ligands. For supported membranes with two types of anchored ligands, MHCp and ICAM1, that bind to the receptors TCR and LFA1 in the cell membrane, the coexistence of domains of TCR-MHCp and LFA1-ICAM1 complexes in the cell adhesion zone has been observed for a wide range of ligand concentrations and affinities. For supported membranes with long and short ligands that bind to the same cell receptor CD2, in contrast, domain coexistence has been observed for a rather narrow ratio of ligand concentrations. In this article, we determine detailed phase diagrams for cells adhering to supported membranes with a statistical-physical model of cell adhesion. We find a characteristic difference between the adhesion scenarios in which two types of ligands in a supported membrane bind (i) to the same cell receptor or (ii) to two different cell receptors, which helps to explain the experimental observations. Our phase diagrams fully include thermal shape fluctuations of the cell membranes on nanometer scales, which lead to a critical point for the domain formation and to a cooperative binding of the receptors and ligands.
1 Introduction
Cell adhesion is mediated by the specific binding of a variety of membrane-anchored receptor and ligand molecules. In 1990, Springer suggested that the length difference of receptor-ligand complexes in the contact zone of immune cells may lead to segregation, i.e. to the formation of domains within the cell contact zone that contain receptor-ligand complexes with different lengths [1]. The ‘length’ of a receptor-complex here is the intermembrane distance, or local membrane separation at the site of the complex. A length difference between receptor-ligand complexes leads to an indirect, membrane-mediated repulsion of the complexes because the membranes have to bend to compensate the mismatch, which costs bending energy. Important receptor-ligand complexes in T-cell adhesion are the TCR-MHCp complex with a length of about 13 nm [2], the CD2-CD48 complex with the same length of 13 nm [3, 4, 5], and the LFA1-ICAM1 complex with a length of about 40 nm [6]. In 1998 and 1999, the contact zone of T cells was indeed found to contain domains that either contain the short TCR-MHCp or the long LFA1-ICAM1 complexes [7, 8]. As expected from their length, the CD2-CD48 complexes are located within the TCR-MHCp domains [5]. However, the question whether the domain formation is predominantly caused by the length mismatch of receptor-ligand complexes is complicated by the role of the actin cytoskeleton, which polarizes during T-cell adhesion and transports clusters of TCR-MHCp complexes towards the center of the cell contact zone [9, 10, 11], and by additional, direct protein-protein interactions [12]. The domain formation is closely linked to T-cell activation, with TRC clusters forming within seconds of T-cell adhesion triggering the first activation signals [13, 9].
Direct evidence for a central role of the length of receptor-ligand complexes comes from experiments in which these lengths are altered by protein engineering [14, 5]. Milstein and coworkers [5] have considered variants of the protein CD48 with four and five immunoglobolin-like (Ig-like) domains. The CD48 variants are longer than the CD48 wildtype, which contains only two Ig-like domains. The CD48 wildtype and both CD48 variants bind to CD2 on T cells. From electron micrographs of the contact zone between T cells and supported membranes that contain one of the three CD48 types, Milstein and coworkers found that the length of the CD2-CD48 complex is 12.8 1.4 nm for wildtype CD48, 14.2 1.2 nm for the CD48 variant with four Ig-like domains, and 15.6 1.4 nm for the variant with five Ig-like domains. In fluorescence experiments of T cells on supported membranes that contain mixtures of two of the three CD48 types, Milstein and coworkers observed that CD2-CD48 wildtype complexes segregate from both CD2-CD48 variant complexes. The segregation seems to be driven by the length difference of the complexes since the T-cell cytoskeleton can only ‘act on’ CD2 and, thus, can hardly ‘discriminate’ between the different complexes. However, Milstein and coworkers observe domain coexistence in the contact zone only within a narrow range of concentration ratios of CD48 wildtype and CD48 variants. For T cells adhering to supported membranes with MHCp and ICAM1, in contrast, domain coexistence has been observed for a rather wide range of MHCp and ICAM1 concentrations and affinities [8, 15, 9].
In this article, we calculate detailed phase diagrams for cells adhering to supported membranes with anchored ligands. We consider two general adhesion scenarios: In the first scenario, long and short ligands in the supported membrane bind to the same cell receptor (see section 4), as in the experiments of Milstein and coworkers [5], in which CD48 wildtype and a CD28 variant in the supported membrane both bind to CD2 in the T-cell membrane. In the second scenario, two types of ligands in the supported membrane bind to two types of receptors in the cell membrane (see section 5), as in experiments in which MHCp and ICAM1 in the supported membrane bind to TCR and LFA1 in the T-cell membrane. We find a characteristic difference between the phase diagrams in the two scenarios (see fig. 5). In the first scenario, domain coexistence only occurs along a coexistence line. In the second scenario, in contrast, domain coexistence occurs in a wide coexistence region. Our phase diagrams thus help to understand why Milstein and coworkers observe domain coexistence only within a narrow range of concentration ratios.
Our calculations are based on a statistical-physical model of cell adhesion (see section 2). In this model, the membranes are described as elastic sheets discretized into small patches that can contain single receptor or ligand molecules [16, 17, 18, 19]. The binding and domain formation of receptor-ligand complexes is affected by thermally excited shape fluctuations of the membranes on nanometer scales. These shape fluctuations lead to a critical point for the segregation of long and short receptor-ligand complexes [20, 19]. The critical point depends on the length difference of the complexes, on the concentrations and affinities of the receptors and ligands, and on the bending rigidity of the membranes (see section 4). The critical point constitutes a threshold for segregation, or domain formation, and may help to understand why Milstein and coworkers have observed segregation of wildtype CD48 from each of the two CD48 variants, but not segregation of the two CD48 variants [5]. In addition, the membrane shape fluctuations on nanoscales lead to a cooperative binding of receptor-ligand complexes [21] (see section 3).
2 Statistical-physical description of cell adhesion
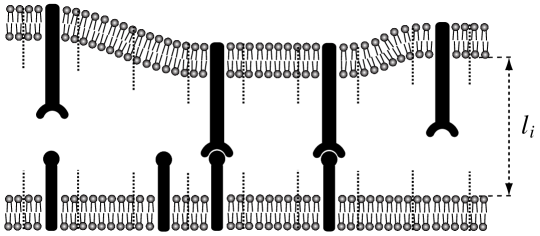
Cell adhesion involves length scales that differ by orders of magnitude (see fig. 1). The diameters of the cell and cell contact zone have values of several micrometers, while the average separation of the membranes within the contact zone is typically tens of nanometers. Other important length scales in the cell contact zone are the average distance between receptor-ligand bonds, and the binding width of receptor and ligand molecules. The binding width is the difference between the smallest and the largest local membrane separation at which the molecules can bind. The binding width of the typically rather stiff receptor and ligand proteins that mediate cell adhesion is much smaller than the length of the proteins.
The binding equilibrium and segregation of receptor-ligand complexes in cell contact zones is affected by membrane shape deformations and fluctuations. Since bound receptor-ligand complexes constrain the local separation of the membranes, the relevant deformations and fluctuations of the membranes occur on lateral length scales smaller than the average distance between neighboring pairs of complexes, which is about 100 nanometers for complex concentrations of about 100 per square micrometer [8]. It is reasonable to assume that the elasticity of the membranes is dominated by their bending rigidity on these length scales. The binding rigidity dominates over the membrane tension on lateral length scales smaller than the crossover length [22], which is of the order of several hundred nanometers for cell membranes [23]. The cytoskeletal elasticity [24, 25, 26, 27] contributes on length scales larger than the average distance between the cytoskeletal anchors in the membrane, which may be around 100 nanometers [28]. The bending rigidity thus is likely to dominate over the lateral tension and the cytoskeletal elasticity on lateral length scales up to 100 nanometers relevant here.
We have developed discrete models for the adhesion of membranes via anchored receptors and ligands [16, 29, 18, 19]. In discrete models, the two apposing membranes in the contact zone of cells or vesicles are divided into small patches [16, 29, 17, 30, 31, 20, 18, 32, 23, 33, 34, 35, 36]. In our models, the rigidity-dominated elasticity of the membranes in the contact zones of cells or vesicles is described by [16, 18]
| (1) |
where is the local separation of the apposing membrane patches . The elastic energy depends on the mean curvature of the separation field with the discretized Laplacian . Here to are the membrane separations at the four nearest-neighbor patches of membrane patch on the quadratic array of patches. The linear size of the membrane patches is chosen to be around 5 nm to capture the whole spectrum of bending deformations of the lipid membranes [37]. The ‘effective bending rigidity’ of the two membranes with rigidities and is . If one of the membranes, e.g. membrane 2, is a planar supported membrane, the effective bending rigidity equals the rigidity of the apposing membrane since the rigidity of the supported membrane is taken to be much larger than .
The overall energy of the membranes in the cell contact zone
| (2) |
is the sum of the elastic energy and interaction energy . The interaction energy depends on the distribution of the receptors in membrane 1, on the distribution of the receptors in membrane 2, and on the separation field of the membranes. In our models, each patch of the discrete membranes can only be occupied by one receptor or ligand molecule. Mobile receptor and ligand molecules diffuse by ‘hopping’ from patch to patch, and the thermal fluctuations of the membranes are reflected in variations of the local separation of apposing membrane patches. A receptor can bind to a ligand molecule if the ligand is located in the membrane patch apposing the receptor, and if the local separation of the membranes is close to the length of the receptor-ligand complex (see fig. 2 and below). In discrete models, the receptor and ligand molecules are taken into account as individual molecules. In continuum models, in contrast, the distributions of receptor and ligand molecules on the membranes are described by continuous concentration profiles [38, 39, 40, 41, 42, 43, 44, 45, 46, 47, 48].
3 Adhesion via a single type of receptor-ligand complexes
3.1 Interaction energy of receptors and ligands
We first consider the case in which the adhesion is mediated by a single type of receptor-ligand complexes. Examples of this case are (i) cells adhering to supported membranes that contain a single type of ligand [49, 50, 5, 51], and (ii) vesicles with anchored receptors that adhere to supported membranes or surfaces with complementary ligands [52, 53, 54, 55, 56, 57, 58, 35, 59, 60, 61, 62]. The interactions of receptors and ligands within the contact zone of the cell or vesicle are described by the interaction energy [17, 21]
| (3) |
in our model. Here, the occupation number or 0 indicates whether a receptor is present or absent in membrane patch of the cell, and or 0 indicates whether a ligand is present or absent in patch of the apposing membrane. Receptor and ligand molecules in apposing patches of the membranes interact with the potential . For simplicity, we describe this interaction by the square-well potential
| (4) | |||||
which depends on the binding energy , and the length and binding width of a receptor-ligand complex. A receptor thus binds to an apposing ligand with energy if the local separation of the membranes is within the binding range .
3.2 Effective adhesion potential
The binding equilibrium of the membranes in the contact zone can be determined from the free energy , where is the partition function of the system, is Boltzmann’s constant, and is the temperature. The partition function is the sum over all possible membrane configurations, with each configuration weighted by the Boltzmann factor . A membrane configuration in the contact zone is specified by the separation field of the membranes, the distribution of the receptors in the cell membrane, and the distribution of ligands in the apposing membrane. In our model, the partial summation in the partition function over all possible distributions and of receptors and ligands can be performed exactly, which leads to an effective adhesion potential. The effective adhesion potential is a square-well potential with (i) the same binding range as the receptor-ligand interaction (5) and (ii) an effective potential depth that depends on the concentrations and binding energy of receptors and ligands [17, 18, 21]:
| (5) | |||||
For typical concentrations of receptors and ligands in cell adhesion zones up to hundred or several hundred molecules per square micrometer, the average distance between neighboring pairs of receptor and ligand molecules is much smaller than the width of the molecules. For these small concentrations, the effective binding energy of the membranes is [21]
| (6) |
where is the area concentration of unbound receptors in the cell membrane, and is the area concentration of unbound ligands in the apposing membrane. The binding equilibrium in the contact zone thus can be determined from considering two membranes with the elastic energy (1) that interact via an effective adhesion potential with well depth and width .
3.3 Area fraction of the membranes within binding range of receptors and ligands
Receptor-ligand complexes can only form at membrane patches with a local separation within the binding range of the receptors and ligands (see eq. (5)). The area concentration of the receptor-ligand complexes in the contact zone therefore is proportional to the fraction of these membrane patches [21]:
| (7) |
Here, is the equilibrium constant for receptor-ligand binding within this membrane fraction. In our model, the equilibrium constant is .
In equilibrium, the fraction of membrane patches with a local separation within receptor-ligand binding range depends on the effective binding energy , the binding width , the effective rigidity of the membranes, and the temperature . We have found that the effect of these four quantities on can be captured by a single dimensionless quantity, the rescaled effective potential depth [21]
| (8) |
To a first approximation, the membrane fraction depends only on for typical lengths and concentrations of receptor-ligand complexes in cell adhesion zones. In cell adhesion zones, direct contacts between the membranes can be neglected since the average separation of the membranes, which depends on the length of the complexes, is typically larger than the thermal membrane roughness [21].
From Monte Carlo simulations, we have found that the functional dependence of the area fraction on the rescaled potential depth is well described by
| (9) |
with the dimensionless coefficient [21]. The membrane fraction increases with and, thus, increases with the effective binding energy and the effective bending rigidity . The reason for this increase is that the roughness of the membranes resulting from thermal shape fluctuations decreases with and . The membrane fraction decreases with the temperature since the roughness increases with . The thermal roughness, defined as the standard deviation of the local membrane separation from its average, is the characteristic length scale for membrane excursions in the perpendicular direction. The membrane fraction within receptor-ligand binding range is much smaller than 1 if the roughness is large compared to the binding width of the complexes, and close to 1 if the roughness is small compared to .
3.4 Concentrations of bound and unbound receptors of an adhering cell
From eqs. (7) to (9), we obtain the relation [21]
| (10) |
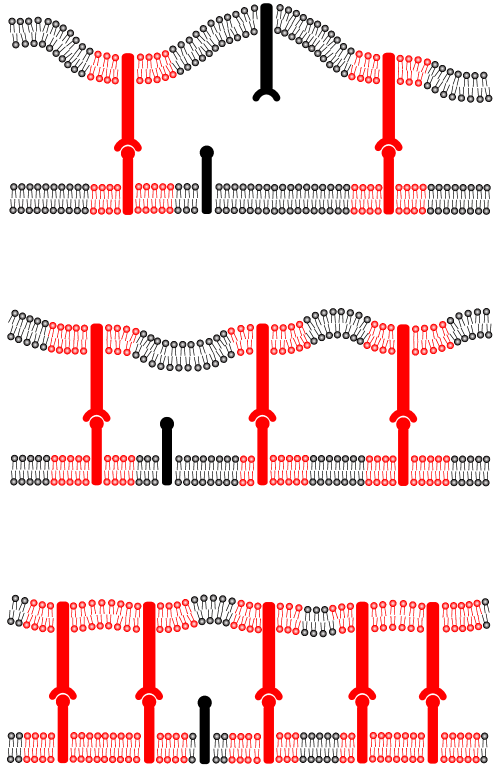
between the area concentration of bound receptor-ligand complexes in the contact zone and the area concentrations and of unbound receptors and ligands. This nonlinear relation reflects the cooperative binding of receptors and ligands. This cooperativity arises because the binding of receptors and ligands suppresses thermal membrane fluctuations and, thus, smoothens the membranes, which facilitates the binding of additional receptors and ligands (see fig. 3).
The total number of receptors in the cell membrane is constant. The concentrations of bound and unbound receptors are therefore connected by the additional relation [19]
| (11) |
where is the total area of the cell membrane, and the contact area. We have neglected here the area occupied by bound receptor-ligand complexes since this area is small compared to the total contact area for typical concentrations in cell adhesion zones. The concentrations of unbound receptors within and outside of the contact area then are equal. Together, the two relations (10) and (11) determine the concentration of unbound receptors and the concentration of bound receptors in the contact zone.
4 Two types of membrane-anchored ligands adhering to the same cell receptor
4.1 Interaction energy of receptors and ligands
In recent experiments by Milstein and coworkers [5], long and short ligands anchored to a supported membrane bind to the same receptor of an adhering T cell. These ligands are wildtype CD48 and elongated CD48 variants, and the receptor in the T cell membrane is CD2. In our model, this situation is described by the interaction energy
for the two apposing membranes in the cell contact zone. Here, the occupation number , 2, or 0 indicates whether a ligand of type 1, a ligand of type 2, or no ligand is present in patch of the supported membrane, and or 0 indicates whether a receptor is present or not in the apposing patch of the cell membrane. The Kronecker symbol equals 1 for and is equal to 0 for . The potential thus describes the interaction of the receptor with the ligand protein , and the potential the interaction between and . For simplicity, and are again taken to be
| (12) | |||||
and
| (13) | |||||
with binding energies and and equilibrium lengths of the complexes and . We have assumed here that the two complexes have the same binding width .
4.2 Effective adhesion potential
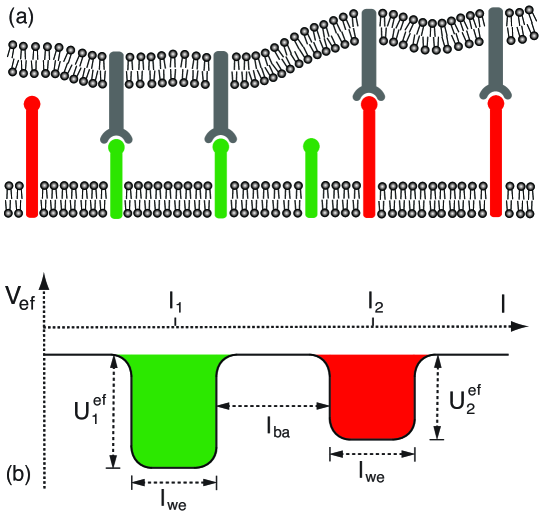
As in section 3.2, the summations over all possible distributions and of receptors and ligands in the partition function of the model leads to an effective adhesion potential [19, 20]. The effective adhesion potential now is a double-well potential (see fig. 4). Both wells have the same width as the potentials (12) and (13). The well with its center at the membrane separation reflects the interactions of the receptors with the shorter ligands , and the well centered at reflects the interactions of the receptors and the longer ligands . In analogy to eq. (6), the depth of the two wells
| (14) |
and
| (15) |
depend on the concentrations , and of unbound receptors and ligands, and on the binding constants and for receptors and ligands within the appropriate binding ranges [19, 20]. The binding equilibrium of the receptors and ligands and in the contact zone thus can be determined from considering two apposing membranes with elastic energy (1) that interact via an effective double-well potential with well depths and given by eqs. (14) and (15).
4.3 Phase diagram
If the two wells of the effective adhesion potential are relatively shallow, thermal membrane fluctuations can easily drive membrane segments to cross from one well to the other. If the two wells are deep, the crossing of membrane segments from one well to the other well is hindered by the potential barrier of width between the wells (see fig. 4). The potential barrier induces a line tension between adjacent membrane segments that are bound in different wells [63]. Beyond a critical depth of the potential wells, the line tension leads to the formation of large membrane domains that are bound in well one or well two. Within each domain, the adhesion of the membranes is predominantly mediated either by the receptor-ligand complexes or by the complexes .
We have previously found that the critical potential depth for domain formation is
| (16) |
with the prefactor determined by Monte Carlo simulations [20]. Domain formation in the contact zone or, in other words, segregation of the complexes and can only occur if the effective potential depths and exceed the critical potential depth . The critical potential depth depends on the temperature and the bending rigidity as well as on the width and separation of the two potential wells. In deriving eq. (16), we have neglected direct membrane-membrane contacts, which is reasonable for typical concentrations and lengths of receptor-ligand complexes in cell adhesion zones [20, 21]. For these complex concentrations and lengths, the thermal membrane roughness is smaller than the lengths of the receptor-ligand complexes.
Domain coexistence occurs for equal depths
| (17) |
of the potential wells if the two wells have the same width as in Fig. 4. With eqs. (14) and (15), this coexistence condition implies that domain coexistence occurs along the line with
| (18) |
in the --plane. The line has the slope and ends at a critical point (see phase diagram in fig. 5(a)). For , we have . The adhesion is then dominated by the short complexes throughout the cell contact zone. For , in contrast, the adhesion is dominated by the long complexes in the whole contact zone. If the supported membrane is much larger than the cell contact zone, it seems reasonable to assume that the concentrations and of unbound ligands do not change upon adhesion since the ‘ligand reservoir’ in the supported membrane is large. The concentrations and in our model then correspond to the experimental ligand concentrations in the supported membrane prior to adhesion, and our phase diagram in fig. 5(a) to the phase diagram in fig. 7 of Ref. [5], see Discussion.
5 Two types of membrane-anchored ligands adhering to different cell receptors
5.1 Interaction energy of receptors and ligands and effective adhesion potential
Several experimental groups have investigated the adhesion of T cells to supported membranes with anchored MHCp and ICAM1 ligands [8, 15, 9, 64, 65, 66, 67, 11, 68]. The ligand MHCp binds to the T cell receptor (TCR), and the ligand ICAM1 to the integrin LFA1 in the T cell membrane. The TCR-MHCp complex has a length of around 13 nm [2], and the LFA1-ICAM1 complex a length of 40 nm [6]. A situation in which two ligands in the supported membrane bind to different receptors in a cell membrane can be described in our model via the interaction energy [20]
Here, the occupation number , 2, or 0 indicates whether a receptor , a receptor , or no receptor is present in patch of the cell membrane in the contact zone, while , 2, or 0 indicates whether a ligand , a ligand , or no ligand is present in the apposing patch of the supported membrane. The interaction of a receptor with an apposing ligand is described by the potential , and the interaction of with by the potential . As in section 4.2, a summation over all possible distributions and of receptors and ligands in the partition function leads to an effective double-well potential of the membranes. The effective potential has the same form as in fig. 4(b), but the depths of the two wells
| (19) |
and
| (20) |
now depend on the concentrations and of unbound receptors in the cell membrane, on the concentrations and of unbound ligands in the supported membrane, and on the binding constants and for the complexes and [19].
5.2 Phase diagram
As in section 4.3, domain coexistence in the cell contact zone requires equal depths of the potential wells if the two wells have the same width . The effective adhesion potential then is a symmetric double-well potential. We assume here again that the total area of the supported membrane is large compared to the cell contact zone. In this case, the numbers of bound ligands in the contact zone is negligible compared to the numbers of unbound ligands in the total supported membrane, which implies that the concentrations and of unbound ligands do not change during adhesion. However, the concentrations and of unbound receptors in general change during cell adhesion because the contact area is typically a substantial fraction of the overall area of the cell membrane, and because the total numbers and of the receptors in the cell membrane are constant. During adhesion, a smaller or larger fraction of the receptors will form bound complexes or (see also section 3.4). The concentrations and of the receptor-ligand complexes in the cell contact area depend on the fractions and of the membranes within well 1 and well 2 of the effective adhesion potential. The receptor-ligand complexes can only form in the membrane fraction of the contact area within binding range of and , and the complexes only in the membrane fraction within binding range of and .
For the symmetric double-well potential with , the membrane fractions and within well 1 and well 2 depend primarily on the rescaled potential depth
| (21) |
as in section 3.3. The Monte Carlo data in fig. 6(a) illustrate how and depend on . Below the critical potential depth , the membrane fluctuates between the two wells. Because of the symmetry of the potential, and attain the same value for . Above the critical potential depth , we have a spontaneous symmetry breaking of the membranes into domains that are predominantly bound in well 1 or well 2, or in other words, predominantly bound by the complexes or the complexes . The symmetry breaking for is reflected by two branches and of the membrane fraction within the wells (see fig. 6(a)). For the domain predominantly bound in well 1, we have and . For the domain predominantly bound in well 2, we have and . For , we have (see fig. 6(a)), which implies that domain 1 then contains only the complexes , and domain 2 only the complexes .

Since the total numbers and of receptors 1 and 2 in the cell membrane are constant, we have
| (22) | |||||
| (23) |
Here, is the total area of the cell, the contact area, and is the fraction of the contact area occupied by domain 1, which is predominantly bound in well 1. The first terms on the right-hand sides, and , are the total numbers of unbound receptors. The concentrations and of unbound receptors within and outside of the contact zone are equal since we neglect the area occupied by bound receptor-ligand complexes within the contact zone (see also eq. (11)). The second terms on the right-hand sides of eqs. (22) and (23) are the numbers of bound receptors. In analogy to eq. (7), the number of bound receptors in the domain predominantly bound in well 1 is , and the number of bound receptors in this domain is . The number of bound receptors in the domain that is predominantly bound in well 2 is , and the number of bound receptors in this domain is . Below the critical potential depth , we have . The two equations (22) and (23) therefore are independent from each other for , but dependent on each other for .
With the four independent, dimensionless parameters
| (24) |
and
| (25) |
the eqs. (22) and (23) can be rewritten as
| (26) | |||||
| (27) |
since we have (see eqs. (19) to (21)). From these two equations, one can determine and as functions of the independent parameters , , and . Domain coexistence in the cell contact zone occurs for and .
To obtain general relations for the critical point and the boundary lines of the two-phase region in the - plane, we first solve eq. (26) for and eq. (27) for , which leads to
| (28) | |||||
| (29) |
At the critical point, we have . By inserting these relations into eqs. (28) and (29), we obtain a general expression for the location of the critical point in the - plane:
| (30) |
For the Monte Carlo data of fig. 6(a) with and , for example, we have . Since and have to be positive, domain coexistence can only occur if and are both larger than . The domain-coexistence region in the - plane is bounded by two lines with and . Inserting in the eqs. (28) and (29) leads to the parametric form
| (31) |
for the line. Similarly, inserting in the eqs. (28) and (29) leads to the parametric form
| (32) |
for the line. The domain-coexistence region in the phase diagram of fig. 6(b), for example, follows from inserting the functions and obtained from interpolation of the Monte Carlo data shown in fig. 6(a) into eqs. (31) and (32).
For , we have . The line then is given by
| (33) |
since we have for . Similarly, the line is given by
| (34) |
because of . For , the membranes are only bound via one of the wells. The membrane fraction bound in this well therefore can be approximated by the same expression with as in the case of an effective single-well adhesion potential (see eq. (9)).
The line has a vertical asymptote in the - plane, since in eq. (33) diverges for
| (35) |
because the denominator of the right-hand side of eq. (29) vanishes. With , we obtain the location
| (36) |
for this vertical asymptote from eq. (35). Similarly, the line has a horizontal asymptote in the - plane since the the denominator of the right-hand side of eq. (34) vanishes for
| (37) |
With , we obtain the value
| (38) |
for the horizontal asymptote of the line from eq. (37).
6 Discussion and Conclusions
In this article, we have determined phase diagrams for cells adhering to supported membranes with anchored ligands. For supported membranes with short and long ligands and that bind to the same cell receptor , coexistence of domains of and complexes in the cell adhesion zone only occurs for equal effective binding strength of the complexes where and are the binding equilibrium constants at appropriate membrane separations. The domain coexistence thus occurs along a line in the - plane, which ends at the critical point (see fig. 5(a)). We have assumed that the area of the supported membrane is much larger than the adhesion zone, which implies that the concentrations and of unbound ligands do not change significantly during adhesion since the supported membrane constitutes a large ‘ligand reservoir’. Constant concentrations of unbound ligands imply constant chemical potentials and of the ligands in our model (see eq. (32) in ref. [21]). A coexistence line as in the diagram of fig. 5(a)) is typical for phase diagrams in grand-canonical ensembles with constant chemical potentials.
For supported membranes with two types of ligands and that bind to different cell receptors and , we obtain a qualitatively different phase diagram with a broad coexistence region (see fig. 5(b)). Domain coexistence in the cell adhesion zone occurs for . The broad coexistence region is a consequence of the fact that the concentrations of unbound receptors and depend on the numbers of bound receptors and, therefore, on the fractions of the cell adhesion zone occupied by the domains of and complexes, since the total numbers and of receptors in the cell membrane are constant. A broad coexistence region as in the diagram of fig. 5(b)) is typical for phase diagrams in canonical ensembles with constant particle numbers.
Milstein and coworkers [5] have observed domain coexistence for a narrow concentration ratio of short and long ligands that bind to the same cell receptor CD2, in agreement with our phase diagram in fig. 5(a). However, two differences between our phase diagram in fig. 5(a) and the phase diagram of Milstein and coworkers in fig. 7 of ref. [5] are: First, the coexistence line in the phase diagram of Milstein and coworkers seems to have a finite width. Such a finite width may result from slight changes of the ligand concentrations upon binding, since several cells adhere to the same supported membrane in the experiments. Second, the coexistence line in the diagram of Milstein and coworkers ends in a region in which the cells do not adhere, while the coexistence line in the diagram of fig. 5(a) ends at a critical point. In this article, we have neglected repulsive interactions from, e.g., the cell glycocalyx. In our model, such repulsive interactions lead to an unbinding of the membranes at certain well depths and of the effective adhesion potential shown in fig. 4 [20]. We obtain a phase diagram similar to the diagram of Milstein and coworkers if the well depths and at which the membranes unbind are larger than the critical potential depth , which determines the location of the critical point in the diagram of fig. 5(a).
We find that thermal membrane shape fluctuations on nanometer scales play a central role during cell adhesion. Fluctuations on these scales have been recently reported for immune cells adhering to coated substrates [69, 70]. In previous work, we have found that the fluctuations lead to a cooperative binding of receptors and ligands (see fig. 3) [21], and to a critical point for the segregration of long and short receptor-ligand complexes [20, 19]. Our phase diagrams in fig. 5 are therefore qualitatively different from phase diagrams calculated under neglection of shape fluctuations [43]. The binding cooperativity of receptors and ligands arises since a receptor-ligand complex locally constrains the membrane shape fluctuations and facilitates the binding of nearby complexes. The binding cooperativity is thus closely related to the fluctuation-induced attractive interactions between bound receptor-ligand complexes [18, 71, 29, 17, 72], which result from a suppression of membrane-shape fluctuations, similar to the fluctuation-induced interactions of rigid membrane inclusions [73, 74, 75, 76].
We have neglected here the line tension of the domain boundaries, which may suppress the formation of small domains in the cell adhesion zone. In classical nucleation theory, the line tension leads to a threshold size for stable domains. Experimental observations of stable microdomains in the adhesion zones of immune cells [13, 9, 65, 67] indicate that this threshold size is rather small. We will consider the line tension between domains of short and long receptor-ligand complexes in detail in a future article.
Bibliography
References
- [1] T A Springer. Adhesion receptors of the immune system. Nature, 346:425–434, 1990.
- [2] K C Garcia, M Degano, R L Stanfield, A Brunmark, M R Jackson, P A Peterson, L Teyton, and I A Wilson. An T cell receptor structure at 2.5 and its orientation in the TCR-MHC complex. Science, 274:209–19, 1996.
- [3] P A van der Merwe, P N McNamee, E A Davies, A N Barclay, and S J Davis. Topology of the CD2-CD48 cell-adhesion molecule complex: implications for antigen recognition by T cells. Curr Biol, 5:74–84, 1995.
- [4] J H Wang, A Smolyar, K Tan, J H Liu, M Kim, Z Y Sun, G Wagner, and E L Reinherz. Structure of a heterophilic adhesion complex between the human CD2 and CD58 (LFA-3) counterreceptors. Cell, 97:791–803, 1999.
- [5] O Milstein, S-Y Tseng, T Starr, J Llodra, A Nans, M Liu, M K Wild, P A van der Merwe, D L Stokes, Y Reisner, and M L Dustin. Nanoscale increases in CD2-CD48-mediated intermembrane spacing decrease adhesion and reorganize the immunological synapse. J Biol Chem, 283:34414–34422, 2008.
- [6] M L Dustin and J A Cooper. The immunological synapse and the actin cytoskeleton: molecular hardware for T cell signaling. Nat. Immunol., 1:23–29, 2000.
- [7] C R Monks, B A Freiberg, H Kupfer, N Sciaky, and A Kupfer. Three-dimensional segregation of supramolecular activation clusters in T cells. Nature, 395:82–86, 1998.
- [8] A Grakoui, S K Bromley, C Sumen, M M Davis, A S Shaw, P M Allen, and M L Dustin. The immunological synapse: a molecular machine controlling T cell activation. Science, 285:221–227, 1999.
- [9] Kaspar D Mossman, Gabriele Campi, Jay T Groves, and Michael L Dustin. Altered TCR signaling from geometrically repatterned immunological synapses. Science, 310:1191–1193, 2005.
- [10] Y Kaizuka, A D Douglass, R Varma, M L Dustin, and R D Vale. Mechanisms for segregating T cell receptor and adhesion molecules during immunological synapse formation in Jurkat T cells. Proc Natl Acad Sci USA, 104:20296–20301, 2007.
- [11] A L DeMond, K D Mossman, T Starr, M L Dustin, and J T Groves. T cell receptor microcluster transport through molecular mazes reveals mechanism of translocation. Biophys. J., 94:3286–3292, 2008.
- [12] A D Douglass and R D Vale. Single-molecule microscopy reveals plasma membrane microdomains created by protein-protein networks that exclude or trap signaling molecules in T cells. Cell, 121:937–950, 2005.
- [13] G Campi, R Varma, and ML Dustin. Actin and agonist MHC-peptide complex-dependent T cell receptor microclusters as scaffolds for signaling. J. Exp. Med., 202:1031–1036, 2005.
- [14] K Choudhuri, D Wiseman, M H Brown, K Gould, and P A van der Merwe. T-cell receptor triggering is critically dependent on the dimensions of its peptide-MHC ligand. Nature, 436:578–582, 2005.
- [15] E Hailman, W R Burack, A S Shaw, M L Dustin, and P M Allen. Immature CD4+CD8+ thymocytes form a multifocal immunological synapse with sustained tyrosine phosphorylation. Immunity, 16:839–848, 2002.
- [16] R Lipowsky. Adhesion of membranes via anchored stickers. Phys. Rev. Lett., 77:1652–1655, 1996.
- [17] T R Weikl and R Lipowsky. Adhesion-induced phase behavior of multicomponent membranes. Phys. Rev. E., 64:011903, 2001.
- [18] T R Weikl and R Lipowsky. Membrane adhesion and domain formation. In Advances in Planar Lipid Bilayers and Liposomes. A. Leitmannova Liu, editor. Academic Press, 2006.
- [19] T R Weikl, M Asfaw, H Krobath, B Różycki, and R Lipowsky. Adhesion of membranes via receptor-ligand complexes: Domain formation, binding cooperativity, and active processes. Soft Matter, 5:3213–3224, 2009.
- [20] M Asfaw, B Różycki, R Lipowsky, and T R Weikl. Membrane adhesion via competing receptor/ligand bonds. Europhys. Lett., 76:703–709, 2006.
- [21] H Krobath, B Różycki, R Lipowsky, and T R Weikl. Binding cooperativity of membrane adhesion receptors. Soft Matter, 5:3354–3361, 2009.
- [22] R. Lipowsky. Generic interactions of flexible membranes. In Handbook of Biological Physics, Vol. 1. R. Lipowsky and E. Sackmann, editors. Elsevier/North Holland, 1995.
- [23] H Krobath, G J Schütz, R Lipowsky, and T R Weikl. Lateral diffusion of receptor-ligand bonds in membrane adhesion zones: Effect of thermal membrane roughness. Europhys. Lett., 78:38003, 2007.
- [24] N Gov, A G Zilman, and S Safran. Cytoskeleton confinement and tension of red blood cell membranes. Phys. Rev. Lett., 90:228101, 2003.
- [25] J-B Fournier and E Lacoste, Dand Raphael. Fluctuation spectrum of fluid membranes coupled to an elastic meshwork: jump of the effective surface tension at the mesh size. Phys Rev Lett, 92:018102, 2004.
- [26] L C-L Lin and F L H Brown. Dynamics of pinned membranes with application to protein diffusion on the surface of red blood cells. Biophys J, 86:764–780, 2004.
- [27] T Auth, S A Safran, and N S Gov. Fluctuations of coupled fluid and solid membranes with application to red blood cells. Phys. Rev. E, 76:051910, 2007.
- [28] B. Alberts, A. Johnson, J. Lewis, M. Raff, K. Roberts, and P. Walter. Molecular Biology of the Cell. Garland, New York, 4th edition, 2002.
- [29] T R Weikl, R R Netz, and R Lipowsky. Unbinding transitions and phase separation of multicomponent membranes. Phys. Rev. E., 62:R45–R48, 2000.
- [30] T R Weikl, D Andelman, S Komura, and R Lipowsky. Adhesion of membranes with competing specific and generic interactions. Eur. Phys. J. E, 8:59–66, 2002.
- [31] A-S Smith and U Seifert. Effective adhesion strength of specifically bound vesicles. Phys. Rev. E, 71:061902, 2005.
- [32] Bartosz Różycki, Reinhard Lipowsky, and Thomas R Weikl. Adhesion of membranes with active stickers. Phys. Rev. Lett., 96:048101, 2006.
- [33] P K Tsourkas, N Baumgarth, S I Simon, and S Raychaudhuri. Mechanisms of B-cell synapse formation predicted by Monte Carlo simulation. Biophys. J., 92:4196–4208, 2007.
- [34] P K Tsourkas, M L Longo, and S Raychaudhuri. Monte Carlo study of single molecule diffusion can elucidate the mechanism of B cell synapse formation. Biophys. J., 95:1118–1125, 2008.
- [35] E Reister-Gottfried, K Sengupta, B Lorz, E Sackmann, U Seifert, and A S Smith. Dynamics of specific vesicle-substrate adhesion: From local events to global dynamics. Phys. Rev. Lett., 101:208103, 2008.
- [36] M Asfaw and H-Y Chen. Adhesion-induced lateral phase separation of multicomponent membranes: the effect of repellers and confinement. Phys Rev E, 79:041917, 2009.
- [37] R Goetz, G Gompper, and R Lipowsky. Mobilitiy and elasticity of self-assembled membranes. Phys. Rev. Lett., 82:221–224, 1999.
- [38] G I Bell. Models for the specific adhesion of cells to cells. Science, 200:618–627, 1978.
- [39] G I Bell, M Dembo, and P Bongrand. Cell adhesion. Competition between nonspecific repulsion and specific bonding. Biophys. J., 45:1051–1064, 1984.
- [40] S Komura and D Andelman. Adhesion-induced lateral phase separation in membranes. Eur. Phys. J. E, 3:259–271, 2000.
- [41] R Bruinsma, A Behrisch, and E Sackmann. Adhesive switching of membranes: experiment and theory. Phys. Rev. E, 61:4253–4267, 2000.
- [42] H-Y Chen. Adhesion-induced phase separation of multiple species of membrane junctions. Phys. Rev. E, 67:031919, 2003.
- [43] D Coombs, M Dembo, C Wofsy, and B Goldstein. Equilibrium thermodynamics of cell-cell adhesion mediated by multiple ligand-receptor pairs. Biophys. J., 86:1408–1423, 2004.
- [44] V B Shenoy and L B Freund. Growth and shape stability of a biological membrane adhesion complex in the diffusion-mediated regime. Proc. Natl. Acad. Sci. USA, 102:3213–3218, 2005.
- [45] J-Y Wu and H-Y Chen. Membrane-adhesion-induced phase separation of two species of junctions. Phys. Rev. E, 73:011914, 2006.
- [46] C-Z Zhang and Z-G Wang. Nucleation of membrane adhesions. Phys Rev E, 77:021906, 2008.
- [47] G-K Xu, X-Q Feng, H-P Zhao, and B Li. Theoretical study of the competition between cell-cell and cell-matrix adhesions. Phys Rev E, 80:011921, 2009.
- [48] E Atilgan and B Ovryn. Nucleation and growth of integrin adhesions. Biophys J, 96:3555–3572, 2009.
- [49] M L Dustin, L M Ferguson, P Y Chan, T A Springer, and D E Golan. Visualization of CD2 interaction with LFA-3 and determination of the two-dimensional dissociation constant for adhesion receptors in a contact area. J. Cell. Biol., 132:465–474, 1996.
- [50] D-M Zhu, M L Dustin, C W Cairo, and D E Golan. Analysis of two-dimensional dissociation constant of laterally mobile cell adhesion molecules. Biophys. J., 92:1022–1034, 2007.
- [51] T P Tolentino, J Wu, V I Zarnitsyna, Y Fang, M L Dustin, and C Zhu. Measuring diffusion and binding kinetics by contact area FRAP. Biophys. J., 95:920–930, 2008.
- [52] A Albersdörfer, T Feder, and E Sackmann. Adhesion-induced domain formation by interplay of long-range repulsion and short-range attraction force: a model membrane study. Biophys. J., 73:245–257, 1997.
- [53] A Kloboucek, A Behrisch, J Faix, and E Sackmann. Adhesion-induced receptor segregation and adhesion plaque formation: A model membrane study. Biophys. J., 77:2311–2328, 1999.
- [54] C W Maier, A Behrisch, A Kloboucek, D A Simson, and R Merkel. Specific biomembrane adhesion - indirect lateral interactions between bound receptor molecules. Eur. Phys. J. E, 6:273–276, 2001.
- [55] A-S Smith, B G Lorz, U Seifert, and E Sackmann. Antagonist-induced deadhesion of specifically adhered vesicles. Biophys. J., 90:1064–1080, 2006.
- [56] B G Lorz, A-S Smith, C Gege, and E Sackmann. Adhesion of giant vesicles mediated by weak binding of Sialyl-Lewis(x) to E-selectin in the presence of repelling poly(ethylene glycol) molecules. Langmuir, 23:12293–12300, 2007.
- [57] O Purrucker, S Goennenwein, A Foertig, R Jordan, M Rusp, M Baermann, L Moroder, E Sackmann, and M Tanaka. Polymer-tethered membranes as quantitative models for the study of integrin-mediated cell adhesion. Soft Matter, 3:333–336, 2007.
- [58] A-S Smith, K Sengupta, S Goennenwein, U Seifert, and E Sackmann. Force-induced growth of adhesion domains is controlled by receptor mobility. Proc. Natl. Acad. Sci. USA, 105:6906–6911, 2008.
- [59] S F Fenz, R Merkel, and K Sengupta. Diffusion and intermembrane distance: case study of avidin and E-cadherin mediated adhesion. Langmuir, 25:1074–85, 2009.
- [60] C Monzel, S F Fenz, R Merkel, and K Sengupta. Probing biomembrane dynamics by dual-wavelength reflection interference contrast microscopy. Chemphyschem, 10:2828–2838, 2009.
- [61] P Streicher, P Nassoy, M Bärmann, A Dif, V Marchi-Artzner, F Brochard-Wyart, J Spatz, and P Bassereau. Integrin reconstituted in GUVs: a biomimetic system to study initial steps of cell spreading. Biochim Biophys Acta, 1788:2291–2300, 2009.
- [62] A-S Smith, S F Fenz, and K Sengupta. Inferring spatial organization of bonds within adhesion clusters by exploiting fluctuations of soft interfaces. Europhys. Lett., 89:28003, 2010.
- [63] R Lipowsky. Discontinuous unbinding transitions of flexible membranes. J Phys II France, 4:1755–1762, 1994.
- [64] M Krogsgaard, Q-J Li, C Sumen, J B Huppa, M Huse, and M M Davis. Agonist/endogenous peptide-MHC heterodimers drive T cell activation and sensitivity. Nature, 434:238–243, 2005.
- [65] T Yokosuka, K Sakata-Sogawa, W Kobayashi, M Hiroshima, A Hashimoto-Tane, M Tokunaga, ML Dustin, and T Saito. Newly generated T cell receptor microclusters initiate and sustain T cell activation by recruitment of Zap70 and SLP-76. Nat. Immunol., 6:1253–1262, 2005.
- [66] R Varma, G Campi, T Yokosuka, T Saito, and M L Dustin. T cell receptor-proximal signals are sustained in peripheral microclusters and terminated in the central supramolecular activation cluster. Immunity, 25:117–127, 2006.
- [67] T Yokosuka, W Kobayashi, K Sakata-Sogawa, M Takamatsu, A Hashimoto-Tane, M L Dustin, M Tokunaga, and T Saito. Spatiotemporal regulation of T cell costimulation by TCR-CD28 microclusters and protein kinase C theta translocation. Immunity, 29:589–601, 2008.
- [68] J B Huppa, M Axmann, M A Mörtelmaier, B F Lillemeier, E W Newell, M Brameshuber, L O Klein, G J Schütz, and M M Davis. TCR-peptide-MHC interactions in situ show accelerated kinetics and increased affinity. Nature, 463:963–967, 2010.
- [69] A Pierres, A-M Benoliel, D Touchard, and P Bongrand. How cells tiptoe on adhesive surfaces before sticking. Biophys J., 94:4114–4122, 2008.
- [70] A Pierres, V Monnet-Corti, A-M Benoliel, and P Bongrand. Do membrane undulations help cells probe the world? Trends Cell Biol., 19:428–33, 2009.
- [71] R Bruinsma, M Goulian, and P Pincus. Self-assembly of membrane junctions. Biophys J., 67:746–750, 1994.
- [72] O Farago. Fluctuation induced attraction between adhesion sites of supported membranes. arXiv:1003.1459v1, 2010.
- [73] M Goulian, R Bruinsma, and P Pincus. Long-range forces in heterogeneous fluid membranes. Europhys. Lett., 22:145–150, 1993.
- [74] R R Netz and P Pincus. Inhomogeneous fluid membranes: Segregation, ordering, and effective rigidity. Phys. Rev. E, 52:4114–4128, 1995.
- [75] R Golestanian, M Goulian, and M Kardar. Fluctuation-induced interactions between rods on a membrane. Phys. Rev. E, 54:6725–6734, 1996.
- [76] T R Weikl. Fluctuation-induced aggregation of rigid membrane inclusions. Europhys. Lett., 54:547–553, 2001.