author to whom correspondence should be addressed: E-mail jeremy.carlo@nrc-cnrc.gc.ca]
Magnetic phase transition in V2O3 nanocrystals
Abstract
V2O3 nanocrystals can be synthesized through hydrothermal
reduction of VO(OH)2 using hydrazine as a reducing agent.
Addition of different ligands to the reaction produces nanoparticles,
nanorods and nanoplatelets of different sizes. Small nanoparticles
synthesized in this manner show suppression of the magnetic
phase transition to lower temperatures. Using muon spin relaxation
spectroscopy and synchrotron x-ray diffraction, we have determined
that the volume fraction of the high-temperature phase,
characterized by a rhombohedral structure and paramagnetism,
gradually declines with decreasing temperature, in contrast to
the sharp transition observed in bulk V2O3.
pacs:
I Introduction
The unique characteristics of the transition metal oxides make them an extraordinarily diverse class of materials, with properties covering almost all aspects of materials science and solid state physics. The chemical and physical properties of the Group V oxides vanadium, niobium, and tantalum show promise for applications in catalysis, electrochemistry and electrochromical device technology. V2O3 has been the subject of many investigations due to a remarkable first-order metal-insulator transition at about 150-160K,Frenkel et al. (1997); McWhan et al. (1973) from the low-temperature monoclinicDernier and Marezio (1970) into the rhombohedral phase, with an accompanying seven order-of-magnitude increase in conductivity and a shift from antiferromagneticGoodenough (1968) to paramagneticCarr and Foner (1960); Arnold and Mires (1968); Carter et al. (1991); Greenwood et al. (1971) behavior. The low-temperature phase also exhibits an increase in volume of about 1.6%. The addition of a few percent of CrSmerdou et al. (1996), AlJoshi and Honig (1982), ReSuzuki et al. (1999) or MoTenailleau et al. (2002) shifts the conductivity increase to higher temperatures between 170 and 470K depending on doping fraction. These properties make it possible to build temperature sensors and current regulatorsAndrich (1966); Perkins et al. (1983) using these materials. Furthermore, V2O3 powders have been used in conductive polymer compositesPan et al. (1994) and in catalysis.Vader (1986) The potential uses of V2O3 in the nanocrystalline form will require high chemical and structural purity and well-defined morphology, and careful characterization of the nanoparticle properties.
There have been a few successful syntheses reported of V2O3 nanocrystals.Toshiyuki et al. (1997); Zheng et al. (2003); Su and Schloegl (2002); Pinna et al. (2004); Zhang et al. (2005) Zheng et al. obtained spherical V2O3 nanoparticles through reductive pyrolysis of ammonium oxo-vanadium(IV) carbonate hydroxide, (NH4)2[(VO)6(CO3)4(OH)9]10H2O, in a hydrogen flow at 650∘C.Zheng et al. (2003) Su et al. made V2O3 nanoparticles by reducing V2O5 crystals in high vacuum (10-7 Torr) at 600∘C.Su and Schloegl (2002) Pinna et al. discovered a non-aqueous route to V2O3 nanocrystals through solvothermal reaction of vanadium(V) tri-isopropoxide with benzyl alcohol.Pinna et al. (2004) Benzyl alcohol plays the roles of both reducing agent and surfactant and the reaction is performed at 200∘C under nitrogen. Zhang et al. synthesized V2O3 nanopowders using thermal decomposition of vanadium(IV) oxalate or mixture of vanadyl hydroxide and ammonium chloride in argon atmosphere at 500∘C.Zhang et al. (2005) Although there have been no successful syntheses of V2O3 nanorods, there have been a few reported syntheses of VO2 nanorods, which we have used as a starting point.Gui et al. (2002)
We report a novel approach employing hydrothermal reaction in water solution in air to produce V2O3 nanorods. We use different ligands to change nanocrystal shape in order to obtain particles, rods and platelets of V2O3. One particular improvement over the previously reported syntheses is that the reaction is not air-sensitive. We investigated the magnetic properties of small V2O3 nanoparticles and found them to behave differently from the bulk material.
II Synthesis
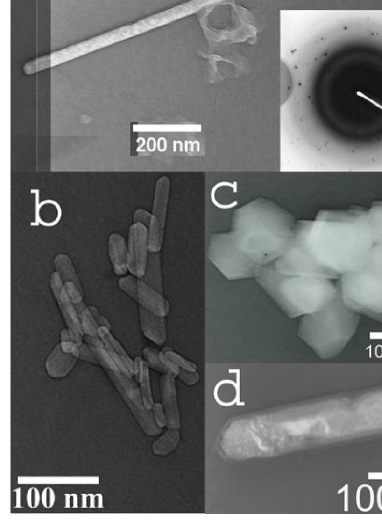
The synthesis follows a simple route: the vanadyl hydroxide precursor is heated with hydrazine in an autoclave at 230∘C, in water. The reaction takes 2-14 days, depending on the ionic strength of the solution and the ligand used. We were able to obtain different shapes and sizes of V2O3 nanocrystals through change of the ligand as shown in TEM images (Fig. 1). Nanorods 40-60 nm in diameter and up to 1 m in length were produced using succinic acid (Fig. 1a). Electron diffraction measurements of a single nanorod reveal no variation along the length of the rod. Judging from the TEM images, nanorods account for about 10% of the sample, the rest being nanoparticles. Nanorods produced using ethylene diamine as ligand have diameter of 40-60 nm and length of 300-500 nm (Fig. 1b). Those produced using 2-propanol (Fig. 1d) as a ligand were 70-90 nm in diameter and around 700 nm long. These ligands are more selective than succinic acid, with nanorods comprising the majority of the sample: the approximate yield of nanorods is around 70% for the reaction using 2-propanol and about 85% for reaction using ethylene diamine as the ligand. Nanoplatelets of 80-200 nm diameter were obtained using ammonium citrate as ligand (Fig. 1c). Finally, nanoparticles (Fig. 2) were produced using 2-propanol as ligand, in a reaction where the precursor is washed to reduce the ionic strength of the solution. The particle size distribution is broad from less than 10 nm to around 50 nm in diameter.
Thermogravimetric analysis shows a gradual mass loss of about 2% when sample is heated to 860∘C, indicating that the phase is stable and there is no water of crystallization. Elemental analysis of the sample reveals small percentages of carbon and hydrogen and trace amounts of nitrogen and chlorine in the sample. The molar ratios of elements in the sample were consistent with stoichiometric V2O3, while the remaining carbon and hydrogen can almost completely be attributed to leftover ligand – succinic acid (C4H6O4 0.009 molecules per one vanadium), with the remaining hydrogen probably in the form of ammonium. The exact origin of the excess oxygen (0.13 atoms for each vanadium atom) cannot be determined with any degree of certainty.

III Results
III.1 Magnetic characterization
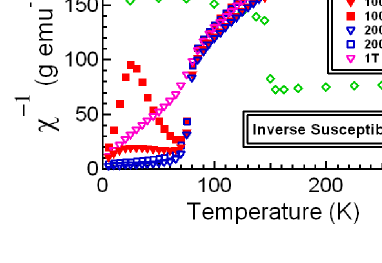
The temperature dependence of the magnetic susceptibility of V2O3 nanoparticles, measured using a SQUID magnetometer with applied fields of 100G, 200G and 1T (Fig. 3), show that there is no large jump in susceptibility near 150K, but a more gradual rise in susceptibility at lower temperatures. This is very different from the behavior of the bulk V2O3 crystal, which exhibits a sharp rise in magnetic susceptibility around 150K as the sample shifts from low-temperature antiferromagnetic ordering to the high-temperature paramagnetic state. In external fields of 100 G and 200 G, we see the apparent signature of a sudden change at T = 80K. This, however, can be explained as spin freezing of a small impurity phase or the onset of a slight ferrimagnetic polarization of primarily antiferromagnetic spins, as even the largest values of susceptibility seen at low temperatures correspond to a moment of approximately only 210-4 per V site. In addition, while the high-temperature state in bulk V2O3 is characterized by a relatively constant Pauli-like susceptibility, the nanopowder sample exhibits distinctly Curie-Weiss-like behaviour at high temperatures. In order to further investigate this behavior, we used muon spin relaxation spectroscopy.
Muon spin relaxation (SR)Schenck (1985); Lee et al. (1998) is an experimental technique based on the implantation of spin-polarized muons in matter and the influence of the atomic, molecular or crystalline surroundings on the evolution of their spins. It is a point-like magnetic probe in real space, similar to NMR and ESR, and complementary to the frequency space probed by scattering measurements. One key difference between SR and other related probes such as NMR and ESR is the time window in detecting dynamic phenomena: SR is sensitive to time scales over the range of 10-11 to 10-5 s. As an added advantage, SR can be performed in the absence of an external magnetic field.
In a magnetic field, the muon spin precesses at a frequency of about 13.5 kHz G-1; the magnetic moment of the muon is about three times that of the proton, making it a very sensitive magnetic probe. The positive muons used in the measurement, produced by the parity-violating weak decay of pions at rest, exhibit almost 100% initial spin polarization, and decay into a positron and two neutrinos with a mean lifetime of 2.2s. The positron is emitted preferentially along the direction of the instantaneous muon spin moment at the time of decay, with a typical overall 20-30% asymmetry between the directions parallel and antiparallel to the muon spin at time of decay. The time-dependent asymmetry of detected decay positrons correlates directly to the time evolution of the spins of the implanted muons, and thus to the internal local field distribution in the sample.
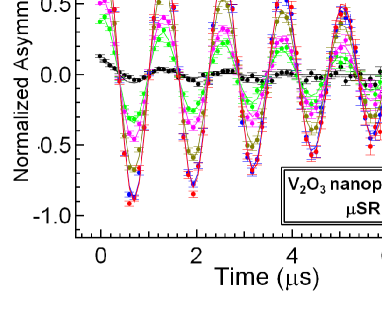
Temperature-dependent SR measurementsUemura et al. (2007); Savici et al. (2002) were performed at the M15 beamline at TRIUMF in a transverse field of 50 G in the temperature range of 3-180K (Fig. 4) using the HiTime spectrometer. The long-lived oscillating component represents muons in paramagnetic environments, while precessing muon spins in the antiferromagnetic environment quickly dephase due to local fields, resulting in rapid relaxation of the initial muon spin asymmetry. The data indicates that the onset of magnetic ordering occurs at different temperatures in different parts of the sample (presumably corresponding to different particle sizes). This is in stark comparison to the rapid and hysteretic transition previously observed in SR measurements of bulk V2O3. Uemura et al. (1984)
III.2 Structural Characterization
Bulk V2O3 exhibits concurrent magnetic, structural and metal-insulator phase transitions. To attempt to correlate the observed magnetic properties of V2O3 nanopowder with any structural changes, we performed synchrotron x-ray diffraction measurements on our sample, as well as on commercially prepared bulk powder. These measurements were conducted at beamline X16C at the National Synchrotron Light Source (NSLS) at Brookhaven National Laboratory (BNL), with the samples packed in quartz capillaries and measured using x-rays of wavelength 0.698955 . Complete datasets from 10∘ to 40∘ were collected for the bulk sample as a function of temperature, and complete data sets at 20K and 300K, as well as shorter scans at intermediate temperatures, were taken for the nanopowder sample.
The bulk data were analysed using the FullProf Rietveld refinement program,Rodriguez-Carvajal (1993) and the data were fit to a rhombohedral high-temperature phase and a monoclinic low-temperature phase consistent with earlier published results. We confirm that, as in earlier published results, Frenkel et al. (1997); McWhan et al. (1973) the transition occurs quite rapidly, and is associated with coexistence of the high- and low-temperature phases over a narrow range of temperatures, with the transition temperature exhibiting significant hysteresis, as expected for a strongly first-order phase transition.
In the nanopowder sample, broadening of Bragg peaks and a high background made Rietveld refinement impossible and necessitated much longer integration times for data collection. Measurements of the empty quartz capillary showed that this large background phase is in fact intrinsic to the sample, although it is temperature-independent, and its origin remains unknown.
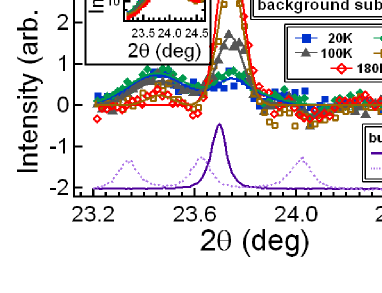
As a result of these limitations, we chose to focus on the region around 24∘ corresponding to the bulk [116] peak. In the bulk sample, this peak exhibits a three-fold splitting as the sample transitions from the rhombohedral to the monoclinic phase. Although the [116] peak in the nanopowder sample overlaps with a broad background peak, this background is temperature-independent and may be subtracted from the data after being fitted to a temperature-independent Gaussian. The sample signal was fit to a sum of a single Gaussian representing the high-temperature phase, and a sum of three Gaussians representing the low-temperature phase. Our results are shown in Fig. 5, revealing the gradual dropoff of the high-temperature peak intensity with decreasing temperature, and a corresponding rise in the more diffuse scattering representing the low temperature phase. While limitations of the data do not allow us to quantitatively analyze the structure of the low-temperature phase, we can determine that coexistence of the high- and low-temperature phases does occur over a wide temperature range similar to that where the high- and low-temperature magnetic phases were seen to coexist in the SR measurements.
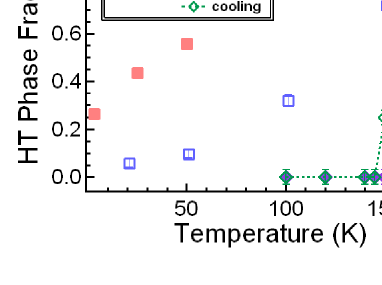
This motivated us to compare the relative phase fractions of high and low-temperature phases obtained by the two techniques. In Fig. 6 we show in red the temperature dependence of the oscillating asymmetry component of muon spin relaxation, giving a relative measure of volume fraction of the paramagnetic region, and in blue the temperature dependence of the integrated intensity coming from the high-temperature structural phase observed by x-ray diffraction. For comparison, the high-temperature rhombohedral phase fraction observed by x-ray diffraction in the bulk material are shown for both warming and cooling cycles. Both methods reveal that the volume fraction of the rhombohedral/paramagnetic phase increases gradually with increasing temperature and levels off after T 150K, suggesting that these signals come from the same regions of the material.
IV Discussion
IV.1 Synthesis
The vanadyl hydroxide precursor obtained through different processes yields different results. When it is obtained by reducing V2O5 with hydrazine, the reaction yields V2O3. When the precursor is prepared by precipitation from VOSO4 solution without a reducing agent, the reduction to vanadium(III) does not occur. However, when the same reaction is performed with the addition of hydrazine to the precursor before placing it in the autoclave, the result is V2O3. This suggests that excess hydrazine is acting as a reducing agent in the final step of the reaction, reducing vanadium(IV) to vanadium(III). In fact, there is evidence in the literatureSu and Schloegl (2002) suggesting that if the molar ratio of hydrazine to vanadium is 1:1, allowing only for reduction from vanadium(V) to vanadium(IV), that the product of hydrothermal reaction is VO2H2O. Reactions performed at temperatures below 200∘C failed to produce V2O3, suggesting that there is a minimum temperature required for vanadium reduction under hydrothermal conditions. 2-propanol accelerates the reaction as compared to equivalent ligand-free reaction: the reaction with 2-propanol as a ligand takes 1 day to produce V2O3 at 230∘C, while a ligand-free reaction under the same conditions takes 3 days. There are two possible explanations, which are not mutually exclusive: 2-propanol might be acting as a weak reducing agent, thus accelerating vanadium reduction, or the acceleration might simply come from the fact that the 2-propanol reaction produces much smaller particles than any other we have performed. Small particles might be reduced more quickly simply because they would expose a larger surface area to hydrazine in the solution. It is also interesting to note that the ionic strength of the solution appears to have an effect on both the reaction time and the morphology of the product. We can look at two reactions using 2-propanol as a ligand and differ only in the fact that, in the second one, the precursor was washed with water to reduce ionic strength. The first reaction takes 8 times longer to complete and produces a mix of nanorods and nanoparticles (70-90 nm in diameter). The second reaction produces only small nanoparticles (7-50 nm in diameter). We also observed that using ethylene diamine as a ligand requires significantly longer reaction time (14 days) than other reactions at the same conditions (7 days). This suggests that ethylene diamine slows down the reaction, possibly by stabilizing vanadium(IV).
IV.2 Characterization
Magnetic measurements on V2O3 nanoparticles synthesized using 2-propanol as ligand show that the magnetic transition (from anti-ferromagnetic to paramagnetic) appears to be occurring gradually as the temperature increases, rather than abruptly as it does in the bulk crystals. SQUID measurements (Fig. 3) show a gradual inflection in susceptibility below 150K, and no bulk-like sharp transition at 150-160K. Analysis of the muon spin relaxation and x-ray diffraction measurements (Fig. 6) show that the volume of the paramagnetic/rhombohedral region increases steadily with increasing temperature,suggesting a particle size dependence on transition temperature. By the time the temperature reaches 150K the curve of the asymmetry amplitude dependence is almost leveled off. The asymmetry value at 180K is about 0.16, indicating that all of the nanoparticles are in the paramagnetic state. The x-ray diffraction results largely follow this trend, indicating a gradual decrease of the high-temperature phase fraction with decreasing temperature. Characterization of the crystalline phases is impossible, however, due to the limitations of the data, primarily from a large but temperature-independent signal arising from the sample itself. We are thus limited to a semi-quantitative estimate of the phase fractions, which display the same trend as the magnetic data.
Magnetic ordering of the monoclinic phase of bulk V2O3 has been revealed by polarized neutron scattering experiments to be ferromagnetic in planes perpendicular to the [010] direction, while adjacent planes are antiferromagnetically coupledMoon (1970); Heidemann (1970). This results in zero overall magnetic moment, event though individual layers have a relatively high moment of 1.2 per vanadium atom. ExperimentsCarter et al. (1994) have shown that the magnetic transition can be shifted to a temperature below 150K by application of pressure. At a pressure of about 15 kbar the magnetic transition decouples from the metal-insulator transition, and by about 26 kbar, both phase transitions are completely suppressed.
IV.3 Possible Size Dependence of Transition Temperature
It is apparent from the XRD data that the high-temperature [116] peak in the nanopowder sample is shifted to an angle about 0.2% larger than is seen in the bulk material, indicating that the lattice parameters in the nanopowder sample are correspondingly smaller than in the bulk. Furthermore, the [116] peak in the bulk material exhibits significant broadening relative to its counterpart in the bulk. Bragg peak widths can be ascribed to several causes, including instrumental resolution, finite particle size, variation of lattice parameters throughout different parts of the specimen, and microstrain effects. The width of the broadened nanopowder peak, well approximated by a Gaussian, may be parametrized as , where is the intrinsic width approximated by the width of the peak in the bulk material, and defined as the “excess width” due to the remaining factors.
In our current data set, the FWHM (full width at half maximum) in 2 of the bulk peak is 0.152∘, while that of the nanopowder sample is 0.222∘; this leaves an excess FWHM due to broadening of 0.162∘. If we ascribe the entirety of this broadening to the finite size of the nanoparticles, we find by application of the Debye-Scherrer formulaPatterson (1939) cos (where represents the particle size, the wavelength, the Bragg angle and the peak FWHM in radians) that the observed width corresponds to an average particle size of 23 nm, in the lower mid-range of the 1050 nm (based on TEM images) particle size distribution, assuming a typical Debye-Scherrer constant value . Unfortunately, it is impossible to distinguish between the varying sources of broadening in the current data set, nor is it possible to determine whether finite size effects alone are sufficient to explain the observed broadening.
One intriguing interpretation of the range of transition temperatures observed is that it arises from the relatively wide particle size distribution in the sample. In particular, since progressively smaller nanoparticles have an increasingly large ratio of surface area to volume, it is expected that surface tension would hold smaller particles in greater compression, resulting in smaller lattice parameters. If the lattice parameters are a critical determinant of the transition temperature, the transition temperature and its range over the sample may be determined from measurement of the lattice parameters.
Finger and HazenFinger and Hazen (1980) have determined the variation of the lattice parameters of bulk V2O3 under applied pressure up to 50 kbar, from which we may compute the [116] peak d-spacing as a function of pressure. McWhan et al.McWhan et al. (1973) have characterized the depression of the transition temperature as a function of applied pressure, finding that the transition temperature drops linearly at a rate of approximately 5 K/kbar up to about 16 kbar, then more rapidly decreases toward zero at a sample-dependent critical pressure of 2026 kbar. Combining these results, one may estimate approximately the transition temperature as a function of [116] d-spacing. Using this relation, we find that the centroid of the nanopowder [116 ] peak corresponds to an effective pressure of 14 kbar and an estimated transition temperature of 85 K. If there is a spread of lattice parameter values throughout the sample, it would also follow that this transition should be smeared out, with portions of the sample exhibiting smaller lattice parameters (corresponding to a higher effective pressure) undergoing the transition at lower temperatures, and portions of the sample exhibiting larger lattice parameters (corresponding to effective pressures closer to zero) undergoing the transition at higher temperatures. This is roughly consistent with our SR and XRD observations indicating coexistence of the high- and low-temperature phases from base temperature up to over 150K, although uncertainties about the precise distribution of particle shapes and sizes and unknown strain effects prevent a more quantitative comparison.
Finally, since magnetic ordering in the low-temperature phase is long-range, and because of the dimensions of the nanoparticles, the magnetic transition caused by the anti-parallel alignment of magnetic moments in adjacent planes might not necessarily occur concurrently with the structural transition. Further investigation is required to confirm these findings.
V Conclusions
We present a novel approach for synthesis of V2O3 nanocrystals via hydrothermal reduction. Unlike any other reported syntheses, this reaction is done in water and under ambient atmosphere. We have obtained nanocrystals of varied shapes and sizes through choice of ligand.
The magnetic properties of V2O3 nanoparticles have been measured with respect to temperature using susceptibility and muon spin relaxation, and it is found that unlike the behavior in the bulk material, there is a gradual onset of magnetic order with decreasing temperature.
Additionally, the structural properties of V2O3 nanoparticles have been studied using synchrotron x-ray diffraction. While a full structural refinement of the data was impossible due to the large background signal, clearly a high-temperature phase and a low-temperature phase trade off with one another as a function of temperature. Both the magnetic and the structural results indicate coexistence of high- and low-temperature phases over a broad temperature range, with qualitative agreement between the phase fractions determined by magnetic and by structural measurements. The high-temperature phase is consistent with the observed bulk rhombohedral phase, although the low-temperature phase structure cannot be deduced with the available data.
These results suggest a correspondence between lattice parameters and transition temperature, with an intriguing explanation being that a particle size dependence to the transition temperature exists due to compression by surface tension. However, the relatively wide size distribution of the nanoparticle sample precludes any definitive conclusions, which await further investigation.
VI Acknowledgments
We gratefully acknowledge T. J. Williams, G. J. MacDougall, J. A. Rodriguez, J. Janik and C. R. Wiebe for help in SR data acquisition, Emil Bozin and Peng Tian for help with the diffraction data analysis, I. P. Swainson and A. J. Millis for useful discussions, and the TRIUMF CMMS staff for invaluable technical assistance with SR experiments. Work at Columbia University was supported by the U.S. National Science Foundation via grants DMR-0502706, DMR-0703940 and DMR-0806846 and the MRSEC program (DMR-0213574), and at McMaster University by NSERC and the Canadian Institute for Advanced Research. W. Zhou was supported by NSF grant DMR-0520547. Work in the Billinge group, and use of the National Synchrotron Light Source, Brookhaven National Laboratory, was supported by the U.S. Department of Energy, Office of Basic Energy Sciences, under Contract No. DE-AC02-98CH10886. Finally, we thank the NSF Partnerships for International Research and Education (PIRE) program for valuable support.
References
- Frenkel et al. (1997) A. I. Frenkel, E. A. Stern, and F. A. Chudnovsky, Solid State Commun. 102, 637 (1997).
- McWhan et al. (1973) D. B. McWhan, A. Menth, J. P. Remeika, W. F. Brinkman, and T. M. Rice, Phys. Rev. B 7, 1920 (1973).
- Dernier and Marezio (1970) P. D. Dernier and M. Marezio, Phys. Rev. B 2, 3771 (1970).
- Goodenough (1968) J. B. Goodenough, J. Appl. Phys. 39, 403 (1968).
- Carr and Foner (1960) P. H. Carr and S. Foner, J. Appl. Phys. 31, S344 (1960).
- Arnold and Mires (1968) D. J. Arnold and R. W. Mires, J. Chem. Phys. 48, 2231 (1968).
- Carter et al. (1991) S. A. Carter, T. F. Rosenbaum, J. M. Honig, and J. Spalek, Phys. Rev. Lett. 67, 3440 (1991).
- Greenwood et al. (1971) M. Greenwood, R. W. Mires, and A. R. Smith, J. Chem. Phys. 54, 1417 (1971).
- Smerdou et al. (1996) C. Smerdou, I. M. Anton, J. Plana, R. Curtis, L. Enjuanes, H. R. Kokabi, F. Studer, and M. Toulemonde, Nucl. Instrum. Methods Phys. Res., Sect. B 111, 75 (1996).
- Joshi and Honig (1982) M. G. Joshi and M. J. Honig, Rev. Chim. Miner. 19, 251 (1982).
- Suzuki et al. (1999) T. Suzuki, M. Ogino, T. Yoshizuka, K. Kunihara, and K. Tsuda, Adv. Sci. Technol. (Faenza, Italy) 17, 135 (1999).
- Tenailleau et al. (2002) C. Tenailleau, E. Suard, J. Rodriguez-Carvajal, M. P. Crosnier-Lopez, and P. Lacorre, Chem. Mater. 14, 3569 (2002).
- Andrich (1966) E. Andrich, Electron. Appl. 26, 123 (1966).
- Perkins et al. (1983) S. R. Perkins, A. Ruegg, and M. Fischer, Adv. Ceram. 7, 166 (1983).
- Pan et al. (1994) Y. Pan, G. Wu, and X. Yi, J. Mater. Sci 29, 5757 (1994).
- Vader (1986) L. G. Vader, J. Catal. 98, 522 (1986).
- Toshiyuki et al. (1997) O. Toshiyuki, I. Yasuhiro, and R. K. Kenkyu, J. Photopolym. Sci. Technol. 10, 211 (1997).
- Zheng et al. (2003) C. Zheng, X. Zhang, S. He, Q. Fu, and D. Lei, J. Solid State Chem. 170, 221 (2003).
- Su and Schloegl (2002) D. S. Su and R. Schloegl, Catal. Lett. 83, 115 (2002).
- Pinna et al. (2004) N. Pinna, M. Antonietti, and M. Niederberger, Colloids Surf. A 250, 211 (2004).
- Zhang et al. (2005) K. Zhang, X. Sun, G. Lou, X. Liu, H. Li, and Z. Su, Mater. Lett. 59, 2729 (2005).
- Gui et al. (2002) Z. Gui, R. Fan, W. Mo, X. Chen, L. Yang, S. Zhang, Y. Hu, Z. Wang, and W. Fan, Chem. Mater. 14, 5053 (2002).
- Schenck (1985) A. Schenck, Muon Spin Rotation Spectroscopy (Adam Hilger Ltd., Bristol, 1985).
- Lee et al. (1998) S. L. Lee, S. H. Kilcoyne, and R. Cywinski, eds., Muon Science: Proceedings of the Fifty First Scottish Universities Summer School in Physics (Institute of Physics Publishing, Bristol, 1998).
- Uemura et al. (2007) Y. J. Uemura, T. Goko, I. M. Gat-Malureanu, J. P. Carlo, P. L. Russo, A. T. Savici, A. A. Aczel, G. J. MacDougall, J. A. Rodriguez, G. M. Luke, et al., Nature Physics 3, 29 (2007).
- Savici et al. (2002) A. T. Savici, Y. Fudamoto, I. M. Gat, T. Ito, M. I. Larkin, Y. J., G. M. Luke, K. M. Kojima, Y. S. Lee, M. A. Kastner, et al., Phys. Rev. B 66, 014524 (2002).
- Uemura et al. (1984) Y. J. Uemura, T. Yamazaki, Y. Kitaoka, M. Takigawa, and H. Yasuoka, Hyperfine Interactions 17-19, 339 (1984).
- Rodriguez-Carvajal (1993) J. Rodriguez-Carvajal, Physica B 192, 55 (1993).
- Moon (1970) R. M. Moon, Phys. Rev. Lett. 25, 527 (1970).
- Heidemann (1970) A. Heidemann, Z. Phys. 238, 208 (1970).
- Carter et al. (1994) S. A. Carter, T. F. Rosenbaum, M. Lu, H. M. Jaeger, P. Metcalf, J. M. Honig, and J. Spalek, Phys. Rev. B 49, 7898 (1994).
- Patterson (1939) A. L. Patterson, Phys. Rev. 56, 978 (1939).
- Finger and Hazen (1980) L. W. Finger and R. M. Hazen, J. Appl. Phys. 51, 5362 (1980).