The Impact of Coupled Dark Energy Cosmologies on the High-Redshift Intergalactic Medium
Abstract
We present an analysis of high-resolution hydrodynamical N-body simulations of coupled dark energy cosmologies which focusses on the statistical properties of the transmitted Lyman- flux in the high-redshift intergalactic medium (IGM). In these models the growth of the diffuse cosmic web differs from the standard CDM case: the density distribution is skewed towards underdense regions and the matter power spectra are typically larger (in a scale dependent way). These differences are also appreciable in the Lyman- flux and are larger than 5 % (10%) at in the flux probability distribution function (pdf) for high transmissivity regions and for values of the coupling parameter (). The flux power spectrum is also affected at the () level for () in a redshift dependent way. We infer the behaviour of flux pdf and flux power for a reasonable range of couplings and present constraints using present high and low resolution data sets. We find an upper limit (at confidence level), which is obtained using only IGM data and is competitive with those inferred from other large scale structure probes.
keywords:
Cosmology: observations – cosmology: theory – quasars: absorption lines1 Introduction
The observational evidence of the present accelerated cosmic expansion represents one of the major challenges to our understanding of the Universe. The standard CDM cosmological model identifies the origin of this acceleration with a cosmological constant term in the field equations of General Relativity. However, this interpretation suffers of extremely severe fine-tuning problems, and possible alternative explanations of the accelerated expansion in terms of a Dark Energy (DE) dynamical field have been proposed (as e.g. by Wetterich, 1988; Ratra & Peebles, 1988; Armendariz-Picon et al., 2000). Among these, particular attention has been recently devoted to coupled DE models (cDE) (Wetterich, 1995; Amendola, 2000; Farrar & Peebles, 2004; Baldi, 2010) where a direct interaction between the DE field and Cold Dark Matter (CDM) particles determines peculiar features in the background expansion of the Universe (e.g. Amendola, 2000), in the evolution of linear density perturbations (e.g. Di Porto & Amendola, 2008), and even in the nonlinear dynamics of collapsed structures at small scales (e.g. Baldi et al., 2010; Baldi, 2010). It is therefore of crucial importance in the present cosmological investigation to devise observational tests capable to distinguish between the standard CDM cosmology and alternative DE models as e.g. the cDE scenario (Honorez et al., 2010; Baldi & Pettorino, 2010). In the present work, we explore the possibility to use the observed properties of the diffuse baryonic matter at high redshifts as a direct probe to test and constrain cDE cosmologies.
Standard cosmological models based on cold dark matter plus a cosmological constant predict that most of the baryons at high redshift are in a diffuse form, the Intergalactic Medium (IGM), and fill a significant portion of the Universe, giving rise to the so-called cosmic web: a network of median fluctuated filaments interconnecting galaxies and tracing the underlying dark matter distribution. A great progress in the study of the IGM has been recently made thanks to the large data sets available and in particular high resolution quasar (QSO) spectra (Ultra Violet Echelle Spectrograph or HIRES) and the low resolution Sloan Digital Sky Survey (SDSS) QSO spectra: the present limitations appear to be of systematic nature rather than statistical. High and low-resolution Lyman- QSO spectra of distant sources are thus very useful in characterizing the properties of the underlying mass density field at along the line-of-sight (e.g. Bi & Davidsen, 1997; Croft et al., 2002; Viel et al., 2004; McDonald et al., 2005; Meiksin, 2009) and are now routinely analyzed to reconstruct the matter distribution in three-dimensions. The dynamical information on the growth of structures is however convolved non-linearly with other physical effects determining the shape of the Lyman- absorption lines in redshift space (thermal history, peculiar velocities, etc.), and also observational procedures (continuum fitting, removing of the metal lines and strong absorption systems, etc.) need to be properly modeled and marginalized over (see e.g. McDonald, 2006). All these issues make it quite difficult to use the IGM as a cosmological tool since its structures have to be modeled with hydrodynamical simulations that incorporate the most relevant physical processes. Nevertheless, IGM Lyman- data in combination with other probes provide the tightest constraints to date on the neutrino mass fraction and on the coldness of CDM and suggest a higher r.m.s. value for the amplitude of the matter power than that obtained from cosmic microwave background data (e.g. Seljak, 2005; Viel et al., 2007).
In this work we perform the first high-resolution hydrodynamical simulations of cDE models with gas cooling and star formation in order to check whether one can use the IGM to detect the different growth of cosmic structures predicted by these models compared to the standard CDM scenario. To do so, we make use of the modified version of the parallel hydrodynamical N-body code GADGET-2 (Springel, 2005) specifically devised to include the effects of cDE models and already presented in Baldi et al. (2010).
The layout of this Letter is as follows: in Sec. 2 we describe the cosmological models investigated and the hydrodynamical simulations, in Sec. 3 we present the results in terms of 1-pt and 2-pt matter and flux statistics, in Sec. 4 we compute the constraints on the DE-CDM coupling parameter using the SDSS flux power and the flux pdf of UVES spectra and in Sec. 5 we draw our conclusions.
2 hydrodynamical simulations of coupled dark energy models
We consider cDE cosmologies where the accelerated expansion of the Universe is driven by a DE scalar field which interacts with the CDM fluid by directly exchanging energy according to the equations:
| (1) | |||||
| (2) |
where a prime denotes a derivative w.r.t. conformal time and is the conformal Hubble function. The constant parameter fully specifies the interaction and determines the strength of the DE-CDM coupling111Note that we have used units in which and that the definition of the coupling differs by a factor from the one used in some of the literature.. The cDE models described by Eqs. (1,2) have been widely studied in the literature (see e.g. Wetterich, 1995; Amendola, 2000; Pettorino & Baccigalupi, 2008; Wintergerst & Pettorino, 2010; Baldi et al., 2010, and references therein) to which we refer the reader for an extensive discussion of the main features of these models. For the analysis carried out in this Letter, the effect of primary interest is the enhanced growth of CDM density perturbations arising in cDE cosmologies due both to the long-range fifth-force acting between CDM coupled particles (which attract each other with an effective gravitational constant , where is the standard Newtonian value) and to the additional velocity-dependent acceleration of coupled particles which follows from momentum conservation in cDE models.
For our analysis we rely on simulations run with the modified version by Baldi et al. (2010) of the parallel hydrodynamical N-body code GADGET-2 based on the conservative ‘entropy-formulation’ of Smoothed Particle Hydrodynamics (SPH) (Springel, 2005). They consist of a cosmological volume with periodic boundary conditions filled with an equal number of dark matter and gas particles. Radiative cooling and heating processes were followed for a primordial mix of hydrogen and helium. The star formation criterion simply converts in collisionless stars all the gas particles whose temperature falls below K and whose density contrast is larger than 1000 (Viel et al. (2004) have shown that the star formation criterion has a negligible impact on the flux statistics considered here). More details on the gas cooling and on the Ultra Violet background can be found in Viel et al. (2004).
The cosmological reference model corresponds to a ‘fiducial’ CDM Universe with parameters, at , , , km s-1 Mpc-1 and , consistent with the results of WMAP 5-years data (Komatsu et al., 2009). The cDE models considered in our analysis are two scalar field models with a Ratra-Peebles (Ratra & Peebles, 1988) self-interaction potential, , with and with couplings and , already studied in Macciò et al. (2004) and Baldi et al. (2010), and labelled “RP2” and “RP5”, respectively. These acronyms refer to the type of self-interaction potential (where “RP” stands for the Ratra-Peebles potential) and to the strength of the coupling in a scale ranging from (which would appear as RP1) to (our RP5 model). Other numerical simulations for some related models of interacting DE or modified gravity – but without hydrodynamics – have been presented by e.g. Nusser et al. (2005); Kesden & Kamionkowski (2006); Schmidt (2009); Keselman et al. (2010); Li & Barrow (2010).
Initial conditions for all the runs are realized by displacing particles from a cartesian grid according to Zel’dovich approximation in order to obtain a particle distribution with the desired spectrum of density fluctuations. The initial shape of the power spectrum for cDE models is slightly blue-tilted with respect to the fiducial CDM scenario (see Baldi et al., 2010, for a description of the tilt in cDE models) and this effect is taken into account in our runs. The amplitude of the initial () density fluctuations in the different simulations is then rescaled with the appropriate growth factor in order to normalize all the linear power spectra to the same at .
It is also important to stress that the cDE and CDM simulations have been performed with the same random phases in the initial conditions and the same set of cosmological parameters at : thereby the differences that we will highlight will be exclusively due to the different couplings and not to other parameters. We have used dark matter and gas particles in a comoving Mpc box for the flux power to sample the scales probed by the SDSS. The gravitational softening was set to kpc in comoving units and the mass per DM particle is M. The snapshots analysed are in the redshift range since these are the redshifts at which the flux power is measured by SDSS and 1000 quasar spectra are extracted for each redshift bin. Noise properties are added to the spectra in order to reproduce the observed data.
3 Results
3.1 Impact on density and flux statistics
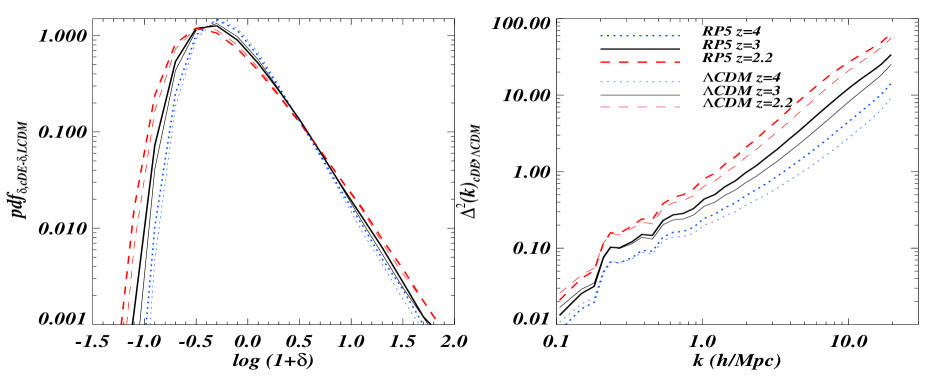
We first consider the matter fields as extracted from the simulations. In Figure 1 (left panel) we show results for the IGM density probability distribution functions between cDE models and CDM at . The red, blue and black curves refer to the three different redshifts (, respectively) while the thick ones represent the results for RP5 () and the thin ones for CDM (for clarity we do not plot the RP2 model in these figures). It is clear that it is more likely to encounter low density regions along the line-of-sight in a cDE model rather than in a standard cosmology: i.e. the gas distribution of a cDE model is skewed towards regions that are less dense than the mean. While the differences at for the RP2 model are about a factor two for , they rise to a factor seven for the RP5 model. A visual inspection of some one-dimensional gas density fields confirms this trend and shows that in cDE models the underdense regions are usually emptier than in the corresponding CDM case. There are also some differences at large densities but we do not focus on those here since their volume filling factor is much smaller than less dense regions.
In the right panel we plot the matter power spectra for the same two models shown in the left panel: the non-linear power spectrum of cDE models is tilted and usually larger than for the CDM model. We recall that the power spectra are normalized to reproduce the same at and thereby their growth is different (see Baldi et al., 2010). The pivot scale is at about Mpc, which corresponds to (roughly) a scale of about 0.0025 s/km in redshift space for the corresponding one dimensional flux power. At scales Mpc the matter power for RP5 (RP2) is about 25% (2%) larger than the CDM matter power (we have again plotted here only the CDM and the RP5 models for clarity reasons).
We note that the inferred linear matter power spectrum amplitude from the analysis of the SDSS flux power by McDonald et al. (2005) is recovered with a error bar of about 15%, thus we naively expect, even without performing any analysis in terms of flux power, that this dependent increase in the matter power can be constrained and the RP5 model ruled out from this data set alone.
We now turn our attention to the mock sets of QSO spectra that have been extracted from each snapshot and normalized to reproduce the same (observed) effective optical depth as estimated by Kim et al. (2007). The scaling factors that are used in order to normalize the optical depth differ by less than 4% between cDE and CDM models.
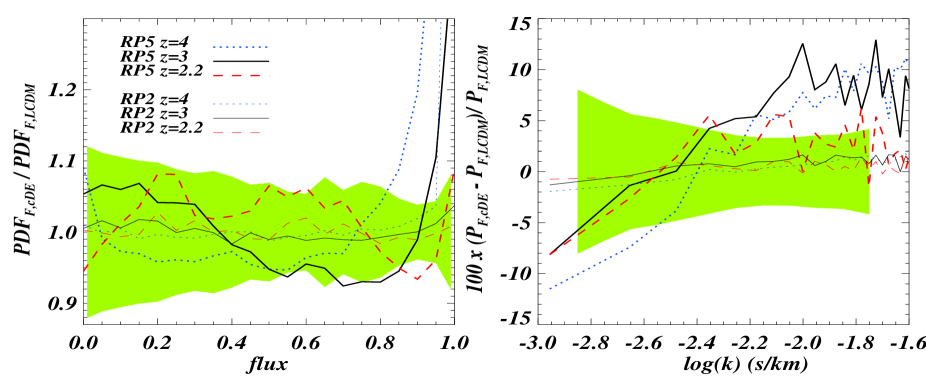
In Figure 2 we plot the 1-pt and 2-pt distribution functions in terms of flux pdf (left panel) and flux power (right panel). The color coding is the same as in the previous figures. The differences that are present for the low-density tail of the gas pdf show up in regions of high transmissivity (flux values 1). This demonstrates that cDE voids are emptier of gas and contain less neutral hydrogen than in a corresponding CDM universe. Our findings therefore suggest that cDE models might alleviate the discrepancy between simulations and observations in voids, thereby providing a possible solution to the so called “Void Problem” (Peebles, 2001; Keselman et al., 2010). It is also intriguing that from the analysis of SDSS data McDonald et al. (2005) find a structure growth at that is faster than that predicted by CDM, although with a relatively low statistical significance: this could be better reproduced by cDE rather than standard cosmologies.
We also note that there is an increase in regions of low transmissivity, although this effect is subdominant compared to the first one: the flux pdf is clearly more skewed in cDE cosmologies than in the standard case since the cosmic web appears to be more evolved in the former case rather than in the latter. The shaded area represents the statistical error bars inferred from a jack-knife estimate of high-resolution UVES data (Kim et al., 2007) at .
The flux power is shown in the right panel and we can see that a similar (although smaller in magnitude) trend to the matter power spectrum case is present. The flux power is tilted with a pivot scale roughly corresponding to that of the matter power. The differences consist in a suppression at the 10% level at the largest scales for RP5 () and 2% for RP2 (): the effect is nearly symmetric w.r.t. the pivot scale and at 0.01 s/km the power has increased by roughly the same amount. The shaded area indicates for quantitative comparison the statistical error estimated at by McDonald (2006) from the low resolution SDSS QSO data set
If we compare the effects that cDE cosmologies have in terms of flux pdf and flux power with those of other parameters we can note the following: as for flux pdf we can compare our findings with Figs. 1 and 2 of Bolton et al. (2008): the effect is similar to that of having a larger value for and a lower value for the parameter for the IGM temperature-density relation, but the redshift dependence is quite different in the two cases since we have a strong evolution between and in cDE cosmologies and a much smaller one in CDM; the effect on the flux power is distinct from that of having a different value for the power spectrum amplitude (see Fig. 13 in McDonald et al. (2005) and Fig. 3 in Viel & Haehnelt (2006)); the effect on the flux power is also different from that of a different spectral index which does not allow for a change of sign but is either positive or negative in the whole range of scales (Fig. 3 in Viel & Haehnelt, 2006). To give a rough quantitative reference for a direct comparison we note that the effect in terms of flux power of a non-zero coupling, for the particular models investigated here, is similar to that introduced by a change in the slope of the linear matter power spectrum (see McDonald et al., 2005) of about , being the slope of the power spectrum at s/km and , while the trends are different for the other cosmological and astrophysical parameters. As for the flux pdf the effects are similar to those introduced by a different value: for fluxes of the order F=0.9 the effect on the flux pdf is around when the value is increased by , very similar to those introduced by the RP5 model but with a different redshift dependence. We also note that the signature is degenerate with that of non-gaussianity at the level of flux pdf but not at the level of flux power (Viel et al., 2009). Therefore the cDE signature on Lyman- flux statistics for the specific models investigated here seems to be unique and competitive constraints can be expected.
3.2 Constraints on the coupling
We now seek constraints on the coupling parameter by using a second order Taylor expansion method for the flux pdf and flux power. This method is described in Viel & Haehnelt (2006) and in Lidz et al. (2009) and although having the drawback of underestimating the error bars it has the advantage of being calibrated on accurate full hydrodynamical simulations. We perform a Monte Carlo Markov Chain analysis in the cosmological and astrophysical parameter space by varying all the parameters that impact on the flux statistics. We have the following set of cosmological parameters: , , , , a parameter describing the effect of reionization, and the coupling ; in addition to these we have the following astrophysical parameters: (amplitude and slope at ), (amplitude and two slopes at and , (amplitude and two slopes at and ), where both the latter functions are parameterized as , and a parameter describing the errors induced by continuum fitting on the flux pdf (see Viel et al., 2009). We use two data sets: the flux pdf of Kim et al. (2007) which consists of 63 data points (21 data points per redshift bin) at and ) and the 132 data points at of the SDSS flux power of McDonald (2006) (12 measurements of the flux power at k (s/km) for the 11 redshift bins). We include the data covariance matrix in the analysis and present results in terms of marginalized values for . For the joint analysis of pdf and flux power we have a total of 15 parameters that are varied and we apply a weak prior on (amplitude and slope). There are also other 13 parameters that describe noise and resolution properties and the presence of damped Lyman- systems for the flux power.
We summarize here the constraints found. For the pdf: and (2 C.L.) by using the flux pdf alone in the range , with a reduced (35 d.o.f.); and (2 C.L.) by using the flux pdf alone in the whole range , with a reduced (53 d.o.f.). The ranges at low and high transmissivity are those that are most difficult to model due to the presence of strong systems and continuum fitting errors, respectively. Thus, we regard the first result presented as more conservative even though we do model continuum fitting errors and correct for numerical resolution (Viel et al., 2009). For the flux power only we obtain: and (2 C.L.) using all the 132 data points (, for 120 d.o.f.). All these numbers are reasonable and demonstrate that the regions of high transmissivity have a constraining power which is stronger than the power spectrum alone. If we combine the two measurements we find the same trends as in Viel et al. (2009): there is not a very good fit to the data ( for 164 d.o.f.), and a reasonable is obtained only when neglecting the three highest redshift bins of the SDSS flux power. In this case, we obtain and (2 C.L.) with a reduced (146 d.o.f.). All the other parameters are not affected significantly by the new parameter introduced and there are not strong degeneracies for .
From the analysis performed we can conclude that robust upper limits on the coupling constant are in the range (depending on the subset of data chosen). These bounds are exclusively derived by the analysis of the observed properties of the IGM and represent a completely new and independent test of cDE cosmologies w.r.t. previous constraints (as e.g. Bean et al., 2008; La Vacca et al., 2009; Xia, 2009). We regard a limit of as a conservative overall bound once the statistical limitations of the different samples are taken into account.
4 Conclusions
In this work we have explored the possibility of constraining the coupling between CDM and DE through the statistical properties of the transmitted flux in Lyman- forest QSO spectra at . For this purpose, we have performed the first high-resolution hydrodynamical simulations with gas cooling and star formation in the context of cDE models and quantitatively exploited the capabilities of flux 1-pt and 2-pt functions to constrain the strength of the coupling between DE and CDM.
The main results can be summarized as follows:
-
•
A non-zero coupling between dark matter and dark energy produces differeces in the probability distribution functions for the gas that are more prominent in underdense regions: the pdf being skewed towards voids in cDE models compared to standard cosmologies;
-
•
Voids in cDE cosmologies are emptier and contain less neutral hydrogen as compared to CDM, and this effect might alleviate tensions between simulations and observations in voids;
-
•
The matter power spectra, for the specific cDE models investigated here, are also affected in a scale-dependent way at high redshift to a level that can be constrained by the data;
-
•
The impact of these effects in terms of flux pdf and power spectra is smaller but still larger than present statistical errors and more importantly is not degenerate with that of other parameters that act in a similar way due to its different redshift evolution;
-
•
By using a Monte Carlo Markov Chain scheme that allows to vary all the parameters involved (astrophysical, cosmological and noise-related) we obtained a robust and conservative upper limit of at the C.L., after having marginalized over the other parameters. This limit on the coupling is a new and completely independent constraint with respect to previous bounds based on different observables.
This work quantitatively shows that the Lyman- range of scales and redshifts, where the growth of structures can be radically different from that measured from a naive extrapolation of either local or very high redshift probes, is promising for constraining coupled dark energy cosmologies. The increasing number of QSO spectra that are being collected (e.g. BOSS222http://www.sdss3.org/, X-Shooter333http://www.eso.org/sci/facilities/paranal/instruments/xshooter/) offers the exciting prospect of further improving the numbers and of understanding in a more refined way, by performing simulations and by addressing systematic errors, the impact that coupled dark energy cosmologies can have on the diffuse gas at high redshift.
Acknowledgments.
MB is supported by the DFG Cluster of Excellence “Origin and Structure of the Universe” and partly supported by the TRR Transregio Collaborative Research Network on the “Dark Universe”. MV is partly supported by ASI/AAE, INFN-PD51 and PRIN/MIUR. Numerical simulations have been performed at RZG Computing Centre in Garching. Post processing and data analysis have been carried out at COSMOS and HPCS (Cambridge), and CINECA thanks to a CINECA/INAF grant.
References
- Amendola (2000) Amendola L., 2000, Phys. Rev., D62, 043511
- Armendariz-Picon et al. (2000) Armendariz-Picon C., Mukhanov V. F., Steinhardt P. J., 2000, Phys. Rev. Lett., 85, 4438
- Baldi (2010) Baldi M., 2010, arXiv:1005.2188
- Baldi & Pettorino (2010) Baldi M., Pettorino V., 2010, arXiv:1006.3761
- Baldi et al. (2010) Baldi M., Pettorino V., Robbers G., Springel V., 2010, MNRAS, 403, 1684
- Bean et al. (2008) Bean R., Flanagan E. E., Laszlo I., Trodden M., 2008, Phys. Rev., D78, 123514
- Bi & Davidsen (1997) Bi H., Davidsen A. F., 1997, ApJ, 479, 523
- Bolton et al. (2008) Bolton J. S., Viel M., Kim T.-S., Haehnelt M. G., Carswell R. F., 2008, MNRAS, 386, 1131
- Croft et al. (2002) Croft R. A. C., Weinberg D. H., Bolte M., Burles S., Hernquist L., Katz N., Kirkman D., Tytler D., 2002, ApJ, 581, 20
- Di Porto & Amendola (2008) Di Porto C., Amendola L., 2008, Phys. Rev., D77, 083508
- Farrar & Peebles (2004) Farrar G. R., Peebles P. J. E., 2004, Astrophys. J., 604, 1
- Honorez et al. (2010) Honorez L. L., Reid B. A., Mena O., Verde L., Jimenez R., 2010, arXiv:1006.0877
- Kesden & Kamionkowski (2006) Kesden M., Kamionkowski M., 2006, Phys. Rev., D74, 083007
- Keselman et al. (2010) Keselman J. A., Nusser A., Peebles P. J. E., 2010, Phys. Rev. D, 81, 063521
- Kim et al. (2007) Kim T. ., Bolton J. S., Viel M., Haehnelt M. G., Carswell R. F., 2007, MNRAS, 382, 1657
- Komatsu et al. (2009) Komatsu E., et al., 2009, Astrophys. J. Suppl., 180, 330
- La Vacca et al. (2009) La Vacca G., Kristiansen J. R., Colombo L. P. L., Mainini R., Bonometto S. A., 2009, JCAP, 0904, 007
- Li & Barrow (2010) Li B., Barrow J. D., 2010, 1005.4231
- Lidz et al. (2009) Lidz A., Faucher-Giguere C., Dall’Aglio A., McQuinn M., Fechner C., Zaldarriaga M., Hernquist L., Dutta S., 2009, ArXiv e-prints
- Macciò et al. (2004) Macciò A. V., Quercellini C., Mainini R., Amendola L., Bonometto S. A., 2004, Phys. Rev., D69, 123516
- McDonald et al. (2005) McDonald P., Seljak U., Cen R., Shih D., Weinberg D. H., Burles S., Schneider D. P., Schlegel D. J., Bahcall N. A., Briggs J. W., Brinkmann J., Fukugita M., Ivezić Ž., Kent S., Vanden Berk D. E., 2005, ApJ, 635, 761
- McDonald (2006) McDonald P. e. a., 2006, ApJS, 163, 80
- Meiksin (2009) Meiksin A. A., 2009, Reviews of Modern Physics, 81, 1405
- Nusser et al. (2005) Nusser A., Gubser S. S., Peebles P. J. E., 2005, Phys. Rev., D71, 083505
- Peebles (2001) Peebles P. J. E., 2001, ApJ, 557, 495
- Pettorino & Baccigalupi (2008) Pettorino V., Baccigalupi C., 2008, Phys. Rev., D77, 103003
- Ratra & Peebles (1988) Ratra B., Peebles P. J. E., 1988, Phys. Rev., D37, 3406
- Schmidt (2009) Schmidt F., 2009, Phys. Rev., D80, 043001
- Seljak (2005) Seljak U. e. a., 2005, Phys. Rev. D, 71, 103515
- Springel (2005) Springel V., 2005, MNRAS, 364, 1105
- Viel et al. (2007) Viel M., Becker G. D., Bolton J. S., Haehnelt M. G., Rauch M., Sargent W. L. W., 2007, ArXiv e-prints, 709
- Viel et al. (2009) Viel M., Bolton J. S., Haehnelt M. G., 2009, MNRAS, 399, L39
- Viel et al. (2009) Viel M., Branchini E., Dolag K., Grossi M., Matarrese S., Moscardini L., 2009, MNRAS, 393, 774
- Viel & Haehnelt (2006) Viel M., Haehnelt M. G., 2006, MNRAS, 365, 231
- Viel et al. (2004) Viel M., Haehnelt M. G., Springel V., 2004, MNRAS, 354, 684
- Wetterich (1988) Wetterich C., 1988, Nucl. Phys., B302, 668
- Wetterich (1995) Wetterich C., 1995, Astron. Astrophys., 301, 321
- Wintergerst & Pettorino (2010) Wintergerst N., Pettorino V., 2010, 1005.1278
- Xia (2009) Xia J., 2009, Phys. Rev. D, 80, 103514