Magnetodielectric and magnetoelastic coupling in TbFe3(BO3)4
Abstract
We have studied the magnetodielectric and magnetoelastic coupling in TbFe3(BO3)4 single crystals by means of capacitance, magnetostriction and Raman spectroscopy measurements. The data reveal strong magnetic field effects on the dielectric constant and on the macroscopic sample length which are associated to long range magnetic ordering and a field-driven metamagnetic transition. We discuss the coupling of the dielectric, structural, and magnetic order parameters and attribute the origin of the magnetodielectric coupling to phonon mode shifts according to the Lyddane-Sachs-Teller (LST) relation.
pacs:
77.80.-e, 61.10.Nz, 77.84.-sI Introduction
Many novel complex systems are investigated in the research on magnetoelastic and magnetodielectric coupling Eerenstein et al. (2006); Cheong and Mostovoy (2007); Fiebig (2005). Among them, rare-earth iron borates RFe3(BO3)4 constitute a family of non-centrosymmetrric oxides in which 4f-moments are embedded in a network of Fe spins. These compounds crystallize in trigonal R32 space group at high temperatures Joubert et al. (1968); Campa et al. (1997). The members of the family having rare-earth elements with ionic radii smaller than Sm undergo a structural phase transition lowering the crystal symmetry from R32 to P3121. Klimin et al. (2005); Fausti et al. (2006). Based on single crystal diffraction studies, it has been proposed that the structural transition results in an antiferroelectric state Klimin et al. (2005). Magnetic exchange interactions for R = (magnetic) Rare Earths are complicated due to the 4f-3d interactions and the anisotropy of the 4f-moments which, e.g., affects the direction of Fe-spin in the ordered phase.
Structurally, TbFe3(BO3)4 exhibits edge sharing FeO6 polyhedra which are forming helicodial chains along the axis Campa et al. (1997). Fe spins order antiferromagnetically at K along the helicoidal chains of Fe atoms with the spins parallel to the hexagonal axis while Tb moments are polarized from Fe ordering Popova et al. (2007); Volkov et al. (2007); Campa et al. (1997); Ritter et al. (2007). When a magnetic field is applied along the easy axis , a field induced magnetic transition is observed at temperatures below , i.e. there is a spin-flop of the Fe spins while the Tb moments become fully aligned.
So far R = Gd, Pr, Nd and Tb compounds have been studied in the context of multiferroics and magnetoelectrics. In fact, the space groups of both high and low temperature phases are not polar despite being non-centrosymmetric, therefore the family cannot be considered as multiferroic. On the other hand, it has been shown for R = Gd, Pr, Nd and Tb that magnetic field induces electrical polarization, marking the materials as magnetoelectric Zvezdin et al. (2005); Kadomtseva et al. (2008); Zvezdin et al. (2006, 2009). Also, sizeable spin-lattice coupling was demonstrated for some of these compounds using magnetostriction measurements Zvezdin et al. (2009); Demidov et al. (2009). Within the family, the dielectric properties were reported only for R = Gd where the dielectric constant was found to decrease with decreasing temperature. The onset of magnetic ordering causes an anisotropic anomaly in . In the magnetically ordered phase Gd 4f - Fe 3d magnetic interactions cause a spin reorientation transition which is coupled to the dielectric constant via spin-lattice interaction.Fausti et al. (2006); Yen et al. (2006). Application of magnetic field strongly shifts the spin reorientation transition, giving rise to a 1 magnetodielectric effect Yen et al. (2006). Here, we present a detailed experimental study on the magnetodielectric and magnetoelastic coupling in TbFe3(BO3)4. We have measured the dielectric constant and the magnetostriction and we show by analysis of Raman spectroscopy data that the magnetodielectric coupling is mediated by strain and caused by shifts in the corresponding transverse optical (TO) phonon modes via Lyddane-Sachs-Teller (LST) relationship.
II Experimental
The single crystals we used are from the same batch as in Ref. Popova et al., 2007. The capacitance of the sample was measured using a home-made insert and Andeen-Hagerling AH2500A bridge in a 18 Tesla Oxford cryostat between 5 and 300 K. The measurement frequency was 1 kHz. Magnetostriction measurements were carried out with a capacitance dilatometerWang et al. (2009) in the same cryostat and with the same capacitance bridge. Our dilatometer applies the tilted plate principle with the sample placed in the open center of a ring-like capacitor made from silver. It enables to follow the length changes of the sample at constant temperature upon changing the external magnetic field. The sample length was 1.23 mm. The field was changed quasi-statically from 0 up to 14 T and back with a rate of 0.01 T/s. The length changes of the sample are calculated from the capacitance changes measured by a temperature stabilized capacitance bridge Andeen-Hagerling with a resolution of 5*10-7 pF. Thus, length changes of less than 0.01 Å can principally be resolved. Due to mechanical vibrations, etc., the resolution is limited to 0.1-1 Å in practice. The measurement frequency was 1 kHz. The field dependence of the magnetization up to 15 T was studied in a home-built VSM magnetometer. Klingeler et al. (2006)
The Raman measurements were performed in a backscattering configuration, using a three-grating micro-Raman spectrometer (T64000 Jobin Yvon) equipped with a liquid nitrogen cooled charged coupled device (CCD) detector. The frequency resolution was better than 2 cm-1 for the frequency region considered. The triple grating configuration allows the analysis of a broad spectrum from 10000 cm-1 down to 4 cm-1. The sample was placed in an optical microscope cryostat. The temperature was varied from 4 to 55 K, with a stability of 0.1 K. The scattering was excited by the second harmonic light of a Nd:YVO4 laser (532 nm), focused to 50 m2 with the power density on the sample kept below 0.1 mW/m2. The polarization was controlled both on the incoming and outgoing beams giving access to all relevant polarization combinations. The Raman measurements reported in the paper are performed with both the light’s k-vector and the polarization of the incoming and outgoing field in the BO3 planes.
III Results and Discussion
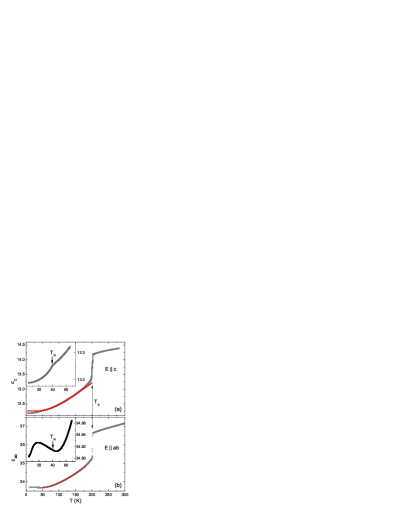
Fig. 1(a) shows the temperature dependence of the dielectric constant measured along the axis. In the whole temperature regime under study, decreases upon cooling. In addition, we observe an abrupt decrease at the structural phase transition at = 202 K. Also the magnetic ordering of the Fe spins at K causes an anomaly in the dielectric constant (see the inset of Fig. 1(a)) which is however much smaller than that at . The temperature dependence of the dielectric constant measured perpendicular to the axis in general resembles the behavior for but there are subtle differences at low temperature (Fig. 1). We again observe a discontinuity at but unlike the case there is only a very weak anomaly at (cf. inset of Fig. 1(b)). Instead, the data display a minimum above the magnetic ordering temperature, i.e. around 50 K, below which the dielectric constant increases. Upon further cooling, decreases again below a broad maximum around 20 K.
The effect of an external magnetic field on applied parallel to the -axis is shown in Fig. 2(a). At K, the capacitance is rather field independent for small but a sharp increase appears around 4 T. At higher fields, the capacitance increases nearly linearly with a rather constant slope. The critical field of the jump in increases upon heating and the size of the jump becomes smaller. Above , i.e. in absence of long range magnetic order, the jump vanishes. Note, that for all temperatures studied in the magnetically ordered phase the behavior in the high-field phase is nearly independent of temperature and the slope at high fields is very similar above , too. The sharp anomaly in the dielectric constant is associated to a previously found field induced magnetic transition (FIMT) which is clearly visible in magnetization measurements (see. Fig. 2(b)). Popova et al. (2007) The magnetization data show a huge jump of roughly 9 /f.u. at the FIMT, and similar to the jump in the anomaly decreases and shifts to higher fields upon heating. The field induced magnetic transition is not only associated to jumps in and in the magnetization but it is also accompanied by strong magnetostrictive effects. As seen in in Fig. 2(c), the -axis exhibits a jump-like decrease at the critical field. Again, the jump reduces upon heating and it is restricted to the magnetically ordered phase. In general, the axis contracts in the whole field range studied. In Fig. 2(d), the magnetic field dependence of is shown, with the magnetic field again applied along the axis. We again observe that the magnetic field dependence is small in both the low-field and the high-field antiferromagnetic phase while the largest changes occur at the FIMT. However, unlike the measurement for , the dielectric constant decreases with magnetic field in the field induced phase. The phase diagram shown in the inset summarizes the transition fields of the FIMT vs. temperature as derived from dielectric constant, magnetization, magnetostriction and specific heat. Popova et al. (2007). We note that sharp changes in magnetostriction and electrical polarization at K were reported recently in pulsed field studies, too. Zvezdin et al. (2009); Demidov et al. (2009) The reported anomalies in the magnetostriction are however about 2 times smaller than found with our quasi-static set-up which might be associated to the different experimental approach, i.e. pulsed magnetic field and usage of a piezoelectric sensor glued to the sample. In addition, there are also qualitative differences to our data, i.e. in at and pronounced hysteresis effects in the magnetostriction and the electrical polarization.
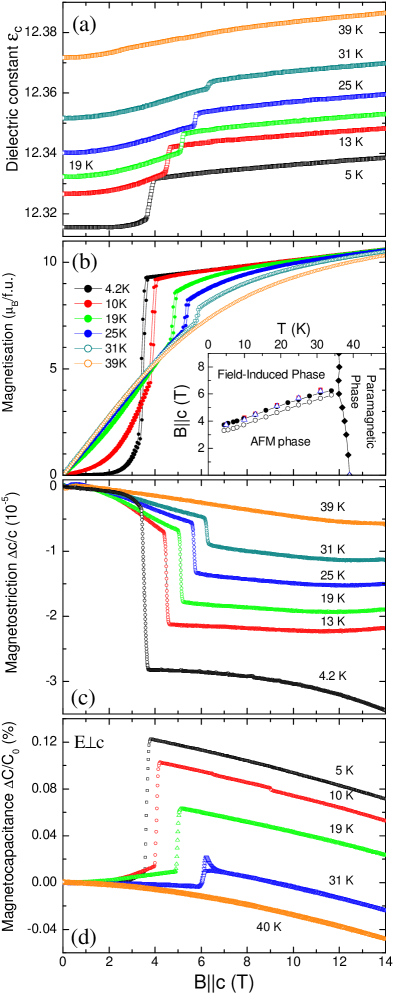
To summarize the experimental data in Fig. 2, at the FIMT TbFe3(BO3)4 displays a magnetically driven phase transition which is associated to sharp jumps in (1) the dielectric constant, (2) the magnetization, and (3) in the length of the -axis. It has been shown earlier for the magnetic degrees of freedom that, at the FIMT, there is a spin-flop of the Fe spins accompanied by a magnetic flip of the Tb moments. Popova et al. (2007)
The pronounced magnetoelastic coupling and the resulting jump of the sample length at the FIMT might suggest that the observed step in the dielectric constant is only associated to the magnetostriction, i.e.
| (1) |
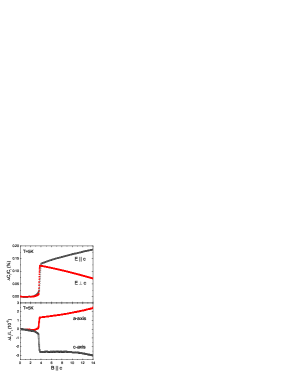
where 0 is the permittivity of the free space, is the dielectric constant, is the area of the contacts, and is the thickness of the sample. In general, a magnetic field induced jump in the sample length implies a capacitance anomaly which can not be discussed in terms of the magnetodielectric effect. This scenario can however be clearly ruled out if the anisotropy of the magnetostriction and magnetocapacitance is considered (cf. Fig. 3). If a magnetic field is applied along the -axis, the length of the -axis and the -axis sharply shrinks and increases, respectively. Such an opposite sign of the length jumps is expected due to at least partial volume conservation of the magnetoelastic distortion. In contrast, both jumps in and exhibit the same sign, i.e. magnetostriction has only a minor effect on the observed field dependence of and cannot explain the changes in (). Therefore, the anomalies clearly point to a direct magnetodielectric coupling.
As discussed above, the general behavior of the dielectric constant vs. temperature is rather isotropic while there is a weak difference between c(T) and a(T) at low temperatures. Interestingly, despite the fact that in GdFe3(BO3)4 the magnetic structure in the ordered phase is different compared to TbFe3(BO3)4, the anomaly at as well as the low temperature behavior () and () is roughly similar in both compounds. Yen et al. (2006) In particular, both materials exhibit an increase of below which in GdFe3(BO3)4 is truncated by a spin-reorientation transition. For GdFe3(BO3)4, the upturn was suggested to originate from the polarization of Gd spins and the vicinity of a spin-reorientation transition Yen et al. (2006). In contrast, there is no spin-reorientation in TbFe3(BO3)4 but as well the specific heat as the magnetization data exhibit a broad Schottky-like anomaly at the temperature where there is the peak in . Recently, the anomalies of the specific heat and the magnetization were explained in terms of temperature-driven population of the ground state of Tb ion split by the internal field of Fe spins Popova et al. (2007) which suggests a similar, i.e. Schottky-like, scenario for the broad peak in in .
In the following we will discuss the origin of the observed magnetodielectric coupling. In general, the dielectric constant is related to optical phonon frequencies via the Lyddane-Sachs-Teller relationship:
| (2) |
In this equation and are the long wavelength longitudinal and transverse optical-phonon mode frequencies, respectively. is the static dielectric constant, i.e. the dielectric constant at zero frequency, and is the optical dielectric constant. Following the early literature on BaMnF4 Fox et al. (1980), MnO Seehra and Helmick (1981) and MnF2 Seehra and Helmick (1984), we have tried to relate the dielectric constant we measured to the relevant TO phonon modes. In order to do so, we have used a modified Barrett equation as described in the aforementioned references as follows:
| (3) |
In this equation, is a coupling constant and 0 is the mean frequency of the final states in the lowest lying optical phonon branch. By fitting our data as indicated by the red lines in Fig. 1 we obtained , cm-1 for ab and , cm-1 for c. We note the tranverse optical mode that we obtained from the Barrett function fits corresponds to an average of all the contributing transverse optical modes in the respective direction Seehra and Helmick (1984).
We have done Raman spectroscopy measurements to look for direct evidence of spin-lattice coupling. According to the previous reports Fausti et al. (2006); de Andres et al. (1997) there are 59 transverse optical modes that correspond to i.e. phonon modes corresponding to a TO mode propagating perpendicular to the axis. We have checked the temperature dependence of these modes and observed that only two low lying ones shift their frequency at low temperatures: the first one at 200 cm-1, the second one at 260 cm-1. The modes at other frequencies do not significantly change their frequency. We show in Fig. 4(a) two representative low-lying phonon modes around 200 cm-1. Upon cooling below the magnetic ordering temperature, one of the modes with the frequency 206 cm-1 does not shift with changing temperature while the frequency of the lower lying transverse phonon mode at 200 cm-1 is shifting remarkably at . Its shift provides direct evidence for the spin-lattice coupling since exchange striction stretches or elongates the bonds and hence shifts the phonon frequencies when magnetic ordering takes place.
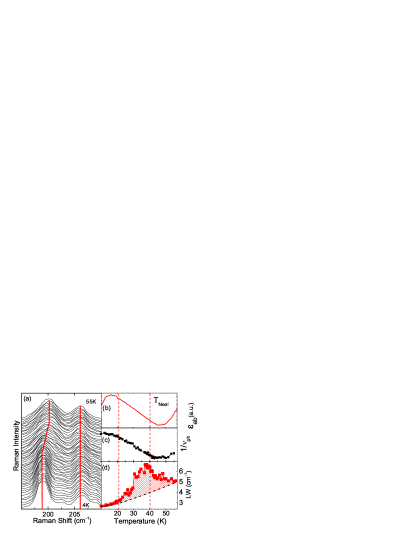
The anomalous softening of the phonon mode reported in Fig. 4(a) is a possible reason for the behavior of the dielectric constant. Below the antiferromagnetic ordering temperature , the behavior of the dielectric constant perpendicular to (as discussed in the previous section) is rationalized in the light of the Raman response. As suggested by the Lyddane-Sachs-Teller (LST) equation the dielectric constant is inversely proportional to the frequency of the TO-phonon mode, associated to it. We note that usually LO-modes and are assumed as temperature independent Samara and Percy (1973); Seehra and Helmick (1984). Fig. 4 summarizes the qualitative agreement between temperature dependence of the dielectric constant (b) and the inverse of the phonon frequency (c). Remarkably, the measured changes of the dielectric constant correspond very well to a decrease of the phonon frequency as described by the LST equation. We note however that in order to have a quantitative agreement, one needs to add the contributions from the all the relevant symmetry allowed TO modes.
In addition to this, the data imply a large anomalous broadening of the phonon mode at the magnetic transition itself. This is shown in Fig. 4(d) where the phonon line-width as a function of temperature across the antiferromagnetic ordering temperature is presented. The black dashed line describes the expected decrease of the phonon lifetime as a function of temperature as if it was purely due to the usual phonon anharmonicity. The (red) dashed area in Fig. 4(d) reveals that in the temperature region close to the magnetic transition another decaying channel is available for the transverse optical mode. In the vicinity of the Neel temperature the phonon broadening deviates much stronger from the expected behavior suggesting that a phonon-magnon coupling channel becomes active at the magnetic ordering temperature. This strongly suggests that the additional decaying channel reducing the phonon lifetime is not directly coupled to the magnetic order parameter but rather to its fluctuations.
In conclusion, we have demonstrated magnetodielectric coupling in TbFe3(BO3)4 using capacitance measurements and revealed the correlation between spin-phonon coupling and dielectric constant. We have shown that magnetodielectric coupling cannot be explained by the magnetostrictive effects but it occurs via shifting of the associated optical phonon modes. The magnetic field induced phase transition the magnetic field induced phase transition is associated to sharp changes of not only the magnetic but also dielectric and structural degrees of freedom, i.e. the spin-flop of Fe spins is accompanied not only by full polarization of the Tb moments but also to a significant distortion probably of the FeO6 octaedra and a jump in the dielectric constant.
Acknowledgements.
We thank K. Leger and S. Gaß for technical support. Work was supported by the DFG through HE 3439/6 and 486 RUS 113/982/0-1.References
References
- Eerenstein et al. (2006) W. Eerenstein, N. D. Mathur, and J. F. Scott, Nature (London) 442, 7104 (2006).
- Cheong and Mostovoy (2007) S. W. Cheong and M. Mostovoy, Nature Mater. 6, 13 (2007).
- Fiebig (2005) M. Fiebig, J. Phys. D 38, R123 (2005).
- Joubert et al. (1968) J. C. Joubert, W. B. White, and R. Roy, Journal of Applied Crystallography 1, 318 (1968).
- Campa et al. (1997) J. A. Campa, C. Cascales, E. Gutierrez-Puebla, M. A. Monge, I. Rasines, and C. Ruiz-Valero, Chem. Mater. 9, 237 (1997).
- Klimin et al. (2005) S. A. Klimin, D. Fausti, A. Meetsma, L. N. Bezmaternykh, P. H. M. van Loosdrecht, and T. T. M. Palstra, Acta Crystallogr., Sect. B: Struct. Sci. 61, 481 (2005).
- Fausti et al. (2006) D. Fausti, A. A. Nugroho, P. H. M. van Loosdrecht, S. A. Klimin, M. N. Popova, and L. N. Bezmaternykh, Phys. Rev. B 74, 024403 (2006).
- Popova et al. (2007) E. A. Popova, D. V. Volkov, A. N. Vasiliev, A. A. Demidov, N. P. Kolmakova, I. A. Gudim, L. N. Bezmaternykh, N. Tristan, Y. Skourski, B. Büchner, et al., Phys. Rev. B 75, 224413 (2007).
- Volkov et al. (2007) D. Volkov, E. Popova, N. Kolmakova, A. Demidov, N. Tristan, Y. Skourski, B. Buechner, I. Gudim, and L. Bezmaternykh, J. Magn. Magn. Mater. 316, e717 (2007).
- Ritter et al. (2007) C. Ritter, A. Balaev, A. Vorotynov, G. Petrakovskii, D. Velikanov, V. Temerov, and I. Gudim, J. of Phys.: Condens. Matter 19, 19622 (2007).
- Zvezdin et al. (2005) A. K. Zvezdin, S. S. Krotov, A. M. Kadomtseva, G. P. Vorob’ev, Y. F. Popov, A. P. Pyatakov, L. N. Bezmaternykh, and E. A. Popova, JETP Lett. 81, 272 (2005).
- Kadomtseva et al. (2008) A. M. Kadomtseva, Y. F. Popov, G. P. Vorob’ev, A. A. Mukhin, V. Y. Ivanov, A. M. Kuz’menko, and L. N. Bezmaternykh, JETP Lett. 87, 39 (2008).
- Zvezdin et al. (2006) A. K. Zvezdin, G. P. Vorob’ev, A. M. Kadomtseva, Y. F. Popov, A. P. Pyatakov, L. N. Bezmaternykh, A. K. Kuvardin, and E. A. Popova, JETP Lett. 83, 509 (2006).
- Zvezdin et al. (2009) A. K. Zvezdin, A. M. Kadomtseva, Y. F. Popov, G. P. Vorob’ev, A. P. Pyatakov, V. Y. Ivanov, A. M. Kuz’menko, A. A. Mukhin, L. N. Bezmaternykh, and I. A. Gudim, JETP 109, 68 (2009).
- Demidov et al. (2009) A. A. Demidov, N. P. Kolmakova, D. V. Volkov, and A. N. Vasiliev, Physica B-Condensed Matter 404, 213 (2009).
- Yen et al. (2006) F. Yen, B. Lorenz, Y. Y. Sun, C. W. Chu, L. N. Bezmaternykh, and A. N. Vasiliev, Phys. Rev. B 73, 054435 (2006).
- Wang et al. (2009) L. Wang, U. Köhler, N. Leps, A. Kondrat, M. Nale, A. Gasparini, A. de Visser, G. Behr, C. Hess, R. Klingeler, et al., Phys. Rev. B 80, 094512 (2009).
- Klingeler et al. (2006) R. Klingeler, B. Büchner, K. Y. Choi, V. Kataev, U. Ammerahl, A. Revcolevschi, and J. Schnack, Phys. Rev. B 73, 014426 (2006).
- Fox et al. (1980) D. L. Fox, D. R. Tilley, J. F. Scott, and H. J. Guggenheim, Phys. Rev. B 21, 2926 (1980).
- Seehra and Helmick (1981) M. S. Seehra and R. E. Helmick, Phys. Rev. B 24, 5098 (1981).
- Seehra and Helmick (1984) M. S. Seehra and R. E. Helmick, J. Appl. Phys. 55, 2330 (1984).
- de Andres et al. (1997) A. de Andres, F. Agullo-Rueda, S. Taboada, C. Cascales, J. Campa, C. Ruiz-Valero, and I. Rasines, Journal of Alloys and Compounds 250, 397 (1997).
- Samara and Percy (1973) G. A. Samara and P. S. Percy, Phys. Rev. B 7, 1131 (1973).