Broad Line Region Physical Conditions
along the Quasar Eigenvector 1 Sequence
Abstract
We compare broad emission line profiles and estimate line ratios for all major emission lines between Ly and H in a sample of six quasars. The sources were chosen with two criteria in mind: the existence of high quality optical and UV spectra as well as the possibility to sample the spectroscopic diversity in the 4D Eigenvector 1 context (4DE1). In the latter sense each source occupies a region (bin) in the FWHM(H) vs. Fe iiopt strength plane that is significantly different from the others. High S/N H emission line profiles are used as templates for modeling the other lines (Ly, Civ1549, Heii1640, Aliii1860, Siiii]1892, and Mgii2800). We can adequately model all broad lines assuming the existence of three components distinguished by blueshifted, unshifted and redshifted centroids (indicated as blue, broad and very broad component respectively). The broad component (electron density cm-3; ionization parameter ; column density cm-2) is present in almost all type-1 quasars and therefore corresponds most closely to the classical broad line emitting region (the reverberating component). The bulk of Mgii2800 and Feii emission also arises in this region. The blue component emission ( ; ; 23) arises in less optically thick gas; it is often thought to arise in an accretion disk wind. The least understood component involves the very broad component (high ionization and large column density) which is found in no more than half (but almost all radio-loud) type-1 quasars and luminous Seyfert nuclei. It is perhaps the most distinguishing characteristic of quasars with FWHM H4000 km s-1 that belong to the so-called Population B of our 4DE1 space. Population A quasars (FWHM H4000 km s-1) are dominated by broad component emission in H and blue component emission in Civ1549 and other high ionization lines. 4DE1 appears to be the most useful current context for revealing and unifying spectral diversity in type-1 quasars.
keywords:
galaxies: quasars – galaxies: quasars: general – galaxies: Seyfert – line: profiles – line:formation – galaxies: quasars: individual: I Zw 1, Mark 478, Mark 335, Fairall 9, 3C 249.1, 3C 1101 Introduction
1.1 Introduction
Quasar spectra are not self-similar even if we restrict ourselves to active galactic nuclei that show broad emission lines (type-1 AGN). Examination of the same broad emission line, in many different sources reveals a striking diversity. This diversity begins with the profile width but extends to every other measurable property (e.g. shape, line shift, equivalent width). The Hi Balmer line H is a good place to start a line profile characterization because so much data exist. It can be observed from the ground out to 0.9 and through numerous IR windows to 3. Thus one can compare the line over a wide range of redshift and source luminosity. It is usually a strong line and suffers only moderate contamination falling in a gap between strong optical Feii blends. At this time good S/N and moderate resolution spectra exist for more than 600 low sources (Marziani et al., 1996, 2003b; Zamfir et al., 2008, 2010, including the brightest 400 SDSS quasars). Table 2 in Sulentic et al. (2000a) tabulates earlier references with high S/N spectra. Comparable quality IR spectra of the H region now exist for more than 50 sources in the range = 0.9 – 3.1 (Sulentic et al., 2004, 2006; Marziani et al., 2009).
The Civ line at 1549 is the other current broad line-of-choice providing a high ionization (HIL) counterpoint to low ionization (LIL) H. High quality Civ1549 spectra for low sources are more difficult to obtain with the HST archive providing UV spectra of the Civ1549 region for 130 sources (Bachev et al., 2004). Above 1.5 Civ1549 is accessible at optical wavelengths out to 4.8. The largest compilation of high quality and high Civ1549 spectra came from the Palomar surveys almost 20 years ago (Young et al., 1982; Sargent et al., 1989; Barthel et al., 1990). A uniform study of the Palomar and other good quality HIL spectra can be found in Tytler & Fan (1992). Unfortunately most sources with good H spectra lack a corresponding Civ1549 spectrum and vice versa. Many of the other broad lines have been studied but usually without the benefit of spectra for other broad lines in the same source. A fundamental desideratum involves strong narrow lines that provide a reliable determination of the quasar rest frame (e.g. [Oiii]4959,5007, and especially [Oii]3727). Full exploitation of the Palomar spectra is impeded by the lack of rest frame determinations for the sources and the lack of matching H spectra.
Broad line profiles provide some of the most direct clues about the nature, structure and kinematics of the central regions in quasars. Inter-line profile comparisons for individual sources (Seyfert 1 nuclei as well as radio-quiet (RQ) and radio-loud (RL) quasars) have been carried out for a long time although there has been little agreement on the systematics (Gaskell, 1982; Wilkes, 1986; Espey et al., 1989; Corbin, 1990; Carswell et al., 1991; Tytler & Fan, 1992; Marziani et al., 1996; Richards et al., 2002). Most of these studies have sampled: (a) small numbers of sources, (b) only a few of the broad lines in each source, and/or (c) less than ideal spectra (see Shang, Wills, Wills, & Brotherton (2007) for a notable exception). If we consider the best studied HIL and LIL features (Civ1549 and H) we find little evidence for profile (shape/shift/EW) similarity for sources with FWHMH 4000 km s-1 while above that value the profiles appear to be more similar, after proper correction for narrow line Civ1549 emission is made (Marziani et al., 1996; Sulentic & Marziani, 1999; Bachev et al., 2004; Sulentic et al., 2007). Ideally we would like to have spectral coverage for all of the principal broad lines in each of a sample of sources that reflect the impressive source-to-source diversity now known. It would also be ideal if we could achieve a consensus on how many distinct components each line contains. This paper will address both of these desiderata.
1.2 Eigenvectors of Quasars
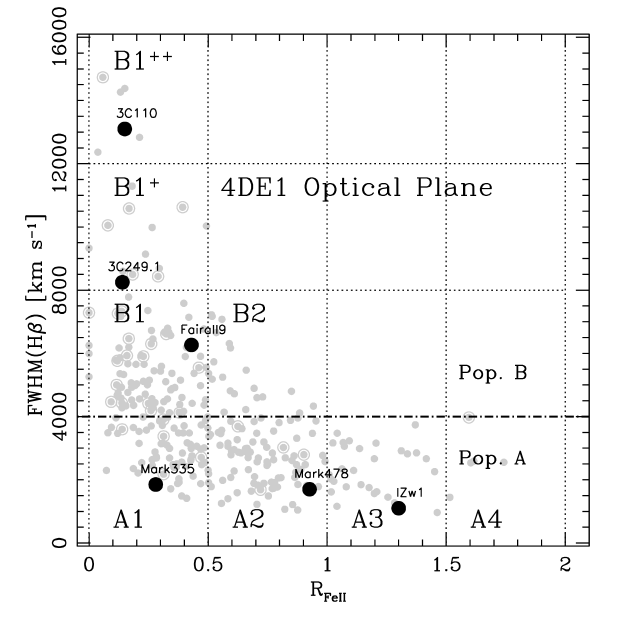
We are never satisfied with the S/N and resolution of the available quasar spectra even though current best data exceed our ability to explain them theoretically. Minimum acceptable values for good spectra are arguably 20-30 in the continuum and respectively. We are tempted to indiscriminately average line profiles in order to improve even more the S/N but a composite spectrum generated from a large sample obscures most of the important astrophysical information. Such composite spectra have heuristic value since they provide a wide spectral coverage and give a global view of the continuum shape (Vanden Berk et al., 2001). Different lines represent averages of different sources making comparison impossible unless all quasar spectra are fundamentally similar. In the context of broad line physics indiscriminate averaging obscures rather than reveals profile differences. It is the “why” of differences that yields physical insight. Not only do quasar spectra show significant diversity but measured line parameters do not scatter symmetrically around an average. Eigenvector analysis showed that the diversity of optical and UV spectra is not entirely random, but that there are systematic trends (Boroson & Green, 1992; Sulentic et al., 2000b). We expanded the original optically based Eigenvector 1 parameters to include Civ1549 and soft X-ray photon index (see also Wang et al. 1996) in an effort to enhance our ability to identify profile differences (4D Eigenvector 1 4DE1 Sulentic et al., 2000a, b, 2007). As examples of the lack of symmetric scatter we note that sources occupy well-defined non-random sequences in e.g. FWHM(H) vs. normalized Feii4570 strength (see Figure 1) or vs. normalized Civ1549 line shift (Figure 2d in Sulentic et al., 2007).
Profile diversity persists when composite spectra are generated in some fundamental context like 4DE1. For example, sources in a restricted region of the 2D parameter space involving FWHM H and Fe iiopt strength measures show considerable profile diversity (Figure 1 which is the optical plane of 4DE1). The composite spectrum for sources in a restricted region (bin) presumably reveals the underlying “stable” emission component(s). The source-to-source diversity within a bin likely reflects minor changes in profile shape connected with profile variability. The bin-to-bin diversity in a contextual space like 4DE1 have the greatest potential to yield clues about broad line region (BLR) structure and kinematics (convolved with source orientation). Contexts for such binned profile composites can be empirical (e.g. FWHM, Feii strength) or physical (e.g. black hole mass , Eddington ratio ). A comparison between e.g. radio-quiet and radio-loud quasars will yield any result that one wants unless the empirical context for profile binning is carefully chosen and is independent of radio properties.
1.3 How Many Broad Line Components?
We would like to compare all principal broad lines in a small sample of sources that reflect the diversity found in the 4DE1 binning. At present however adequate multiwavelength data exist for very few sources so studies encompassing all the principal broad lines are rare (e.g. Shang et al. 2007). The most basic question for facilitating such a study involves how many components one can identify in each broad line. This is particularly important for studies that use the widths of broad lines as virial estimators. Empirical studies have made it clear that HIL (e.g. Civ1549) and LIL (e.g. Balmer series) show a wide range of strength, shape and shift properties. Our own work in the 4DE1 context has attempted to systematize these properties (Sulentic et al., 2000a, 2007; Marziani et al., 2001, 2003b, 2003c, 2008) with focus so far on comparisons of Civ1549 and H assumed to be typical HIL and LIL features.
Several authors have considered the degree of stratification that might exist in the BLR including the idea that the innermost part of the BLR could be emitted in a quasi-distinct very broad line region (VBLR). The VBLR concept may have originated with the discovery that the core and wings of HIL Heii4686 and LIL H in highly reverberated NGC5548 show different responses to continuum change. (Peterson & Ferland, 1986). The VBLR concept and/or terminology arose in several additional guises and this has led to some confusion. Is the VBC present in all quasars? Are there equal numbers of blue- and red-shifted VBC (see e.g. Corbin, 1995)? Is there no significant narrow emission line component in Civ1549? If one rejects a significant Civ1549 narrow component the “peakiness” of the Civ1549 profile in many sources suggests both narrow intermediate line region (ILR) and very broad VBLR as the simplest Civ1549 profile model (Brotherton et al., 1994). We think the answer to all of these questions is “no” (see e.g. Marziani et al., 1996; Sulentic & Marziani, 1999; Sulentic et al., 2002, 2007). Our studies show evidence for a VBC only in sources with FWHM(H) 4000 km s-1 (Population B: Sulentic et al., 2000a, b; Marziani et al., 2003c; Zamfir et al., 2010). The H profile in these sources requires both unshifted gaussian (BC) and redshifted VBC components. Narrower (FWHM H 4000 km s-1) Pop. A sources can often be fitted with a simple Lorentz-like function although a blue asymmetry is seen in the H profiles of some pop. A sources. Whether FWHM H 4000 km s-1 signifies a fundamental change in BLR physics (e.g. critical Eddington ratio?) or not, the highly significant changes in profile shape above and below this value cannot be ignored.
1.4 Defining an Empirical Approach
This paper compares all of the principal broad lines (Ly, Civ1549, Ciii]1909, Mgii2800, H) for a sample of sources where: (1) suitably high S/N spectra are available for all or most of the principal broad lines and (2) 4DE1 spectroscopic diversity is sampled. Our approach is empirical and uses the H profile fit for each chosen source to constrain the fits of all other broad lines in that source. High and low redshift Pop. B quasars show rather symmetric Ly and Civ1549 profiles (Barthel et al., 1990; Bachev et al., 2004) which is in sharp contrast to the appearance of H in Pop. B sources where a red asymmetry is common. In Pop. A the situation is reversed with blue asymmetric Ly and Civ1549 and symmetric Balmer line profiles. Comparisons of H and Civ1549 profiles suggest that three emission components are present in some or all sources.
-
1.
A “classical” BC (FWHM = 600 –5000 km s-1). The H profile is best modeled with a symmetric Lorentzian function for Pop. A sources (FWHM 4000 km s-1) and a Gaussian function for Pop. B (FWHM4000 km s-1). This component may be weak or, even, absent in some Pop. B sources. The bulk of the optical Feii emission appears to follow the BC (e.g., Marziani et al., 2003b).
-
2.
A VBC (FWHM10000 km s-1). H is reasonably well modeled with a Gaussian function. It is only observed in Pop. B sources where it shows a redshift (FWHM in the range 1000-5000 km s-1). This can be the dominant component in some Pop. B sources.
-
3.
A BLUE component (blue shifted or blue asymmetric profile) seen in the H profile of some Pop. A sources with = I(Feii4570)/I(H) 0.5. It is more prominent in Civ1549 where it can be defined as the residual emission after subtraction of an unshifted Lorentzian BC in Pop. A sources. In this paper we model this component with a Gaussian.
If there is a semi-coherent structure that gives rise to all or most of the broad line emission then all broad lines in a source should show similar properties allowing for some degree of stratification. H apparently does not show the same components in all sources motivating the Pop. A-B nomenclature (Sulentic et al., 2000a, b, 2007) as an effective way to highlight this difference. We assume that the distribution of sources in the optical plane of 4DE1 has physical meaning in the sense that source occupation is driven by both physics and line-of-sight orientation. This assumption is reenforced by the discovery that sources in different regions of the optical plane (and especially Pop. A and B regions) show differences in almost all other multiwavelength measures. The sources chosen for this study allow us to test the hypothesis that the same three components observed in H and Civ1549 can account for the diverse line profiles of Ly, Civ1549, Heii1640, Siiii]1892, Aliii1860, Ciii]1909, Mgii2800, H and H. After testing this hypothesis (§4.1) we measure line intensities of the components (§4.3). Analysis of the properties of each line component yields insights about differences in physical conditions of the three identified emitting regions. (§4.4).
2 Source Selection and Observations
Sources were selected to be representative for the spectral diversity in the 4DE1 context. We selected six sources that include one quasar in each of the six most populated 4DE1 spectral bins (A1, A2, A3, B1, B1+ and B1++; Sulentic et al., 2002). Figure 1 marks the location of these sources in the optical plane relative to the distribution of the brightest 400+ SDSS DR5 quasars (Zamfir et al., 2010). We remark that the validity of the analysis presented in this paper is not restricted to 6 objects only. Each object has been chosen as representative of each bin in the E1 plane of Fig. 1. These bins are occupied by 90% of low- quasars (Zamfir et al., 2010). While high S/N and moderate resolution spectral coverage from Ly to H exists for very few quasars we were fortunate to find representative sources for these six bins. UV coverage from Ly to Mgii2800 comes from the HST archive for these low sources save for 3C 110 where Mgii2800 is covered in our optical spectrum. A listing of the available HST spectra can be obtained at the HST archive. A list with the datasets actually employed to build the UV spectra can be obtained from the authors.111It is available at the URL: http:// web.oapd.inaf.it/~marziani/ uvlog.pdf. Optical spectra come from Marziani et al. (2003b); a log of observation can be easily retrieved from their Table 2. UV and optical observations are generally not simultaneous, with a time mismatch of less than 3 years in all cases save Mark 478; in this last case, the UV observations were collected more than 5 years after the optical ones.
We make use of composite spectra for each of these bins (Sulentic et al., 2002; Bachev et al., 2004; Zamfir et al., 2010) computed from the bright SDSS sample or from our spectroscopic atlas (Marziani et al., 2003b). The Ciii]1909 blend is unavailable for 3C110 and the region of Mgii2800 has not been observed in 3C 249. H spectra are only available for three sources. Our composite spectra are used as surrogates for these gaps in our source data.
Table 1 identifies the selected sources where: Col. 1 - IAU code name; Col. 2 - common name recognizable by NED); Col. 3 - adopted redshift; Col. 4: B magnitude; Col. 5 - Galactic B-band absorption from NED; Col. 6 - the spectral type following Sulentic et al. (2002) and Col. 7 - additional information. Two sources have been reverberation mapped (RM Peterson et al., 2004). Galactic absorption values are from Schlegel et al. (1998); if , then . This value has been used with the task deredden of IRAF. No internal extinction correction was applied to our sources.
3 Data analysis
Data used in this paper are wavelength and flux calibrated. Spectra and spectral measures were shifted to rest frame wavelength and flux using the redshift listed in Tab. 1 after correction for Galactic extinction.
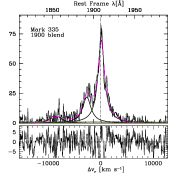
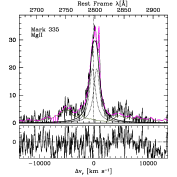
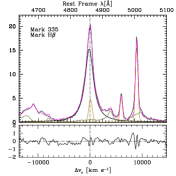
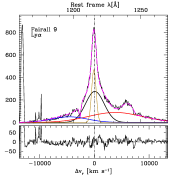
The regions around Ly, Civ1549 (including Heii1640), the blend at 1900 Å (including Aliii1860, Siiii]1892, Ciii]1909), Mgii2800, H (including the Feii4570 blend), and H were analyzed using the specfit task of IRAF (Kriss, 1994). We used an Feii template based on an ESO spectrum of I Zw 1 to correct for Feii contamination. This template was already employed for data analysis in Marziani et al. (2003b, c) with improvements described in Marziani et al. (2009). It is basically the Boroson & Green (1992) template with two major modifications: the Feii emission underlying H was set according to a model simulation, due to the difficulty of distinguishing between H proper and underlying Fe iiopt features (Marziani et al., 2009). In the red, our spectrum shows a significant feature at 6446 Å In any case the Fe iiopt correction is so small that it would not affect any of our results concerning the H line shape. In the UV, Feii emission around Mgii2800, Ciii]1909 and Civ1549 is corrected applying a template obtained from a CLOUDY (Ferland et al., 1998) simulation, assuming ionization parameter 10-2.25, electron density 1012.25 cm-3. Feiii emission, especially prominent around the 1900Å line blend, was modeled using a template build following Vestergaard & Wilkes (2001). There is considerable uncertainty regarding the intensity of the Feiii feature at 1914Å; this feature is heavily blended with Ciii]1909 making it impossible a reliable estimate of the intensity of both lines in Pop. A sources (i.e., in any case the iron spectrum is strong).
The three previously described line components were simultaneously fit along with a power-law continuum and appropriate Feii (and Feiii around 1900 Å) template solution employing minimization techniques. The relative intensity of the components was left free to vary although we imposed the condition that velocity shifts and widths roughly match the ones measured in H and in Civ1549 (BLUE component only).
4 Results
4.1 Multicomponent Fits
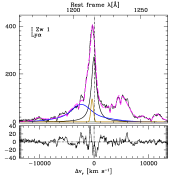
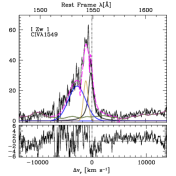
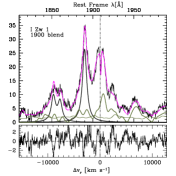
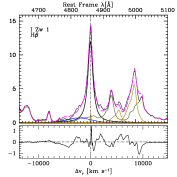
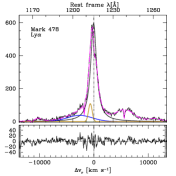
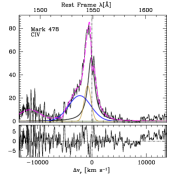
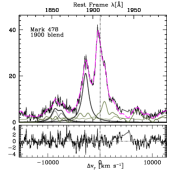
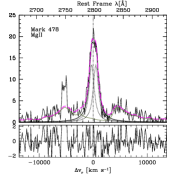
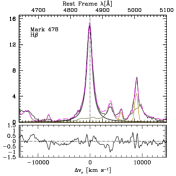
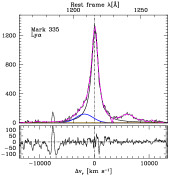
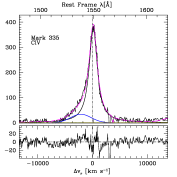
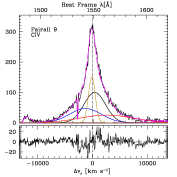
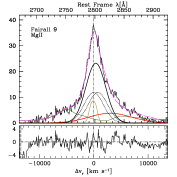
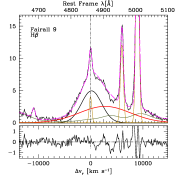
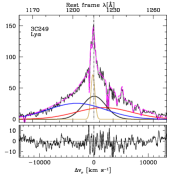
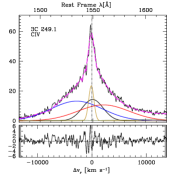
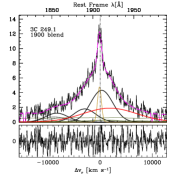
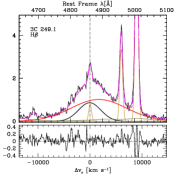
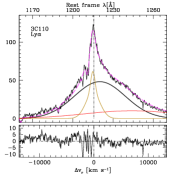
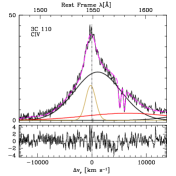
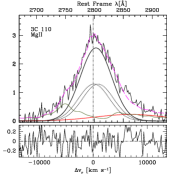
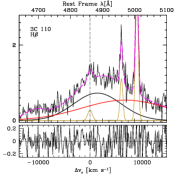
Fig. 2 shows the resultant fits to the line profiles of Ly, Civ1549+Heii1640, 1900Å blend, Mgii2800 and H for each source. H is not included since it does not add information to the line profile interpretation based on H. Residuals are shown below each panel. Table 2 reports the total flux in the Civ1549 line, and the normalized intensity ratios of BC, VBC and BLUE component; individual sources are discussed in Appendix A. The following results are consistent with trends visible in median composite spectra for the same bins (Sulentic et al., 2002; Bachev et al., 2004; Zamfir et al., 2010).
Broad Component
The BC dominates LIL (Balmer lines, Feii, Mgii2800) emission in Pop. A sources, while it becomes less prominent in Pop. B. The fraction of BC H flux decreases for Pop. B sources from bin B1 to B1+ and from B1+ to B1++. The 4DE1 sequence can be described as a sequence of decreasing H BC prominence and may even involve BC demise. Evidence exists for AGN with a very weak or absent BC, some showing no emission lines (e.g. BL Lacs) or only narrow emission lines (type-2 AGN). Others more relevant to this study show lines with strong VBC emission that can be mistaken for a typical type-1 AGN (Sulentic et al., 2000c, e.g. PG1416-129). We suspect that 3C 110 (also discussed in Appendix A) may be an example of this situation. Rather than the two component BC+VBC fits shown in Figure 2 and 3 the correct interpretation for 3C110 may involve a single redshifted VBC component. FWHM 10000 km s-1 would be unprecedented for the BC.
In Pop. A sources I Zw I and Mark 478 Ciii]1909 is closely blended with Feiii emission leaving open the possibility that BC Ciii]1909 may be very weak or absent (for this reason no Ciii]1909 ratios are reported in Tab. 3). Nearby Aliii1860 and Siiii]1892 are also very prominent in these two Pop. A sources. Conversely, bin A1 source Mark 335 shows stronger Ciii]1909 emission and Aliii1860 intensity more similar to Pop. B sources.
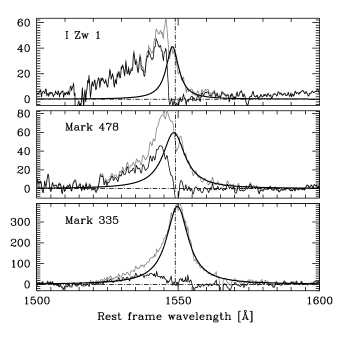
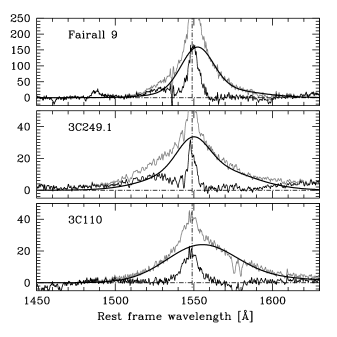
Blueshifted Component (BLUE)
Figure 3 provides the justification for including a blueshifted component in the Figure 2 fits by showing the residual that arises from a two component fit to Civ1549 (BC+VBC) for all six sources. Pop. A sources show a strong residual reflecting the well known blueshifted/asymmetric component. BLUE is present in the Ly and Civ1549 emission of all sources but 3C 110, with typical shifts and widths km s-1and 7000 km s-1. Pop. A and B sources show similar shift and width values. Only bin A3 source I Zw 1 may show a possible hint of this blue component in the H line. BLUE is not seen in Mgii2800 while the 1900 Å blend is too complex to allow any conclusion to be made.
Very Broad Component
A VBC component is one of the defining properties of the broad line spectrum in Pop. B sources. A VBC is not observed in NLSy1 or even less extreme Pop. A quasars (see the cautionary note regarding very high luminosity quasars Marziani et al., 2009). Using H as a template we therefore fit only two components (BLUE + BC) in Pop. A sources. The residuals of those fits show no excess flux on the red wing of H that might be interpreted as a weak VBC signature. This reenforces the earlier proposed ideas that FWHM4000 km s-1 reflects some fundamental change in the structure and/or kinematics of the line emitting region–perhaps connected to a critical value of the Eddington ratio.
Restricting attention to our three Pop. B sources that show a VBC, shifts and widths are 2000 km s-1 and respectively (3C 110 has two entries in Table 5: the second one refers to the assumption of no BC presence in the emission lines; see Appendix A). These values are consistent with the ones derived for median spectra of more than 150 Pop. B sources in the SDSS bright sample (Zamfir et al., 2010). Using H as the model we conclude that a VBC is also present in the Civ1549 profiles of Fairall 9 and 3C 249.1, giving rise to the extended red wings visible in Figure 3. These profiles look deceptively symmetric but both our empirical fits argue that Civ1549 counterparts to the H VBC should be present.
4.2 The Heii1640 profile
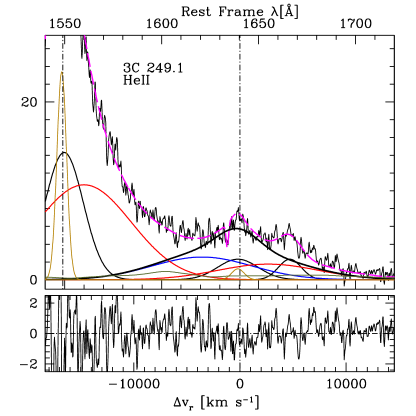
The equivalent width of He+ lines is an Eigenvector 2 parameter involving an apparent anti-correlation with source luminosity (Boroson & Green, 1992). The Heii1640 profile of Pop. B sources is customarily flat-topped and rather extended on the blue side. The profile can be interpreted as due to the sum of the same components observed in Civ1549. An unambiguous decomposition of the Heii1640+Oiii]1663 blend for Pop. A sources is difficult. A fit of the Heii1640+ Civ1549 profile reproduces the shape of the entire blend assuming that Heii1640 is due to blueshifted + broad component. In Pop. B sources, the analysis is even more complex because Heii1640 is blended with the red wing (VBC) of Civ1549. The presence of blueshifted and VBC Heii1640 emission creates the apparent flat extension on the red side of Civ1549 that has not been satisfactorily explained as yet. This extension is visible in the spectra of several RL sources at both low- and high- redshift (Marziani et al., 1996; Barthel et al., 1990). This “plateau” effect is especially well seen on the red side of Civ1549 in 3C 249.1 (Fig. 4) where the best fits for Heii1640 are obtained assuming the blueshifted and VBC components as for Civ1549 and Ly. The same interpretation seems to apply to Heii4686: a good supporting case involves the low-luminosity quasar PG 1138+22 (Marziani & Sulentic, 1993).
4.3 Intensity Ratios
Tables 3, 4, 5 provide flux ratios for the three line components in each of the six sources. The rest-frame equivalent width for Ly is reported for each emission component in the last column of each table. Ratios are reported with 2 significant digits to avoid roundoff errors. Uncertainties on ratios are estimated from the errors in the individual component intensity which are typical 20% for the strongest components (the ones of Ly and Civ1549, Mgii2800 BC, HBC in Pop. A) or for individual or unblended features (Feii) and 50% for the weakest or most blended features (Heii1640, Siiii]1892, Mgii2800 VBC). Applying simple error propagation yields, for the intensity ratio of two components, labeled 1 and 2: . For a typical error on line intensity, the error on ratio is .
BC
The “classical” and almost ubiquitous broad line component shows some line ratios that yield important constraints on the physical conditions: Ly/H 10 (see also Netzer et al., 1995), compared to an expectation of 35 for pure recombination; Mgii2800/Ly 0.1 – 0.3; relatively large (). The Feii/H values assume that all or most Feii arises in the same region as H BC. Removal of the VBC part of H in the estimation increases values over the previously published ones where no H VBC correction was made, yielding for Fairall 9 and 3C 249.1. Civ1549/Ly estimates range from 0.15 for I Zw 1 and Mark 478 increasing to 0.5 for Mark 335 and all Pop. B sources. An apparent anti-correlation between Civ1549/Ly and as well as a positive correlation between Siiii]1892/Civ1549 and for Pop. A sources are visible in median composite spectra of Bachev et al. (2004). Our data in Table 3 confirm a positive trend between Siiii]1892/Civ1549 and for the 3 Pop. A sources, although low Siiii]1892/Civ1549 values are observed for 0.5. The largest Siiii]1892/Civ1549 (and lowest Civ1549/H) ratios are associated with the largest ( 0.5) estimates, probably implying metal enrichment (§4.4.1).
BLUE
The blueshifted component is less constrained due to its weakness in many lines/sources. The only ratios that can be measured involve Ly, Civ1549, and, with greater difficulty Heii1640. Given the importance of the Ly/H ratio we made a special effort to derive an upper limit for it. They are estimated assuming that any H emission is peaking at less than 3 the noise level, meaning that the upper limit to the line flux can be written as , where is the peak line intensity. The lower limits indicate that BLUE values of Ly/H are much higher than those of BC and VBC. This has important physical consequences (§4.4).
VBC
Visually, the observed Fe iiopt emission is fully consistent with an origin in the BC (i.e., no obvious evidence for any any Feii VBC). Even if we measure a FWHM of Feii consistent with the one of H for our 3 Pop. B sources, the VBC large width 10000 km s-1 could create a pseudo-continuum underlying H. To settle the issue of a possible Feii VBC we attempted to fit a VBC of Fe iiopt to the B1 and B1+ composites from the bright SDSS sample of Zamfir et al. (2010, S/N 200). The assumption of Feii VBC with the same shift and width of H leads to implausible results with very large unless Feii VBC is negligible. We conclude that we have no strong evidence of a significant Feii VBC emission.
The red wing of the 1900 blend is ascribed to Ciii]1909 VBC emission, as the iron spectrum of Pop. B sources is always weak.
4.3.1 The Mgii2800/H ratio
With the goal of verifying whether the values of Mgii2800/H reported in Table 3 and 5 are typical, we selected a sample of quasars brighter than =19.0 with SDSS spectra that included both H and Mgii2800 (redshift range = 0.40 – 0.75). While most of these spectra show moderate-low S/N they are good enough to allow one to assign the sources to 4DE1 bins in which context high S/N composite spectra can be computed (normalized to specific flux at 5100 Å). We obtained 160 sources in bin B1 and 58 in B1+. The VBC Mgii2800/H ratios we derive from the bin B1 and B1+ composite spectra are 0.7 and 0.5, respectively. Given Pop. A values in Table 5 and the consistent value Mgii2800/H computed on the median spectra, we conclude that the VBC shows Mgii2800/H ratios 2–3 times lower than the BC. Due to the lesser prominence of the VBC in Pop. B sources, the FWHM of Mgii2800 becomes significantly lower than that of H (Wang et al., 2009).
4.4 Physical Conditions
We generated a multidimensional grid of CLOUDY (Ferland et al., 1998) simulations in order to infer ionization parameter and electron density values from our spectral measurements. Simulations span the density range , and with an interval of 0.25 in both and (c.f. Korista et al., 1997). Each simulation was computed for a fixed ionization parameter and density assuming plane parallel geometry. Part or all of this 2D grid of simulations was repeated assuming = cm-2. Metallicity was assumed to be either solar or five times solar. Two alternative input continua were employed: (1) one assumed to be the standard AGN continuum by CLOUDY which is equivalent to the continuum described in Mathews & Ferland (1987) and (2) the low- quasar continuum of Laor et al. (1997a). We exploit the simulations to deduce constraints on , , and from the most reliable intensity ratios we derived in this paper.
BC
The BC is the better constrained component with relatively large and ratios Aliii1860/ Siiii]1892, Siiii]1892/Civ1549 requiring high density ( 12), low ionization () and large column density (cm-2). These conditions yield values of the important Ly/H and Mgii2800/Ly ratios that are consistent with the ones observed, and explain as well. Larger values suggest super-solar metallicity (§4.4.1). Hereafter we will refer to the BC-emitting region as the LIL-BLR while we will retain the term BLR in its more general meaning i.e., as the region where all of the broad emission is produced.
BLUE
The very large Ly/H ratio suggests radically different conditions including lower optical depth and consistency with 1023cm-2 (see §5.2) . The Ly/H and the Heii4686/ Civ1549 ratios suggest high ionization and densities in the range cm-3. There is no detection of a Ciii]1909 blueshifted component in the 1900 blend, but this is consistent with high ionization gas at density 10: the expected Ciii]1909/Civ1549 ratio for is 0.1, and any blueshifted Ciii]1909 emission would be lost in the 1900Å blend. We included a component with the same shift and width derived for Civ1549 in the fits of F9 and 3C 249.1, but specfit yielded 0 or negative values in the final fit.
VBC
If 0 in the VBC and given the low Mgii2800/Ly ratio, we infer a high ionization parameter . However, Results for VBC are contradictory with all ratios consistent with high ionization but some ratios indicating high and others low density.
We observe Ciii]1909/Civ1549 0.1 – 0.2 which indicates a relatively low density emitting region with cm-3. The observed Heii4686/Civ1549 ratio (0.1 – 0.2) is also consistent with this picture. Much higher density would collisionally quench Ciii]1909 to undetectable levels. Not all VBC line ratios are consistent with moderate density picture. If the Balmer decrement is very flat, and the Ly/H ratio in between 5 and 10, then very high density gas (cm-3) is required (Netzer et al., 1995) as well as a very large optical depth if photoionization is assumed. A large column density cm-2 yields conditions consistent with these line ratios measured for the VBC. Snedden & Gaskell (2007) computed line profile ratios Ly/H and H/H for several luminous Seyfert 1 nuclei (mainly Pop. B) and reached similar conclusions in favor of large and .
4.4.1 Chemical Abundances and Feiii Contribution
The LIL-BLR is the only region allowing for tentative abundance considerations; results should obviously be applicable to the other emitting regions. Ratios involving metal lines should be considered the most robust for deriving physical inferences. Intermediate-ionization lines (like Aliii1860 and Siiii]1892) are produced in a fully ionized region which makes them less dependent on column density than the LILs (Negrete et al., 2010). From the simulations, we find that the ratio Aliii1860/ Siiii]1892 is not strongly dependent on : the ratio increases by about 40% passing from to , for and –2. However, Civ1549/ Siiii]1892 (or, equivalently Civ1549/Aliii1860) is much more affected. The low Siiii]1892/Civ1549 and the other line ratios we measure for Mark 478 can be all accounted for with , , and -2.4. No solution with a well defined value of and is found if is assumed. Even higher metallicity, , is strongly suggested for I Zw 1. The assumption of metallicity above solar is consistent with observations of high- quasars (e.g. Hamann & Ferland, 1999; Juarez et al., 2009), and the two sources where the evidence of higher abundance is strong also show the most prominent Nv1240 line in the Ly panels of Fig. 2, as expected.
In the cases of high metallicity we expect that Feiii should be especially prominent in the 1900 spectral region. The physical conditions derived for the LIL-BLR remind to the Weigelt blobs of Carinæ, located in the equatorial plane of the system, perpendicular to the symmetry axis of the bipolar lobes forming the “Homunculus” nebula. The Weigelt blobs are believed to be dense gas photoionized by the radiation associated to the central, massive star and to a possible companion (e.g., Johansson et al., 2000; Davidson, 2005). The spectrum of the Weigelt blobs shows very weak Ciii]1909 along with a prominent line at 1914, ascribed to the Feiii transition. Although this is not a resonant line (the lower level is 3eV above ground), the line appears very strong because the upper level is populated by Ly fluorescence. Indeed, in I Zw 1 where lines are narrow, the peak emission at 1914 is actually visible, and the Feiii emission around 1900 Å may resemble the one of Model 3 of Vestergaard & Wilkes (2001).
5 Discussion
In the following we will discuss measurements in fixed interpercentile velocity ranges (§5.1) as an approach complementary to our multicomponent analysis. After considering properties of the BLUE component (§5.2) we will show how our results on the physical properties of the different emitting regions do not favor a predominance of line emission from an accretion disk (§5.3.1) or from a binary BLR (§5.3.2). We suggest that the properties of the BLUE, BC and VBC emitting regions as well as their trends along the E1 sequence can be explained by the interplay of gravitational and radiation forces (§5.4 and §5.5). Last, we will discuss our interpretation of the BLR and compare it to past work (§5.7).
5.1 Interpercentile Velocity Measurements
The true profile shapes of the various line components are uncertain. The Lorentz-like shape of Pop. A H profiles can be considered the most accurate assuming that the peak and the wings do not represent independent emission components (e.g., La Mura et al., 2009). The lack of inflections in even the highest S/N composite profiles (Zamfir et al., 2010) motivated us to favor the single component Lorentz fits. Uncertainties in our decompositions force us to restrict the analysis to estimates of the relative component intensities, average line shifts and widths. A double Gaussian function is a good approximation but the individual Gaussian fits may provide uncertain estimates of the relative BC and VBC fluxes in the core of the line where the two components overlap in radial velocity. It is difficult to say whether a stronger core component and a less broad, fully redshifted VBC provide a worse fit, although the SDSS composite spectra of Zamfir et al. (2010) and earlier work on PG 1416-129 (Sulentic et al., 2000c) favor our BC-VBC decompositions. Also, if our interpretation of some sources showing H that is almost pure VBC H (3C110 in this paper) is correct, then the Gaussian functions that we employ represent a reasonable description of the VBC profile shape. Measuring line ratios at fixed inter-percentile velocities is an alternative approach that might have a more direct physical meaning if the BLUE and VBC matter only in the highest radial velocity ranges. We therefore report emission line fluxes measured in three radial velocity ranges of km s-1 centered at 0 km s-1 (“0” range), 4000 km s-1 (B and R ranges for Pop. A sources) and 0 km s-1, 6000 km s-1 (Pop. B sources) in Table 6. The reported measurements were carried out after subtraction of Feii, Feiii and of contaminating narrow and broad lines. Errors are estimated at a confidence level as twice the rms scatter in the radial velocity range times the in Å. Two different centerings of the radial velocity ranges are needed to account for the line width difference of Pop. A and B sources. The overall interpretation as deduced from the multicomponent fit is confirmed. In particular, the data of Table 6 indicate that there is no evidence of an additional red component for Pop. A objects. There is also no convincing evidence of a BLUE component in H of Pop. B sources. The large error bars associated with the Ly/H ratios support the same conclusion motivated by the multicomponent fits for the BLUE component: the upper limits and the possible detection of I Zw 1 imply Ly/H 10. Line ratios for the B, 0 and R ranges yield the same qualitative conclusions as the multicomponent fits, with the limitation that we cannot obtain meaningful results for the heavily blended features at 1900. Also, the large error bars in the H R range of Pop. B sources reflect the residuals of [O iii]4959 subtraction. A comparison of our Ly/H ratios with those of (Netzer et al., 1995) and of our H/H ratios (from the multicomponent fits) with those of Snedden & Gaskell (2007) show agreement especially in the redshifted line wings i.e., for the VBC. This suggests that our approach yields consistent values although the true shape of the VBC component is uncertain especially in the range km s-1km s-1.
5.2 Optically Thin Gas?
The weakness of the response to continuum changes in the H wings and inter-line comparisons e.g. have motivated arguments that the VBC is mainly produced in optically thin gas (Morris & Ward, 1989; Zheng, 1992; Shields et al., 1995; Sulentic et al., 2000c; Corbin & Smith, 2000). On the other hand, several authors have interpreted the response of the blue wings in Civ1549 and H as evidence for predominantly optically thick gas (e.g. Turler & Courvoisier, 1997; Korista & Goad, 2004; Snedden & Gaskell, 2007; Shapovalova et al., 2010, and references therein). Korista & Goad (2004) showed that an optically thick VBLR can explain the stronger core response of H to continuum changes. The small Ly/H and H/H ratios suggest a large column density for both LIL-BLR and VBLR. This interpretation may be correct for some transient sources but is unlikely to apply to more stable sources that show a strong red-ward asymmetry (i.e. Pop. B quasars). In an optically thick medium the intensity of a recombination line depends on the luminosity of the ionizing continuum; if the medium is optically thin it depends on the amount of emitting gas. In practice this places a constraint on the column density . In high luminosity quasars optically thin gas may not be adequate, even with a covering factor approaching unity, to explain the equivalent width and luminosity of the observed VBC (Marziani et al., 2006; Snedden & Gaskell, 2007).
Is the blueshifted component due to optically thin gas perhaps ejected from the central engine? Fig. 5 shows the predicted equivalent width of Ly and Ly/H intensity ratio (thin lines) as a function of the ionization parameter for cm-2 and cm-2. Computations assume total covering, solar metallicity and cm-3. W(Ly) remains approximately constant until the optically thin domain is entered at a “critical” value of . Beyond that value W(Ly) is roughly proportional to the inverse of : in the optically thin domain the increase in continuum luminosity does not give rise to a corresponding increase in line luminosity. The most stringent observational boundary is set for Mark 478 and Fairall 9, with Ly/H45. At the same time, the median Civ1549/Ly and Heii1640/Civ1549 values suggest if = 10. Considering that the observed W(Ly) is in the range 15 – 60 Å, low column density gas at cm-2 can explain the largest observed equivalent widths only if there is substantial covering of the source, i.e., the source is almost completely covered by a geometrically thin shell ( cm) of optically thin gas. A smaller covering fraction is required if cm-2 or larger.
5.3 Alternative Interpretations
5.3.1 Accretion Disk Contribution
Some Pop. B sources show very broad double-peaked H profiles that have been interpreted as the signature of accretion disk line emission (e.g., Eracleous & Halpern, 2003; Strateva et al., 2003). A double peaked signature has been found for Mgii2800 in Arp 102B (Halpern et al., 1996). Others have argued that double-peaked profiles are too rare and disk model solutions too disparate to justify the disk emission hypothesis (Sulentic, 1989). Attempts have been made to find larger samples of double-peaked sources (Strateva et al., 2003; Bon et al., 2009); however, most (90%) of these source are not double-peaked but rather red or blue asymmetric. A large sample of the highest S/N SDSS spectra binned in the 4DE1 context (Marziani et al., 2009; Zamfir et al., 2010) do not show any hint of a double-peak signature in high S/N (250) composites. Broader pop. B sources unsurprisingly favor red asymmetries. Sources included in a given Pop. B bin of Figure 1 show a diversity of red/blue bumps and asymmetries however bin composite spectra show a BC+VBC blend similar to the one observed in e.g. Fairall 9 and 3C 249.1 of this paper. Where is the disk signature? If a significant part of the broad lines is produced in an accretion disk then it must be obscured or masked by non-disk emission components (e.g. Zhang et al., 2009). For Pop. B sources, one could argue that the sum of the BLUE and VBC represents a double peaked component accounting for the broadest part of the line profile with the BC emitted elsewhere. A difficulty with this interpretation is that the gas in the BLUE and VBC appear to be arise in regions with different physical conditions. The BLUE component is not consistent with high density and large column density as expected in standard accretion disk models (e.g., Collin-Souffrin & Dumont, 1990). In the case of Pop. A sources the narrower Lorentz-like profiles, interpreted as a disk signature, would require line emission from a disk with radius 106 gravitational radii which is theoretically and observationally disfavored (Collin & Zahn, 1999). The evidence continues to grow weaker for a predominance of accretion disk emission in Pop. A and Pop. B line profiles. Only a minority of very-broad sources whose prototype is Arp 102B remain consistent with accretion disk predictions (Strateva et al., 2003; Eracleous & Halpern, 2003; Gezari et al., 2007).
5.3.2 Binary BLR
If quasar activity is driven by merger and accretion processes then we might expect to find some/many sources with evidence for a binary black hole. At least some of these sources might involve two AGN with associated BLRs. It has been proposed that binary BH configurations might give rise to double-peaked line profiles (Gaskell, 1985; Halpern & Filippenko, 1988; Shen & Loeb, 2009; Lauer & Boroson, 2009, see Gaskell 2009a for a recent review). Two co-orbiting BH each with a BLR producing (typical) single-peaked broad lines could give rise to double or single peaked composite line profiles depending on the line-of-sight orientation and radial separation of the BHs. A large peak shift km s-1 is not unphysical since km s-1 is less than the typical virial velocity at the reverberation estimated radius of the BLR.
This idea is not easily applicable to Pop. A sources which show quite narrow and symmetric H profiles. The situation for Pop. B sources appears more favorable if one considers, for example, a binary BLR origin of the BLUE and redshifted VBC components. The reductio ad extremum would view all pop B sources as binary pop A sources. One problem with this view would involve the fact that virtually all pop. B sources are pop. B. However in some pop. B sources unshifted BC gas might be associated with a low-ionization region at larger radius and distributed around the center of mass of the two orbiting BH. The radial velocity of the first component would be , while for the second at any given orbital time . is the orbital period, and the BH masses, with , the black hole separation. The inferred properties of the BLUE and VBC components lead one to infer that the masses of the two BHs should be roughly equal. The similarity again raises questions about why we find very different Ly/H ratios and inferred physical conditions for the BLRs around the two BH. In addition, the broadest profiles should “narrow” dramatically on a time scale of yr. Note that the profile presented in Figure 10 of the Shen & Loeb (2009) paper is not double-peaked but a prototypical Pop. B sources showing the red asymmetry that we suggest is due to a distinct VBC emitting region. If one ascribes a (broader) core component to a more massive black hole and the redward asymmetry to a narrower component (less massive BH), then the signs of the two component radial velocities and should always be opposite, which is not the case in the majority of Pop. B sources. The expected change in radial velocity is not seen in Arp 102B-like double peaked sources either (Eracleous et al., 1997; Gezari et al., 2007).
5.4 Role of Mass and Eddington Ratio
Table 7 reports the and values for the sources following the prescription of Vestergaard & Peterson (2006) where: Col. 1 - source name; Col. 2 - specific flux at 5100 Å; Col. 3 - bolometric luminosity assuming a correction factor of 10 from the observed luminosity at 5100 Å; Cols. 4-5 - FWHM of the entire H profile and FWHM of H as derived from the fits; Cols. 6-7 and 8-9 present the corresponding black hole masses and Eddington ratios. values are reduced by 0.3 when the BC component is employed. The effect is larger (factor of 10) if Civ1549 is used as a virial proxy for H in Pop. A sources (Sulentic et al., 2007). Sources follow a sequence of increasing mass and especially decreasing . Pop. A sources show the highest Eddington ratios by an order of magnitude or more. A correction by radiation pressure would leave the Eddington ratio trend unaffected (Marconi et al., 2008). It is interesting to note that the VBC occurs only in Pop. B sources where , but BLUE is strong in both Mark 478 and 3C 249.1 whose is different by almost an order of magnitude.
5.5 Gravitational and Radiative Acceleration
If line emitting gas is optically thick to the Lyman continuum then the radiation will exert an outward acceleration that is inversely proportional to the column density and proportional to the ionizing luminosity. The ratio between the radiative and gravitational accelerations is:
| (1) |
where is in units of 108 solar masses, and is the luminosity of the ionizing continuum (Å) in units of 1044ergs s-1. The equation can be written in the convenient form
| (2) |
If then radiative acceleration dominates. This may be the case for the BLUE component if we interpret the blueshift as a Doppler shift. A condition of equilibrium may be reached at . If , the corresponding is cm-2, a plausible value for the LIL-BLR. Finally if the emitting gas may be unable to withstand the central black hole gravity and may fall toward the center giving rise to the observed redshifted VBC. This interpretation is compatible with large values for the VBLR and would naturally explain why the VBC is observed in objects with low . Of particular relevance to Pop. A sources are emitting clouds moving under the combined effect of gravitation and radiative acceleration (Mathews, 1993; Netzer & Marziani, 2010) that produce the observed Lorentz-like profiles. If 0.1, as in Pop. B, gas of would be pushed away while gas even larger column density could flow out in Pop. A sources.
5.6 Radio Loudness
If we compare the H profile of RQ and RL in Pop. B only i.e., where most radio loud objects are found, there is no major difference although RL objects show a preference toward more extreme redward asymmetries (Marziani et al., 2003c). If we look at high ionization lines of RL objects, the Civ1549 profile can show a blueward asymmetry although a redward asymmetry is more frequent (Marziani et al., 1996; Sulentic et al., 2007; Punsly, 2010). Radio quiet objects of Pop. B show a somewhat different behavior: Civ1549 BLUE is systematically stronger and the profile is more often symmetric or blueward asymmetric. The Sulentic et al. (2007) data suggest that radio loudness may modulate the relative intensity of BLUE and VBC, lowering BLUE, perhaps because radio ejections affect the radial flow seen in RQ quasars (Marziani et al., 1996). BLUE is however definitely observed in RL objects (Barthel et al., 1990; Wills et al., 1995; Small et al., 1997).
5.7 Previous Studies and the Present Interpretation of the BLR
We are aware of only one other attempt to model all major line profiles in a sample of low quasars. Shang et al. (2007) studied 22 sources and modeled all lines using two components–broad and very broad. Their sample is larger and allows for some correlation analysis. However, Pop. A sources are likely overrepresented, a result of their use of an X-ray selection that favors Pop. A sources. The results of Shang et al. (2007) should be therefore related mainly to three Pop. A sources included in our investigation even if some Pop. B present in their data suggest a change in trends at FWHM(H) 4000 km s-1 (their Fig. 5). Their major empirical result, namely that Civ1549 and Ly are very different from H and H in terms of line width, asymmetry, and velocity shifts is confirmed by the present study as far as H is concerned. Our results also suggest, along with Shang et al. (2007), that a simple radially stratified ionization structure of the BLR is unable to explain the different line profiles. A wind component has been isolated through our E1-based approach and three components appear to be a minimum set for the reasons summarized in the introduction. The 4DE1 approach unifies the lines within specific sources and allows for the definition of a trend among the sources. BLUE and LIL-BLR are characterized by well defined properties. The VBLR is a region that could be defined by virtue of high ionization and, if our considerations are correct, large . Within these constraints a large range of parameters – especially density – is suggested. The VBLR is therefore the only region where a locally optimally emitting cloud scheme – where a range of properties occurs at every location (Baldwin et al., 1995)– could apply.
Recent reverberation mapping studies attempted to consider response of lines to continuum changes in bins of radial velocity (Bentz et al., 2008; Denney et al., 2009). Infall is suggested by the observation of a faster response to continuum change in the red wing of H in NGC 3516 and Arp 151. Arp 151 belongs to a perturbed system, and infalling gas can give rise to a redward asymmetries on spatial scales much larger than the one of the BLR (e.g., Rafanelli & Marziani, 1992; Marziani et al., 2003a). Even if it is too early to generalize, these results are consistent with the interpretation of the H redward asymmetry/redshift in Pop. B sources (e.g., Gaskell, 2009b). As far as the VBC is concerned, a possible problem with an infall interpretation is related to the line anisotropy. Very high clouds should prevalently emit lines facing the central photoionizing continuum source; this is true also for H (Ferland et al., 1992). Therefore, if line emission is anisotropic, gas should be visible from the far side of the continuum source and infalling gas should yield a net blueshift. However, if emission comes from the non-illuminated side of the cloud (Ferland et al., 2009), and the more distant part of the infalling gas is obscured a net shift to the red is expected as frequently observed in the line profiles.
5.7.1 On the Origin of the Broad Component
The BC may be distinct from the other emitting regions and in many sources (Pop. A) may be the dominant or only visible component in all LILs. Two defining BC properties involve low ionization degree and symmetry of the line profiles. We find BC width FWHM 5000 km s-1with fractional peak shift /FWHM . This leads to the conclusion that the LIL-BC may be the only H component that is a valid virial estimator. The width of Feii and especially of Mgii2800 likely offer the next best virial estimators (Sulentic et al., 2006; Wang et al., 2009).
The necessity of a low-ionization emitting sub-region within the BLR has been stressed since long, especially by S. Collin and collaborators (Collin-Souffrin et al., 1988). Observational support in favor of this idea came by the realization of the very different profiles of LILs and HILs, as reviewed in the introduction. More recently, the analysis of the Caii IR triplet suggests that a rather dense gas with density 11.5 and is present in the BLR and that is primarily responsible for the observed Oi, Ca ii, and Feii lines, based on the resemblance of their profiles (Matsuoka et al., 2007, 2008). There is a close agreement between the values derived by Matsuoka et al. (2007) and the values derived in this paper through the ratios Aliii1860/ Siiii]1892, Civ1549/ Siiii]1892 (see Negrete et al., 2010, for a more detailed report).
LIL emission from AGN has been the subject of a controversy related to the ionization mechanism: Collin-Souffrin et al. (1988) and Collin-Souffrin & Dumont (1989) suggested mechanical heating to explain the LIL prominence and especially the Feii intensity. Explaining strong LIL emission under the assumption of solar abundance has been a challenge for photoionization models. The Civ1549/Heii1640 and Siiii]1892/Civ1549 intensity ratios lead us to conclude that the assumption of metal enrichment is appropriate. Among Pop. A objects there could be an important role of metallicity in farther defining the properties of the LIL-BLR.We see indeed a trend in the prominence of the Nv1240: the most prominent Nv1240 is observed in I Zw 1 and Mark 478. If the Nv1240/Civ1549 ratio can be used as a metallicity indicator, then our six objects might follow the accretion rate-metallicity relationship pointed out by Shemmer et al. (2004). An increase in iron abundance from a few to several times solar (in agreement with much previous work, e.g. Hamann & Ferland, 1999) is suggested for sources with (A2+ bins).
The low-ionization BC seems to be preferentially associated with young, or rejuvenated, systems like NLSy1 galaxies (Mathur, 2000; Sulentic et al., 2000a, 2008) whose is relatively large (). Enhanced star formation in NLSy1s has been recently demonstrated from analysis of Spitzer data (Sani et al., 2010) while clues have existed for a long time (e.g. Sanders et al., 1988; Krongold et al., 2001, and references therein). Higher metallicity is likely a consequence of top-heavy starbursts that may be frequent in galaxy nuclei (e.g. Bonnell & Rice, 2008). Such starbursts are expected to sustain the high accretion rate typical of Pop. A sources and to provide the enriched LIL-BLR material in extreme Pop. A sources like I Zw 1.
6 Conclusion
Ignoring the composite nature of broad emission lines in quasars will likely result in a poor or erroneous understanding of their emitting regions (as known for 30 years; e.g., Gordon et al., 1981). The contextualization of 4DE1 not only shows that quasars are spectroscopically diverse but it provides a way to organize the differences in order to facilitate interpretation of the emitting components in different classes of sources. Analysis of 6 low- quasars that explores 4DE1 diversity and are believed to be representative of the wide majority of low- quasars suggests that the strongest optical/UV emission lines involve one or more of three different components that can be defined by their shifts with respect to the rest frame of each quasars: a redshifted VBC, an unshifted BC component, and a blueshifted (BLUE) component. The three components have been tentatively isolated through models of the strongest lines from Ly to Mgii2800 and Fe iiopt using H as a template, and characterized as follows.
-
1.
The BC is the broad line component present in the overwhelming majority of type-1 AGN. Feii and Mgii2800 emission likely arise in the same region. Other broad lines usually show a BC component although there may be exceptions: Ciii]1909 may be very weak in extreme Pop. A sources where metallicity enhancement is most in evidence. At the other extreme of the 4DE1 sequence some Pop. B sources may show only weak or even zero BC emission.
-
2.
Pop. A sources show dominant BC emission in LILs and strong BLUE component emission in HILs. The BLUE component is most prominent in NLSy1s, but is detected in most quasars, including Pop. B sources. The prominence of the BLUE component in extreme Pop. A NLSy1s (almost always radio-quiet) suggests that it is not closely related to any relativistic outflow due to radio jets. It has been interpreted as the signature of an accretion disk wind where the receding part of the flow is obscured by the disk (Marziani et al., 1996). If the interpretation of §5.5 is correct, then BLUE may be due to gas upon which radiative forces dominate. We are able to constrain ionization parameter, density and column density of this outflowing region. These quantities are important to assess feedback effects on the interstellar medium of the quasar host galaxy.
-
3.
The redshifted VBC component can be described as a defining LIL property in Pop. B sources. The BC is distinguished empirically from the VBC by its much larger FWHM and significant redshift. The low Balmer decrement and Ly/H ratio suggest, if we assume photoionization as the heating source of the gas, high ionization and large column density. The physical conditions in the VBLR are not clear, and probably involve a stratification of properties that we are unable to resolve at this time. On the one hand, the Ciii]1909/Civ1549 ratio suggests high ionization and moderate density. On the other hand, the strong Heii1640 emission, the low Ly/H ratio as well as the flat Balmer decrement (H/H) are better explained by extreme density at very high ionization. In this region a locally optimally emitting cloud scheme (Baldwin et al., 1995) could be appropriated.
| IAU Code | NED Name | Sp.T. | Comments222RM: Reverberation Mapping data; listed in Peterson et al. (2004). | |||
|---|---|---|---|---|---|---|
| J00535+1241 | UGC 00545 | 0.0605 | 14.4 | 0.28 | A3 | I Zw 1, H |
| J14421+3526 | MRK 0478 | 0.0771 | 15.0 | 0.06 | A2 | |
| J00063+2012 | MRK 0335 | 0.0258 | 14.0 | 0.15 | A1 | RM, H |
| J012375848 | Fairall 9 | 0.0462 | 13.5 | 0.12 | B1 | RM. H |
| J11042+7658 | PG 1100+772 | 0.3116 | 15.7 | 0.15 | B1+ | 3C 249.1, no MgII |
| J041720553 | 3C 110 | 0.7744 | 15.8 | 0.19 | B1++ | no CIII |
| Sp. T. | Name | F(Civ1549)333F(Civ) = BLUE + BC + VBC | BC(Civ)/ | VBC(Civ)/ | BLUE(Civ)/ |
|---|---|---|---|---|---|
| F(Civ) | F(Civ) | F(Civ) | |||
| [ergs s-1cm-2] | |||||
| A3 | I Zw 1 | 0.74E-12 | 0.36 | 0.00 | 0.74 |
| A2 | Mark 478 | 1.17E-12 | 0.61 | 0.00 | 0.39 |
| A1 | Mark 335 | 6.31E-12 | 0.87 | 0.00 | 0.13 |
| B1 | F 9 | 5.84E-12 | 0.43 | 0.27 | 0.30 |
| B1+ | 3C 249.1 | 2.11E-12 | 0.17 | 0.31 | 0.38 |
| B1++ | 3C 110 | 1.60E-12 | 0.00 | 1.00 | 0.00 |
| Sp. T. | Name | Intensity Ratio | W444Equivalent width in Å. | |||||||
| Civ/ | Aliii/ | Siiii/ | Mgii/ | Feii/ | H/ | Ly/ | Mgii/ | Ly | ||
| Ly | Siiii | Civ | Ly | H | H | H | H | |||
| A3 | I Zw 1 | 0.14 | 0.61 | 0.97 | 0.31 | 1.80 | 4.2 | 5.5 | 1.70 | 61 |
| A2 | Mark 478 | 0.14 | 0.41 | 0.47 | 0.09 | 0.95 | … | 10.3 | 0.94 | 87 |
| A1 | Mark 335 | 0.45 | 0.33 | 0.07 | 0.07 | 0.47 | 4.6 | 15.8 | 1.03 | 102 |
| B1 | Fairall 9 | 0.53 | 0.32 | 0.18 | 0.21 | 1.04 | 6.1 | 12.3 | 2.54 | 158 |
| B1+ | 3C 249.1 | 0.44 | 0.68 | 0.17 | … | 0.54 | … | 10.7 | … | 32 |
| B1++ | 3C 110 | 0.55 | … | … | 0.08 | 0.36555Assigned following the criterion that related FWHM – S/N and minimum detectable intensity, as in Marziani et al. (2003b). | … | 17.0 | 1.3 | 71 |
| Sp. T. | Name | Intensity Ratio | W666Equivalent width in Å. | |||
| Civ/ | Heii/ | H/ | Ly/ | Ly | ||
| Ly | Civ | H | H777Lower limits to Ly/H are estimated by the maximum contribution expected by a component of the same shift and width if peaking at 3 the noise level. See text for a detailed explanation. | |||
| A3 | I Zw 1 | 0.25 | 0.41 | 4.2 | 18 | 60 |
| A2 | Mark 478 | 0.66 | 0.17 | … | 46 | 15 |
| A1 | Mark 335 | 0.45 | 0.67 | … | 32 | 16 |
| B1 | F 9 | 1.05 | 0.14 | … | 46 | 30 |
| B1+ | 3C 249.1 | 0.59 | 0.17 | … | 32 | 53 |
| B1++ | 3C 110888Consistent with 0 intensity in all lines. | … | … | … | … | 0 |
| Sp. T. | Name | Intensity Ratio | W999Equivalent width in Å. | ||||||
| Civ/ | Heii/ | Ciii/ | Mgii/ | H/ | Ly/ | Mgii/ | Ly | ||
| Ly | Civ | Civ/ | Ly | H | H | H | |||
| A3 | I Zw 1 | … | … | … | … | … | … | … | 0 |
| A2 | Mark 478 | … | … | … | … | … | … | … | 0 |
| A1 | Mark 335 | … | … | … | … | … | … | … | 0 |
| B1 | F 9 | 0.36 | 0.13 | 0.18 | 0.08 | 1.26 | 9.0 | 0.68 | 88 |
| B1+ | 3C 249.1 | 0.67 | 0.17 | 0.17 | … | … | 4.5 | … | 41 |
| B1++ | 3C 110 | 0.37 | 0.10 | … | 0.04 | … | 5.0 | 0.2 | 27 |
| 3C110101010VBC only; see text for details. | 0.50 | 0.10 | … | 0.07 | … | 12.6 | 0.83 | 97 | |
| Name | LyaaFluxes in units of 10-12ergs s-1 cm-2. | Civ1549aaFluxes in units of 10-12ergs s-1 cm-2. | 1900a,da,dfootnotemark: | Mgii2800aaFluxes in units of 10-12ergs s-1 cm-2. | HaaFluxes in units of 10-12ergs s-1 cm-2. | |||||||||||||||||
|---|---|---|---|---|---|---|---|---|---|---|---|---|---|---|---|---|---|---|---|---|---|---|
| B | 0 | R | B | 0 | R | B | 0 | R | B | 0 | R | B | 0 | R | ||||||||
| I Zw 1bbB: km s-1 km s-1; 0: km s-1 km s-1; R: km s-1 km s-1. | 4.20.7 | 15.53.4 | 1.10.9 | 1.70.8 | 2.41.3 | 0.4 | 0.2 | 0.80.3 | 0.3 | 4.20.8 | 0.40.3eeStrong Feii residual. | 0.150.10 | 2.4 | 0.1 | ||||||||
| Mark 478bbB: km s-1 km s-1; 0: km s-1 km s-1; R: km s-1 km s-1. | 3.41.1 | 33.02.4 | 1.31.2 | 1.60.6 | 5.11.0 | 0.4 | 0.60.4 | 2.80.5 | 3.20.2 | |||||||||||||
| Mark 335bbB: km s-1 km s-1; 0: km s-1 km s-1; R: km s-1 km s-1. | 7.52.2 | 75.94.9 | 3.91.8 | 3.81.2 | 30.82.5 | ggR: km s-1 km s-1 due to a blemish in the spectrum. | 0.9 | 6.11.8 | 0.8 | 0.7 | 4.50.7 | 0.5 | 0.150.10 | 4.00.2 | ||||||||
| Fairall 9ccB: km s-1 km s-1; 0: km s-1 km s-1; R: km s-1 km s-1. | 4.01.5 | 28.53.2 | 7.22.6 | 2.2 | 16.32.4 | 2.71.0 | 0.8 | 2.50.9 | 0.5 | 4.60.6 | 0.50.4 | 2.20.2 | 0.60.3 | |||||||||
| 3C 249.1ccB: km s-1 km s-1; 0: km s-1 km s-1; R: km s-1 km s-1. | 2.40.5 | 6.01.2 | 1.50.7 | 1.40.2 | 3.6 | 1.10.3 | 0.2 | 0.80.2 | 0.20.1 | … | … | … | 0.150.05 | 0.60.1 | 0.30.1 | |||||||
| 3C 110ccB: km s-1 km s-1; 0: km s-1 km s-1; R: km s-1 km s-1. | 1.40.3 | 4.20.8 | 3.00.2 | 0.70.2 | 2.40.4 | 1.50.2 | … | … | … | 0.1 | 0.50.1 | 0.150.01 | 0.10.1 | 0.4 0.1 | 0.30.2 | |||||||
| Name | FWHM | |||||||||
| at 5100 Å | H | H | H | H | H | H | ||||
| [ergs s-1cm-2 Å-1] | [ergs s-1] | [km s-1] | [km s-1] | [M⊙] | [M⊙] | |||||
| I Zw 1 | 8.40E-15 | 45.5 | 1100 | 1100 | 7.3 | 7.3 | -0.3 | -0.3 | ||
| Mark 478 | 7.13E-15 | 45.7 | 1300 | 1300 | 7.5 | 7.5 | -0.4 | -0.4 | ||
| Mark 335 | 9.00E-15 | 44.8 | 1500 | 15000 | 7.2 | 7.2 | -0.9 | -0.9 | ||
| Fairall 9 | 7.52E-15 | 45.3 | 6500 | 4550 | 8.7 | 8.4 | -2.0 | -1.7 | ||
| 3C 249.1 | 3.00E-15 | 46.5 | 8300 | 5050 | 9.5 | 9.0 | -1.6 | -1.2 | ||
| 3C 110 | 1.50E-15 | 46.8 | 14000 | 10700 | 10.1 | 9.9 | -1.9 | -1.6 | ||
Acknowledgments
DD and AN acknowledge financial support from PAPIIT UNAM, grant IN11161013. PM wishes to thank Prof. H. Netzer for discussions on topics closely related to the present paper. The authors also thank an anonymous referee for suggesting some necessary additions.
References
- Bachev et al. (2004) Bachev, R., Marziani, P., Sulentic, J. W., Zamanov, R., Calvani, M., & Dultzin-Hacyan, D. 2004, ApJ, 617, 171
- Baldwin et al. (1995) Baldwin, J., Ferland, G., Korista, K., & Verner, D. 1995, ApJL, 455, L119+
- Barthel et al. (1990) Barthel, P. D., Tytler, D. R., & Thomson, B. 1990, A&ApS, 82, 339
- Bentz et al. (2008) Bentz, M. C., et al. 2008, ApJL, 689, L21
- Bon et al. (2009) Bon, E., Gavrilovic, N., La Mura, G., & Popovic, L. C. 2009, ArXiv e-prints
- Bonnell & Rice (2008) Bonnell, I. A., & Rice, W. K. M. 2008, Science, 321, 1060
- Boroson & Green (1992) Boroson, T. A., & Green, R. F. 1992, ApJS, 80, 109
- Brotherton et al. (1994) Brotherton, M. S., Wills, B. J., Steidel, C. C., & Sargent, W. L. W. 1994, ApJ, 423, 131
- Carswell et al. (1991) Carswell, R. F., et al. 1991, ApJL, 381, L5
- Collin & Zahn (1999) Collin, S., & Zahn, J.-P. 1999, A&Ap, 344, 433
- Collin-Souffrin & Dumont (1989) Collin-Souffrin, S., & Dumont, A. M. 1989, A&Ap, 213, 29
- Collin-Souffrin & Dumont (1990) —. 1990, A&Ap, 229, 292
- Collin-Souffrin et al. (1988) Collin-Souffrin, S., Dyson, J. E., McDowell, J. C., & Perry, J. J. 1988, MNRAS, 232, 539
- Corbin (1990) Corbin, M. R. 1990, ApJ, 357, 346
- Corbin (1995) —. 1995, ApJ, 447, 496
- Corbin & Smith (2000) Corbin, M. R., & Smith, P. S. 2000, ApJ, 532, 136
- Davidson (2005) Davidson, K. 2005, in Astronomical Society of the Pacific Conference Series, Vol. 332, The Fate of the Most Massive Stars, ed. R. Humphreys & K. Stanek, 101–+
- Denney et al. (2009) Denney, K. D., et al. 2009, ApJL, 704, L80
- Eracleous & Halpern (2003) Eracleous, M., & Halpern, J. P. 2003, ApJ, 599, 886
- Eracleous et al. (1997) Eracleous, M., Halpern, J. P., Gilbert, A. M., Newman, J. A., & Filippenko, A. V. 1997, ApJ, 490, 216
- Espey et al. (1989) Espey, B. R., Carswell, R. F., Bailey, J. A., Smith, M. G., & Ward, M. J. 1989, ApJ, 342, 666
- Ferland et al. (2009) Ferland, G. J., Hu, C., Wang, J., Baldwin, J. A., Porter, R. L., van Hoof, P. A. M., & Williams, R. J. R. 2009, ApJL, 707, L82
- Ferland et al. (1998) Ferland, G. J., Korista, K. T., Verner, D. A., Ferguson, J. W., Kingdon, J. B., & Verner, E. M. 1998, PASP, 110, 761
- Ferland et al. (1992) Ferland, G. J., Peterson, B. M., Horne, K., Welsh, W. F., & Nahar, S. N. 1992, ApJ, 387, 95
- Gaskell (1982) Gaskell, C. M. 1982, ApJ, 263, 79
- Gaskell (1985) —. 1985, Nature, 315, 386
- Gaskell (2009a) —. 2009a, ArXiv e-prints, arXiv0903.4447G
- Gaskell (2009b) —. 2009b, ArXiv e-prints, To appear in ”Accretion and Ejection in AGNs: a Global View”, eds. L. Maraschi, G. Ghisellini, R. Della Ceca and F. Tavecchio, ASP Conf. Series.
- Gezari et al. (2007) Gezari, S., Halpern, J. P., & Eracleous, M. 2007, ApJS, 169, 167
- Gordon et al. (1981) Gordon, C., Collin-Souffrin, S., & Dultzin-Hacyan, D. 1981, A&Ap, 103, 69
- Halpern et al. (1996) Halpern, J. P., Eracleous, M., Filippenko, A. V., & Chen, K. 1996, ApJ, 464, 704
- Halpern & Filippenko (1988) Halpern, J. P., & Filippenko, A. V. 1988, Nature, 331, 46
- Hamann & Ferland (1999) Hamann, F., & Ferland, G. 1999, ARA&A, 37, 487
- Johansson et al. (2000) Johansson, S., Zethson, T., Hartman, H., Ekberg, J. O., Ishibashi, K., Davidson, K., & Gull, T. 2000, A&Ap, 361, 977
- Juarez et al. (2009) Juarez, Y., Maiolino, R., Mujica, R., Pedani, M., Marinoni, S., Nagao, T., Marconi, A., & Oliva, E. 2009, A&Ap, 494, L25
- Korista et al. (1997) Korista, K., Baldwin, J., Ferland, G., & Verner, D. 1997, ApJS, 108, 401
- Korista & Goad (2004) Korista, K. T., & Goad, M. R. 2004, ApJ, 606, 749
- Kriss (1994) Kriss, G. 1994, Astronomical Data Analysis Software and Systems III, A.S.P. Conference Series, 61, 437
- Krongold et al. (2001) Krongold, Y., Dultzin-Hacyan, D., & Marziani, P. 2001, AJ, 121, 702
- La Mura et al. (2009) La Mura, G., Di Mille, F., Ciroi, S., Popović, L. Č., & Rafanelli, P. 2009, ApJ, 693, 1437
- Laor et al. (1997a) Laor, A., Fiore, F., Elvis, M., Wilkes, B. J., & McDowell, J. C. 1997a, ApJ, 477, 93
- Laor et al. (1997b) Laor, A., Jannuzi, B. T., Green, R. F., & Boroson, T. A. 1997b, ApJ, 489, 656
- Lauer & Boroson (2009) Lauer, T. R., & Boroson, T. A. 2009, ApJ, 703, 930
- Marconi et al. (2008) Marconi, A., Axon, D. J., Maiolino, R., Nagao, T., Pastorini, G., Pietrini, P., Robinson, A., & Torricelli, G. 2008, ApJ, 678, 693
- Marziani et al. (2003a) Marziani, P., Dultzin-Hacyan, D., D’Onofrio, M., & Sulentic, J. W. 2003a, AJ, 125, 1897
- Marziani et al. (2006) Marziani, P., Dultzin-Hacyan, D., & Sulentic, J. W. 2006, Accretion onto Supermassive Black Holes in Quasars: Learning from Optical/UV Observations (New Developments in Black Hole Research), 123
- Marziani & Sulentic (1993) Marziani, P., & Sulentic, J. W. 1993, ApJ, 409, 612
- Marziani et al. (2008) Marziani, P., Sulentic, J. W., & Dultzin, D. 2008, in Revista Mexicana de Astronomia y Astrofisica Conference Series, Vol. 32, Revista Mexicana de Astronomia y Astrofisica Conference Series, 69–73
- Marziani et al. (1996) Marziani, P., Sulentic, J. W., Dultzin-Hacyan, D., Calvani, M., & Moles, M. 1996, ApJS, 104, 37
- Marziani et al. (2009) Marziani, P., Sulentic, J. W., Stirpe, G. M., Zamfir, S., & Calvani, M. 2009, A&Ap, 495, 83
- Marziani et al. (2003b) Marziani, P., Sulentic, J. W., Zamanov, R., Calvani, M., Dultzin-Hacyan, D., Bachev, R., & Zwitter, T. 2003b, ApJS, 145, 199
- Marziani et al. (2001) Marziani, P., Sulentic, J. W., Zwitter, T., Dultzin-Hacyan, D., & Calvani, M. 2001, ApJ, 558, 553
- Marziani et al. (2003c) Marziani, P., Zamanov, R. K., Sulentic, J. W., & Calvani, M. 2003c, MNRAS, 345, 1133
- Mathews (1993) Mathews, W. G. 1993, ApJL, 412, L17
- Mathews & Ferland (1987) Mathews, W. G., & Ferland, G. J. 1987, ApJ, 323, 456
- Mathur (2000) Mathur, S. 2000, MNRAS, 314, L17
- Matsuoka et al. (2008) Matsuoka, Y., Kawara, K., & Oyabu, S. 2008, ApJ, 673, 62
- Matsuoka et al. (2007) Matsuoka, Y., Oyabu, S., Tsuzuki, Y., & Kawara, K. 2007, ApJ, 663, 781
- Morris & Ward (1989) Morris, S. L., & Ward, M. J. 1989, ApJ, 340, 713
- Negrete et al. (2010) Negrete, C. A., Dultzin, D., Marziani, P., & Sulentic, J. W. 2010, ApJ, submitted
- Netzer et al. (1995) Netzer, H., Brotherton, M. S., Wills, B. J., Han, M., Wills, D., Baldwin, J. A., Ferland, G. J., & Browne, I. W. A. 1995, ApJ, 448, 27
- Netzer & Marziani (2010) Netzer, H., & Marziani, P. 2010, ArXiv e-prints, 2010arXiv1006.3553N, ApJ submitted
- Peterson & Ferland (1986) Peterson, B. M., & Ferland, G. J. 1986, Nature, 324, 345
- Peterson et al. (2004) Peterson, B. M., et al. 2004, ApJ, 613, 682
- Punsly (2010) Punsly, B. 2010, ApJ, 713, 232
- Rafanelli & Marziani (1992) Rafanelli, P., & Marziani, P. 1992, AJ, 103, 743
- Richards et al. (2002) Richards, G. T., Vanden Berk, D. E., Reichard, T. A., Hall, P. B., Schneider, D. P., SubbaRao, M., Thakar, A. R., & York, D. G. 2002, AJ, 124, 1
- Sanders et al. (1988) Sanders, D. B., Soifer, B. T., Elias, J. H., Madore, B. F., Matthews, K., Neugebauer, G., & Scoville, N. Z. 1988, ApJ, 325, 74
- Sani et al. (2010) Sani, E., Lutz, D., Risaliti, G., Netzer, H., Gallo, L. C., Trakhtenbrot, B., Sturm, E., & Boller, T. 2010, MNRAS, 403, 1246
- Sargent et al. (1989) Sargent, W. L. W., Steidel, C. C., & Boksenberg, A. 1989, ApJS, 69, 703
- Schlegel et al. (1998) Schlegel, D. J., Finkbeiner, D. P., & Davis, M. 1998, ApJ, 500, 525
- Shang et al. (2007) Shang, Z., Wills, B. J., Wills, D., & Brotherton, M. S. 2007, AJ, 134, 294
- Shapovalova et al. (2010) Shapovalova, A. I., Popović, L. Č., Burenkov, A. N., Chavushyan, V. H., Ilić, D., Kovačević, A., Bochkarev, N. G., & León-Tavares, J. 2010, A&Ap, 509, A106
- Shemmer et al. (2004) Shemmer, O., Netzer, H., Maiolino, R., Oliva, E., Croom, S., Corbett, E., & di Fabrizio, L. 2004, ApJ, 614, 547
- Shen & Loeb (2009) Shen, Y., & Loeb, A. 2009, ArXiv e-prints, arXiv0912.0541S
- Shields et al. (1995) Shields, J. C., Ferland, G. J., & Peterson, B. M. 1995, ApJ, 441, 507
- Small et al. (1997) Small, T. A., Sargent, W. L. W., & Steidel, C. C. 1997, AJ, 114, 2254
- Snedden & Gaskell (2007) Snedden, S. A., & Gaskell, C. M. 2007, ApJ, 669, 126
- Strateva et al. (2003) Strateva, I. V., et al. 2003, AJ, 126, 1720
- Sulentic (1989) Sulentic, J. W. 1989, ApJ, 343, 54
- Sulentic et al. (2007) Sulentic, J. W., Bachev, R., Marziani, P., Negrete, C. A., & Dultzin, D. 2007, ApJ, 666, 757
- Sulentic & Marziani (1999) Sulentic, J. W., & Marziani, P. 1999, ApJL, 518, L9
- Sulentic et al. (2000a) Sulentic, J. W., Marziani, P., & Dultzin-Hacyan, D. 2000a, ARA&A, 38, 521
- Sulentic et al. (2002) Sulentic, J. W., Marziani, P., Zamanov, R., Bachev, R., Calvani, M., & Dultzin-Hacyan, D. 2002, ApJL, 566, L71
- Sulentic et al. (2000b) Sulentic, J. W., Marziani, P., Zwitter, T., Dultzin-Hacyan, D., & Calvani, M. 2000b, ApJL, 545, L15
- Sulentic et al. (2006) Sulentic, J. W., Repetto, P., Stirpe, G. M., Marziani, P., Dultzin-Hacyan, D., & Calvani, M. 2006, A&Ap, 456, 929
- Sulentic et al. (2004) Sulentic, J. W., Stirpe, G. M., Marziani, P., Zamanov, R., Calvani, M., & Braito, V. 2004, A&Ap, 423, 121
- Sulentic et al. (2008) Sulentic, J. W., Zamfir, S., Marziani, P., & Dultzin, D. 2008, in Revista Mexicana de Astronomia y Astrofisica Conference Series, Vol. 32, Revista Mexicana de Astronomia y Astrofisica Conference Series, 51–58
- Sulentic et al. (2000c) Sulentic, J. W., Zwitter, T., Marziani, P., & Dultzin-Hacyan, D. 2000c, ApJL, 536, L5
- Turler & Courvoisier (1997) Turler, M., & Courvoisier, T. 1997, in Astronomical Society of the Pacific Conference Series, Vol. 113, IAU Colloq. 159: Emission Lines in Active Galaxies: New Methods and Techniques, ed. B. M. Peterson, F.-Z. Cheng, & A. S. Wilson, 191
- Tytler & Fan (1992) Tytler, D., & Fan, X.-M. 1992, ApJS, 79, 1
- Vanden Berk et al. (2001) Vanden Berk, D. E., et al. 2001, AJ, 122, 549
- Vestergaard & Peterson (2006) Vestergaard, M., & Peterson, B. M. 2006, ApJ, 641, 689
- Vestergaard & Wilkes (2001) Vestergaard, M., & Wilkes, B. J. 2001, ApJS, 134, 1
- Wang et al. (2009) Wang, J., et al. 2009, ApJ, 707, 1334
- Wang et al. (1996) Wang, T., Brinkmann, W., & Bergeron, J. 1996, A&Ap, 309, 81
- Wilkes (1986) Wilkes, B. J. 1986, MNRAS, 218, 331
- Wills et al. (1995) Wills, B. J., et al. 1995, ApJ, 447, 139
- Young et al. (1982) Young, P., Sargent, W. L. W., & Boksenberg, A. 1982, ApJS, 48, 455
- Zamfir et al. (2008) Zamfir, S., Sulentic, J. W., & Marziani, P. 2008, MNRAS, 387, 856
- Zamfir et al. (2010) Zamfir, S., Sulentic, J. W., Marziani, P., & Dultzin, D. 2010, MNRAS, 403, 1759
- Zhang et al. (2009) Zhang, X., Dultzin, D., Wang, T., & Kauffmann, G. 2009, MNRAS, 397, 1510
- Zheng (1992) Zheng, W. 1992, ApJ, 385, 127


Appendix A Notes on Individual Sources
I Zw 1
is the prototypical NLSy1 source. Its UV spectrum has been analyzed in detail by many workers, notably Laor et al. (1997b). The Mgii2800 fit shows residuals that may be indicating an excess Feii emission around 2820 Å.
Mark 478
is spectroscopically rather similar to I Zw 1, with less extreme properties. The very low Civ1549 BC intensity value may in part due to a narrow absorption close to the systemic velocity.
Mark 335
belongs to bin A1. Its spectrum is consistent with the median spectrum of the bin, with low , weak blueshifted component. The profile of H is well described by a Lorentzian function, making this object similar to the rest of Pop. A even if is as low as in Pop. B.
Fairall 9
is a rather typical B1 source, with a relatively modest but appreciable VBC. The Aliii1860/ Siiii]1892 and Siiii]1892/Civ1549 ratios, along with 1, suggest some metal enrichment above solar.
3C 249.1
is a lobe-dominated radio source. It shares many of the properties of several radio-loud quasars at higher redshift, notably the strong Civ1549NC, and the shape of the Ly and of the Civ1549+Heii1640 blend.
3C 110
Some quasars show lines with strong VBC emission that can be mistaken for a BC (Sulentic et al., 2000c, e.g. PG1416-129). The correct interpretation for 3C110 may involve a single redshifted VBC component. The BC may be completely absent, as there is no Feii detection with the present data. This suggestion is also motivated by an analysis of 3C390.3 (Negrete et al., 2010) which is a lobe-dominated RL quasar like 3C110. Physical conditions inferred for the BC of 3C 390.3 are similar to those of the VBC implying that there may be no BC in 3C 390.3. If the BC is completely suppressed in 3C110 then the entire Civ1549 profile in that source may be VBC. A fit with a single, shifted Gaussian is worse than the one shown in Fig. 2, but not dramatically so. Then shift and FWHM values for a pure VBC Civ1549 in 3C110 would be close to the canonical values (103 and 104 km s-1 respectively) for the VBC component in H. The spectrum of this object does lack a blueshifted component which might be closely associated to the BC.