The Accreting White Dwarf in SS Cygni Revealed11affiliation: Based on observations made with the NASA/ESA Hubble Space Telescope, obtained at the Space Telescope Science Institute, which is operated by the Association of Universities for Research in Astronomy, Inc. under NASA contract NAS5-26555, and the NASA-CNES-CSA Far Ultraviolet Spectroscopic Explorer, which is operated for NASA by the Johns Hopkins University under NASA contract NAS5-32985.
Abstract
We have carried out a combined Hubble Space Telescope (HST/GHRS) and Far Ultraviolet Spectroscopic Explorer (FUSE) analysis of the prototype dwarf nova SS Cygni during quiescence. The FUSE and HST spectra were obtained at comparable times after outburst and have matching flux levels where the two spectra overlap. In our synthetic spectral analysis, we have used SS Cygni’s accurate HST FGS parallax giving pc, a newly determined mass for the accreting white dwarf (Bitner et al., 2007) of (lower than the previous, widely used ) and the reddening () values 0.04 (Verbunt, 1987; La Dous, 1991) & 0.07 (Bruch & Engel, 1994) derived from the 2175 Å absorption feature in the IUE LWP spectra. From the best-fit model solutions to the combined HST + FUSE spectral energy distribution, we find that the white dwarf is reaching a temperature K in quiescence, assuming with a solar composition accreted atmosphere. The exact temperature of the WD depends on the reddening assumed and on the inclusion of a quiescent low mass accretion rate accretion disk. Accretion disk models alone fit badly in the FUSE range while, and if we take the distance to be a free parameter, the only accretion disk model which fits well is for a discordant distance of at least several hundred pc and an accretion rate (/yr) which is unacceptably high for a dwarf nova in quiescence. We discuss the implications of the white dwarf’s temperature on the time-averaged accretion rate and long term compressional heating models.
1 Introduction
SS Cygni is a prototype dwarf nova, a subclass of the cataclysmic variable group of binary stars. Cataclysmic variables contain a white dwarf and a larger radius, less massive, donor star. The donor star fills its Roche lobe and its matter has gradually been cannibalized by the white dwarf. In dwarf novae the matter feeds into a disk around the white dwarf and continues to build up the disk mass until the disk reaches a critical temperature at which time the mass collapses onto the white dwarf and releases gravitational potential energy as radiation. This results in a roughly periodic increase in brightness of the system.
SS Cyg is one of the best-studied dwarf novae. It has an orbital period of 6.6 hr (well above the period gap) and a day recurrence time between dwarf nova outbursts (Cannizzo & Mattei, 1992; Cannizzo, 1993). These factors and its well-studied history have made it a key target of our ongoing studies to understand how disk accretion affects the white dwarf. Observations must be taken when the system is in quiescence because in such a state, the disk is least luminous which offers a favorable opportunity to detect the radiation of the white dwarf photosphere. However, the source of far ultraviolet light during the quiescence of dwarf novae remains controversial. This is especially true in dwarf novae with orbital periods above the CV period gap, which tend to have higher mass transfer rates, larger accretion disks and more massive secondary stars. Therefore, during quiescence it is possible that some portions of the remaining disk may still be optically thick and dominate the far ultraviolet (FUV) flux of the system.
The inclination of its orbit is (Bitner et al., 2007) while its white dwarf mass has been reported to be (Shafter, 1983) and secondary mass . The system has an accurate parallax measured with the Hubble Space Telescope fine guidance sensor (Harrison et al., 2000) yielding a parallax distance of pc. Holm & Polidan (1988) first noted the possible detection of the underlying accreting white dwarf from the occasional appearence of Ly absorption in some IUE spectra obtained during quiescence. However, despite a number of attempts to measure the white dwarf’s temperature and quantify its contribution to the FUV flux, the uncertain contribution of the accretion disk and other possible unidentified source(s) of FUV emission, the ”second component”, rendered any such measurements suspect (Holm, 1988; Lesniak & Sion, 2003; Long et al., 2005).
Recently however, we retrieved archival FUSE and HST spectra, both obtained during different quiescent intervals of SS Cygni but with closely matching flux levels in the wavelength range where HST/GHRS and FUSE overlap ( Å ). Also a new mass determination for the white dwarf has now been derived by Bitner et al. (2007): , significantly lower than the earlier value of . Using this lower mass and the parallax distance of 166 pc, we have reexamined the nature of the hot component with synthetic spectral models of high gravity photospheres and optically thick accretion disks. This assessment is presented below.
In the next section we give details of the archival spectra, in section 3 we present our spectal modeling tools and method, results are presented in section 4 and discussed in the concluding section.
2 Archival Observations
The archival HST GHRS spectrum was taken on JD 2450352 (1996 September 26), in mid-quiescence, 17 days after SS Cygni reached quiescence and 21 days after the previous outburst. The HST spectrum is a combination of two individual spectral segments Z3DV0204T (1150 Å- 1435 Å) and Z3DV0205T (1377 Å- 1663 Å) taken in ACCUM mode with the GHRS spectrograph with the G140L grating and LSA aperture (of size 1.74”). The two spectral segments, one at each grating setting, had an exposure time of 2176s each, and there was a 32.25 second time gap in an otherwise nominal exposure. The GHRS observations were calibrated using the standard pipeline CALHRS, and were retrieved as VO-Tables using VOSpec.
The archival FUSE spectrum was taken on JD 2452156.5 (2001 September 4), 18 days after the previous outburst, and 13 days after the system first entered quiescence. The FUSE spectrum (P2420101), was a combined spectrum of 8 separate exposures taken through the 30”x30” LWRS Large Square Aperture in TIME Tag mode. The total good exposure time was ks, varying slightly for each spectral channel. The observations were carried out mostly during NIGHT time. The FUSE observations were processed with CalFUSE version v3.2.3 (Dixon et al., 2007). We follow the same procedure we used previously for the postprocessing (co-addition, alignment and weight of the spectral channels) of the FUSE data (see e.g. Godon et al. (2006)).
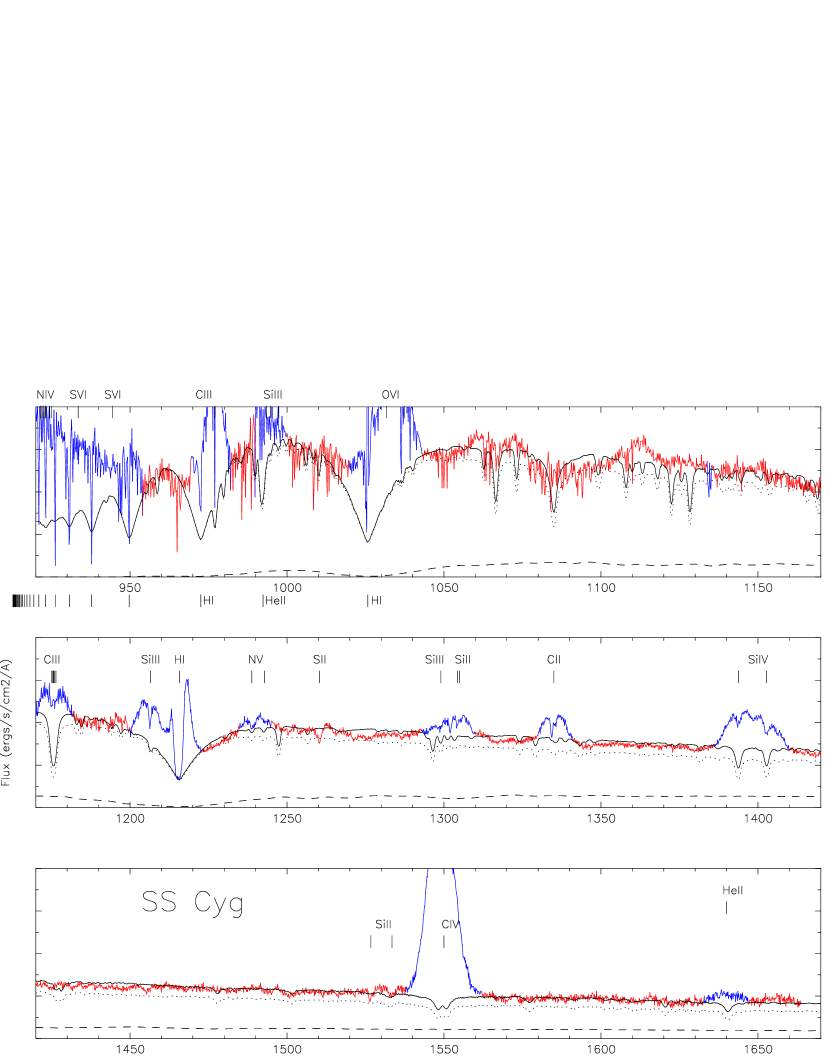
The combined FUSE + GHRS spectrum of SS Cyg is presented in Fig.1 (see section 4 for the model fit). The spectrum is characterized by strong emission lines originating in an optically thin region in the disk or above it, as inferred from their rotational broadening (see Long et al. (2005) for a rigourous analysis of these lines in the GHRS spectra). In the very short wavelengths of FUSE the broad emission lines from N iv, S vi and H i (Ly and higher) merge together and produced an apparent rise of flux ( Å), which we do not attempt to model. In the fitting (section 4) we mask all the emission lines and these appear in blue in Fig.1. It is likely that around 1060-1080 Å and 1110-1120 Å some additional emission is present.
3 Synthetic Spectral Modeling
We adopted model accretion disks from the optically thick disk model grid of Wade & Hubeny (1998). In these accretion disk models, the innermost disk radius, , is fixed at a fractional white dwarf radius of . The outermost disk radius, Rout, was chosen so that is near 10,000 K since disk annuli beyond this point, which are cooler zones with larger radii, would provide only a very small contribution to the mid and far UV disk flux, particularly the FUV bandpass ( Å). The mass transfer rate is assumed to be the same for all radii.
Theoretical, high gravity, photospheric spectra were computed by first using the code TLUSTY (Hubeny, 1988) to calculate the atmospheric structure and SYNSPEC (Hubeny & Lanz, 1995) to construct synthetic spectra. We compiled a library of photospheric spectra covering the temperature range from 15,000 K to 70,000 K in increments of 1000 K, and a surface gravity range, , in increments of 0.2 in .
The reddening of the system was taken from estimates listed in the literature, determined from the strength of the 2200 Å interstellar absorption feature. Verbunt (1987) and La Dous (1991) both give E(B-V)=0.04 while the more recent work of Bruch & Engel (1994) gives E(B-V)=0.07. Both values are much smaller than the galactic reddening in the direction of SS Cyg which is pretty large () in agreement with the fact that SS Cyg is rather nearby with a distance of only 166 pc. The combined spectrum was de-reddened with the IUERDAF IDL routine UNRED assuming both E(B-V)=0.04 and E(B-V)=0.07.
After masking emission lines in the spectra, we determined separately for each spectrum, the best-fitting white dwarf-only models and the best-fitting disk-only models using a minimization routine. A value and a scale factor were computed for each model fit. The scale factor, , normalized to a kiloparsec and solar radius, can be related to the white dwarf radius R through:
and is the distance to the source. For the white dwarf radii, we use the mass-radius relation from the evolutionary model grid of Wood (1995) for C-O cores. We combined white dwarf models and accretion disk models using a minimization routine called DISKFIT. Using this method the best-fitting composite white dwarf plus disk model is determined based upon the minimum value achieved, visual inspection of the model, consistence with the continuum slope and Ly region, and consistence of the scale factor-derived distance with the adopted trigonometric parallax distance.
4 Synthetic Spectral Fitting Results
We used an accretion disk model, a white dwarf photosphere, and a combination of both in our analysis. The disk models used were optically thick, steady state accretion models with solar abundances. They are considered a reasonable first approximation to the spectral shape of the disk in quiescence. In the disk models, we first adopted an inclination of and directly from the grid of models of Wade & Hubeny (1998). Only after a satisfactory best fit was obtained with the correct (parallax) distance, did we then generate disk models (using TLUSTY, SYNSPEC and DISKSYN) with an inclination of , closer to its derived value of (Bitner et al., 2007). The photosphere models were generated using TLUSTY and SYNSPEC. In the following we used the parallax distance of 166 pc, and the mass of () (Bitner et al., 2007). We assumed reddening values of E(B-V) = 0.04 and 0.07. A summary of the model fits is given in Table 1.
We started our fitting with single accretion disk models alone assuming both E(B-V)=0.04 & 0.07. We ran disk model fits and found that the best fit (lowest ) had a mass accretion rate far too large for quiescence and a distance much larger than 166 pc.
Next, we tried single white dwarf atmosphere models, first dereddening assuming E(B-V)=0.04. Since almost all the lines are in emission (possibly from an optically thin region in the disk and/or corona), it makes it difficult to assess the rotational velocity broadening and chemical abundances based on the absorption lines. Nevertheless, for all WD models we assumed solar abundances and a canonical projected rotational velocity of 200 km/s, and checked that the value of the did not depend on as long as it was a few hundred km/s. The best fit least WD model has a temperature K and , but with a distance of only 138 pc. A model with K gave the right distance with a slightly larger , namely 1.990. Next we ran single WD model fits assuming E(B-V)=0.07. The we obtained increased slightly over the E(B-V)=0.04 best fit models.
Last, we explored whether the fitting could be improved if we combined a white dwarf model with an accretion disk model. We found that some of the white dwarf plus disk combinations yielded distances close to 166 pc with a lower . We have summarized some of these combination fits in Table 1. For E(B-V)=0.04, the best WD+disk fit leading to a distance in agreement with observed parallax is for a WD with K, a disk with a mass accretion rate /yr, , where the WD contributes 88% of the flux and the disk contributes the remaining 12%. This model fit is presented in Figure 1. We then carried out the same fitting but this time assuming E(B-V)=0.07 and found similar results for the disk but with a higher WD temperature: K.
Therefore, we conclude that the dominant source of the far UV radiation between 912 Å and 1660 Å is an accretion-heated white dwarf photosphere with K, (depending on the reddening value).
5 Conclusions
We have presented evidence from our model fitting analysis of the combined FUSE + HST/GHRS spectrum of SS Cyg during quiescence that the source of the far ultraviolet continuum and absorption line radiation is the white dwarf’s photosphere. The disk models that best fit the spectral data yield unreasonably large distances, at odds with the HST FGS parallax and indicate accretion rates far too high to be associated with dwarf nova quiescence. The photosphere models give effective temperatures of 45,000 to 55,000 K for a reddening of 0.04 and 0.07 with the inclusion of a low mass accretion rate disk in agreement with the quiescent state. Unfortunately, the lack of a clear detection of absorption lines due to accreted metals and helium in the WD atmosphere prevents a determination of both the rotational velocity of the white dwarf and the abundance of metals in its accreted atmosphere.
Our derived temperature for the white dwarf in SS Cygni is well above the presently estimated average temperature (30,000 K) for white dwarfs in dwarf novae above the CV period gap. Compared with the temperatures of white dwarfs in dwarf novae whose orbital periods are close to the period of SS Cygni, the white dwarf in TT Crt is cooler (40,000 K; (Sion et al., 2008)) while the white dwarf in Z Cam is hotter (57,000 K; (Hartley et al., 2005)). If the accretion rate scales with the orbital period, then the temperatures should be comparable. It is interesting that the white dwarfs in dwarf novae with mins are cooler than 40,000 K while the hottest white dwarfs in dwarf novae are found at mins.
At h, the of the WD in SS Cygni lies within the range expected from compressional heating for an average , , obtained from typical interrupted magnetic braking laws for white dwarf masses between and (Townsley & Gänsicke, 2009). A linear extrapolation to , of the predicted for h, corresponds to an average mass transfer rate of /yr which is at the high end of the range of mass transfer rates associated with the nova-like variables, as determined from their optical disk luminosities (Warner, 1995). Interestingly, the braking laws of Andronov et al. (2003) and Ivanova & Taam (2004) either fall drastically short or exhibit a downturn, respectively, of yielding the implied by the WD , while the Howell et al. (2001) law steeply increases at constant h. One cannot rule that other significant sources of heating of the white dwarf besides compression are operating such as possible nuclear burning. It seems clear that more white dwarf temperatures are needed in dwarf novae and nova-like variables at long before definitive conclusions can be drawn.
6 acknowledgements
We thank an anonymous referee for useful comments. PG thanks the Henry A. Rowland Department of Physics and Astronomy at the Johns Hopkins University for hospitality. This work was supported in part by NSF grant AST-0807892 to Villanova University, a Villanova Undergraduate Research Grant. Support for this work was also provided by NASA through grant number HST-AT-10657.01 to Villanova University from the Space Telescope Science Institute, which is operated by the Association of Universities for Research in Astronomy, Incorporated, under NASA contract NAS5-26555. Additional support was provided by the National Aeronautics and Space Administration (NASA) under Grant number NNX08AJ39G issued through the office of Astrophysics Data Analysis Program (ADP) to Villanova University.
References
- Andronov et al. (2003) Andronov, N., Pinsonneault, M., & Sills, A. 2003, ApJ, 582, 358
- Bitner et al. (2007) Bitner, M.A., Robinson, E.L., & Behr, B.B. 2007, ApJ, 662, 564
- Bruch & Engel (1994) Bruch, A., & Engel, A. 1994, A&A, 104, 79
- Cannizzo (1993) Cannizzo, J. 1993, ApJ, 419, 318
- Cannizzo & Mattei (1992) Cannizzo, J. K., & Mattei, J. A. 1992, ApJ, 401, 642
- Dixon et al. (2007) Dixon, W.V., et al. 2007, PASP, 119, 527
- Godon et al. (2006) Godon, P., Seward, L., Sion, E.M., & Szkody, P. 2006, AJ, 131, 2634
- Harrison et al. (2000) Harrison, T. E., McNamara, B. J., Szkody, P., & Gilliland, R. L. 2000, AJ, 120, 2649
- Hartley et al. (2005) Hartley, L.E., Long, K.S., Froning, C.S., & Drew, J.E. 2005, ApJ, 623, 425
- Holm (1988) Holm, A. V. 1988, in ESA, A Decade of UV Astronomy with the IUE Satellite, ed. E. J. Rolf (ESA SP-281; Paris: ESA), 229
- Holm & Polidan (1988) Holm, A. V., & Polidan, R. S. 1988, in ESA, A Decade of UVAstronomy with the IUE Satellite, ed. E. J. Rolf (ESA SP-281; Paris: ESA), 179
- Howell et al. (2001) Howell, S.B., Nelson, L.A., & Rappaport, S. 2001, ApJ, 550, 897
- Hubeny (1988) Hubeny, I. 1988, Comput. Phys. Comm., 52, 103
- Hubeny & Lanz (1995) Hubeny, I., and Lanz, T. 1995, ApJ, 439, 875
- Ivanova & Taam (2004) Ivanova, N., & Taam, R.E. 2004, ApJ, 601, 1058
- La Dous (1991) La Dous, C. 1991, A&A, 252, 100
- Lesniak & Sion (2003) Lesniak, M.V., & Sion, E.M. 2003, AAS, 203, 4412
- Long et al. (2005) Long, K.S., Froning, C.S., Knigge, C., Blair, W.P., Kallman, T.R., Ko, Y.-K. 2005, ApJ, 630, 511
- Shafter (1983) Shafter, A. 1983, Ph.D Thesis, UCLA.
- Sion et al. (2008) Sion, E.M., et al. 2008, ApJ, 681, 543
- Townsley & Gänsicke (2009) Townsley, D. & Gänsicke, B.T. 2009, ApJ, 693, 1007
- Verbunt (1987) Verbunt, F. 1987, A&A, 71, 339
- Wade & Hubeny (1998) Wade, R.A., & Hubeny, I. 1998, ApJ, 509, 350
- Warner (1995) Warner, B. 1995, Cataclysmic Variable Stars (cambridge: Cambridge University Press)
- Wood (1995) Wood, M. 1995, in White Dwarfs, Proceedings of the 9th European Workshop on White Dwarfs Held at Kiel, Germany, 29 August - 1 September 1994. Lecture Notes in Physics, Vol.443, edited by Detlev Koester & Klaus Werner. Springer-Verlag, Berlin, Heidelberg, New York, 1995, p.41
| (WD) | WD(%) | disk(%) | E(B-V) | ||||
|---|---|---|---|---|---|---|---|
| -8.0 | 41 | — | 1.331 | 862 | — | 100 | 0.04 |
| -8.0 | 60 | — | 1.227 | 629 | — | 100 | 0.04 |
| -9.0 | 41 | — | 1.989 | 308 | — | 100 | 0.04 |
| -9.0 | 60 | — | 2.690 | 216 | — | 100 | 0.04 |
| -9.5 | 41 | — | 6.477 | 157 | — | 100 | 0.04 |
| -9.5 | 50 | — | 8.036 | 142 | — | 100 | 0.04 |
| -9.5 | 60 | — | 9.122 | 106 | — | 100 | 0.04 |
| -8.0 | 41 | — | 1.615 | 741 | — | 100 | 0.07 |
| -8.0 | 60 | — | 1.810 | 541 | — | 100 | 0.07 |
| -9.0 | 41 | — | 3.562 | 265 | — | 100 | 0.07 |
| -9.0 | 60 | — | 4.754 | 186 | — | 100 | 0.07 |
| — | — | 40,000 | 1.637 | 138 | 100 | — | 0.04 |
| — | — | 47,000 | 1.990 | 167 | 100 | — | 0.04 |
| — | — | 46,000 | 1.451 | 139 | 100 | — | 0.07 |
| — | — | 55,000 | 1.600 | 164 | 100 | — | 0.07 |
| -10.5 | 50 | 41,000 | 1.490 | 143 | 97.6 | 2.4 | 0.04 |
| -10 | 50 | 46,000 | 1.258 | 173 | 88.0 | 12.0 | 0.04 |
| -9.5 | 50 | 55,000 | 1.255 | 233 | 66.3 | 33.7 | 0.04 |
| -10.5 | 50 | 49,000 | 1.429 | 149 | 98.4 | 1.6 | 0.07 |
| -10 | 50 | 55,000 | 1.385 | 172 | 91.0 | 9.0 | 0.07 |
| -9.5 | 50 | 70,000 | 1.630 | 222 | 72.4 | 27.6 | 0.07 |