11email: carina.persson@chalmers.se 22institutetext: Centro de Astrobiologìa, CSIC-INTA, 28850, Madrid, Spain 33institutetext: Depts. of Physics, Ohio State Univ. USA44institutetext: Depts. of Physics, Astronomy & Chemistry, Ohio State Univ. USA55institutetext: LERMA, CNRS, Observatoire de Paris and ENS, France 66institutetext: California Institute of Technology, Cahill Center for Astronomy and Astrophysics 301-17, Pasadena, CA 91125, USA 77institutetext: Centre d’etude Spatiale des Rayonnements (CESR), Universite de Toulouse [UPS], 31062 Toulouse Cedex 9, France and 88institutetext: CNRS/INSU, UMR 5187, 9 avenue du Colonel Roche, 31028 Toulouse Cedex 4, France 99institutetext: JPL, California Institute of Technology, Pasadena, USA1010institutetext: Nicolaus Copernicus University, Toruń, Poland 1111institutetext: Tata Institute of Fundamental Research, Homi Bhabha Road, Mumbai 400005, India1212institutetext: The Johns Hopkins University, Baltimore, MD 21218, USA 1313institutetext: I. Physikalisches Institut, University of Cologne, Germany 1414institutetext: Institut d’Astrophysique Spatiale (IAS), Orsay, France 1515institutetext: Gemini telescope, Hilo, Hawaii, USA 1616institutetext: LAM, OAMP, Université Aix-Marseille & CNRS, Marseille, France1717institutetext: Laboratoire d’Astrophysique de Grenoble, France1818institutetext: Institute of Physical Chemistry, PAS, Warsaw, Poland 1919institutetext: Nicolaus Copernicus Astronomical Center, Toruń, Poland 2020institutetext: MPI für Radioastronomie, Bonn, Germany2121institutetext: Dept. of Physics & Astronomy, University of Calgary, Canada2222institutetext: European Space Astronomy Centre, ESA, Madrid, Spain 2323institutetext: Institut de Radioastronomie Millimetrique, IRAM, 300 rue de la Piscine, F-38406 St Martin d’Heres 2424institutetext: Institute Universite de Bordeaux, Laboratoire d’Astrophysique de Bordeaux, 33000 Bordeaux, France and CNRS/INSU, UMR 5804, B.P. 89, 33271 Floirac cedex, France 2525institutetext: Centre d’etude Spatiale des Rayonnements (CESR), Universite de Toulouse [UPS], 31062 Toulouse Cedex 9, France 2626institutetext: Infrared Processing and Analysis Center, California Institute of Technology, MS 100-22, Pasadena, CA 91125 2727institutetext: Observatorio AstronŃacional (IGN) and Atacama Large Millimeter/Submillimeter Array, Joint ALMA Office, Santiago, Chile
Nitrogen hydrides in interstellar gas
The HIFI instrument on board the Herschel Space Observatory has been used to observe interstellar nitrogen hydrides along the sight-line towards G10.60.4 in order to improve our understanding of the interstellar chemistry of nitrogen. We report observations of absorption in NH , and -NH2 . We also observed -NH3 , and , -NH3 , and searched unsuccessfully for NH+. All detections show emission and absorption associated directly with the hot-core source itself as well as absorption by foreground material over a wide range of velocities. All spectra show similar, non-saturated, absorption features, which we attribute to diffuse molecular gas. Total column densities over the velocity range 11 – 54 km s-1 are estimated. The similar profiles suggest fairly uniform abundances relative to hydrogen, approximately , , and for NH, NH2, and NH3, respectively. These abundances are discussed with reference to models of gas-phase and surface chemistry.
Key Words.:
ISM: abundances – ISM: molecules – Submillimetre: ISM – Molecular processes – Line: formation – Astrochemistry1 Introduction
Molecular hydrides are important in the chemistry of the interstellar medium since they often appear in the first steps in chains of reactions that lead to other more complex species. The production pathways of nitrogen-bearing molecules are still rather uncertain since key species, such as NH+, NH, and NH2 have not been widely observed. Even the first identified polyatomic interstellar molecule, ammonia (NH3), has been widely observed mainly in its para symmetry form, which leaves its formation mechanism poorly constrained in the diffuse molecular gas. Both gas-phase chemistry and grain surface reactions have been proposed as formation mechanisms, but clearly more observations are needed for a better understanding.
Both NH and NH2 are well known in comets (e.g. Swings et al. 1941; Meier et al. 1998; Feldman et al. 1993), and have been observed in stellar photospheres (e.g. Schmitt 1969; Farmer & Norton 1989) via their electronic, vibration-rotation, and high rotational transitions. Interstellar NH was first detected in the interstellar medium by Meyer & Roth (1991) by optical absorption spectroscopy. Subsequent observations by Crawford & Williams (1997) and Weselak et al. (2009) have yielded six lines of sight where column densities of both NH and H2 are directly measured. The average value of the column density ratio in these diffuse and translucent sightlines is . Interstellar NH2 was first observed by van Dishoeck et al. (1993) in absorption towards Sgr B2 in three fine-structure components of the -NH2 transition with partially resolved hyperfine structure at frequencies 461 to 469 GHz. Further absorption lines of both and forms of NH2 and NH were observed through use of the long-wavelength spectrometer aboard the Infrared Space Observatory (ISO: Cernicharo et al. 2000; Goicoechea et al. 2004; Polehampton et al. 2007). The ISO observations were unable to resolve the hyperfine structure of either molecule. Ammonia, NH3, was the first polyatomic molecule to be identified in interstellar space (Cheung et al. 1968) by means of its microwave inversion transitions. Although NH3 has been widely observed in dark clouds and star-forming regions, there have been very few measurements of the inversion lines in the diffuse interstellar gas (Nash 1990; Liszt et al. 2006).
With the unique capabilities of Herschel Space Observatory (Pilbratt et al. 2010) transitions between 157 and 625 m (0.48 – 1.9 THz) are available with the Heterodyne Instrument for the Far-Infrared (HIFI; de Graauw et al. 2010) with very high sensitivity. This allows searches for spectrally resolved, ground-state rotational transitions of NH+, NH, NH2, and NH3 with the same instrument. Abundances of these species are key diagnostics for the nitrogen chemistry.
The most sensitive and model-independent method for measuring column densities of interstellar molecules is high-resolution absorption line spectroscopy, which is being exploited by the Herschel PRISMAS key programme (PRobing InterStellar Molecules with Absorption line Studies). This paper presents the first observations and analysis of nitrogen hydrides along the sight-line towards the massive star-forming region G10.60.4 (W31C) as a part of the PRISMAS program. Observations of interstellar absorption towards seven additional submillimetre-wave continuum sources will be presented and analysed in later publications.
The ultra-compact HII region G10.60.4 in the star-forming W31 complex is an extremely luminous submillimetre and infrared continuum source. The source is located within the so-called 30 km s-1 arm at a kinematic distance of 4.8 kpc (Fish et al. 2003). The gas associated directly with G10.60.4 is detected in the velocity range to km s-1, while the foreground gas along the line of sight is detected at to 55 km s-1. The focus of this paper is on the diffuse interstellar gas traced by the absorption lines.
2 Observations
The observations, which took place in March 2010, are summarised in Table LABEL:Table:_transitions. The 20-10 and 21-11 NH3 transitions were observed in the same band. We used the dual beam switch mode and the wide band spectrometer (WBS) with a bandwidth of 4 GHz and an effective spectral resolution of 1.1 MHz. The corresponding velocity resolution is about 0.3 km s-1 at the higher frequencies and 0.6 km s-1 at 572 GHz. In addition, simultaneous observations were performed using the high- resolution spectrometer (HRS) with an effective spectral resolution of 0.25 MHz ( km s-1) and a bandwidth of 230 MHz. Three observations were carried out with different frequency settings of the local oscillator (LO) corresponding to a change of approximately 15 km s-1 to determine the sideband origin of the lines. Two orthogonal polarisations were used during all observations.
| Species | Frequencya | Bandb | Transition | ||
|---|---|---|---|---|---|
| (GHz) | (K) | (s) | |||
| NH+ | 1 012.540 | 4a | 385 | 47 | = 3/2 1/2 |
| NH | 974.478 | 4a | 339 | 30 | |
| -NH2 | 952.578 | 3b | 230 | 15 | – |
| - NH3 | 572.498 | 1b | 83 | 276 | 10-00 |
| 1 214.859 | 5a | 1 012 | 49 | 20-10 | |
| - NH3 | 1 215.245 | 5a | 1 012 | 49 | 21-11 |
-
aThe NH and NH2 frequencies refer to the strongest hyperfine structure component. bHIFI consists of 7 different mixer bands and two double sideband spectrometers. All transitions were observed in the upper sideband except NH+. cSystem temperature. dThe on-source time for each integration.

The half-power beam width of the telescope is 37, 22, and 17″ at 572, 953, and 1 215 GHz, respectively. Pointing was centered at R.A. = 181028 70, Dec. = 19 55 50 (2000). The reference beams were located 3′ on either side of the source and the calibration is described by Roelfsema (2010).
We have used the standard Herschel pipeline to Level 2 which provides fully calibrated spectra. The data were first analysed using Herschel interactive processing environment (HIPE111HIPE is a joint development by the Herschel Science Ground Segment Consortium, consisting of ESA, the NASA Herschel Science Center, and the HIFI, PACS and SPIRE consortia.; Ott 2010) version 2.4, and in parallel we also used the software package xs222Developed by Per Bergman at Onsala Space Observatory, Sweden; http://www.chalmers.se/rss/oso-en/observations/. The data quality is excellent with very low intensity ripples, two polarisations that are in agreement to better than 10%, and very good agreement between the three LO-tunings without contamination from the image sideband. We thus average the three LO-tunings and both polarisations in both spectra, except for NH3 at 572 GHz and NH+ which display ripples in the V- and H-polarisation, respectively, and were therefore not included. The resulting rms noise is 11, 120, 50, 51, and 74 mK for NH3 at 572 and 1215 GHz, for NH, NH2, and NH+, respectively.
3 Results
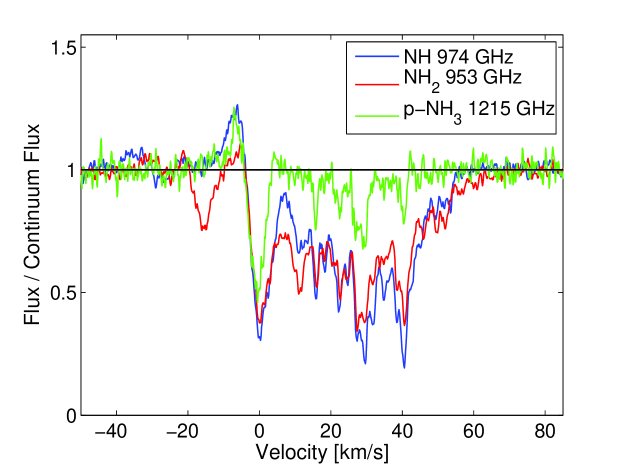
Figure 1 shows the double sideband WBS spectra of all observed transitions. The frequency scale is converted as customary to Doppler velocities relative to the local standard of rest (). All spectra, except NH+ which is not detected, show emission at negative velocities and a deep absorption at 1 km s-1 associated with G10.60.4 as measured by observations of OH masers. At higher velocities we see a number of absorption features which are also seen in atomic hydrogen (Fish et al. 2003), HCO+, HNC, HCN and CN (Godard et al. 2010). The only transition which does not show absorption components from the foreground material is -NH3 20 – 10.
The double-sideband calibrated antenna temperatures shown in Fig. 1 have to be divided by two in order to get the correct continuum levels, , which are 0.6, 2.6. 2.6, 3.0 and 3.4 K for NH3 at 572 GHz, NH2, NH, NH+, and NH3 at 1 215 GHz, respectively. The sideband gain ratio has been shown to be close to unity in previous PRISMAS observations (Neufeld et al. 2010b; Gerin et al. 2010), although departures at the 10% level have been seen at some frequencies (Neufeld et al. 2010a). We here adopt a sideband ratio of unity.
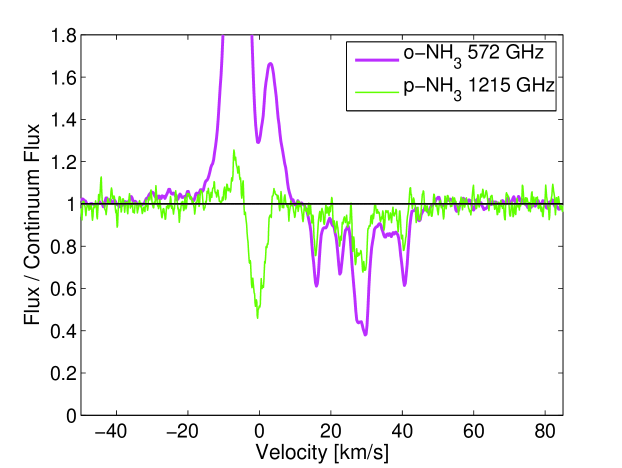
Figure 2 shows a comparison of NH, NH2, and -NH3 where the intensities are normalised to the continuum in a single sideband as /(cont)1 assuming a sideband gain ratio of unity. The NH and NH2 spectra are strikingly similar, despite their complicated hyperfine structures. The -NH3 spectra also show the same absorption pattern, although not as strongly. Figure 3 shows a similar comparison of - and -NH3. Here, too, we see the same absorption pattern in both species, and strong emission and self-absorption in the -line from the source itself. The strongest velocity components in the foreground material lie at 16, 22.5, 27.5, 30 and 40.5 km s-1.
The line opacities are calculated as . To be conservative and not include absorption from the source itself, we use the velocity interval 11 – 54 km s-1. The total integrated opacities are 20, 16, 9, and 3.4 km s-1 for NH, NH2, NH3 at 572 and 1 215 GHz, respectively.
Even though unsaturated absorption lines provide straightforward determinations of opacity and column densities, the numerous hyperfine-structure components and velocity features complicate the analysis of both NH and NH2. The spectroscopic properties of NH and NH2 have been studied extensively and references, rest frequencies and molecular properties for NH and NH2 are listed in the Cologne Database for Molecular Spectroscopy333http://www.cdms.de (CDMS, Müller et al. 2005), and NH3 in Jet Propulsion Laboratory444http://spec.jpl.nasa.gov (JPL, Pickett et al. 1998).
In order to estimate the total column density from the integrated opacity, it is necessary to correct for the population of molecules in unobserved excited levels and to quantify any possible effect of stimulated emission. We have done this through non-equilibrium excitation calculations of integrated opacity with an enhanced version of the RADEX code555The published version will soon include these enhancements, see http://www.sron.rug.nl/vdtak/radex/index.shtml (van der Tak et al. 2007). Where collision rates are unknown, we have made guesses scaled in proportion to radiative line strengths. We assume diffuse molecular cloud conditions with = 30 K and (H2) = 500 cm-3. The background radiation is a model of the average Galactic background radiation in the solar neighbourhood plus the cosmic microwave background radiation. The excitation of the hydride molecules in diffuse gas is dominated by the background continuum radiation and not by collisions. The resulting excitation temperatures of the observed submillimetre transitions are typically 4 – 5 K, which are small enough compared to that no correction for emission is required. All the optical depths of the hyperfine components that contribute to the line are summed. We have treated - and -forms of molecules together in the expectation that their relative abundances are fixed by the chemical formation process. Plausible rates of formation and destruction are included explicitly in the excitation calculation. Thus we derive total column densities as summarised in Table LABEL:Table:_columns. The analysis is complicated for NH3 by the existence of metastable excited states, especially in the species. The entry for NH3 in Table LABEL:Table:_columns is the sum of the measured column density in , the measured column density in the lower inversion sublevel of , and calculated values in the upper inversion sublevel of and in both sublevels of . All other states are expected to have negligible populations. The uncertainties of measurement and in the excitation analysis do not fully constrain the / ratio in NH3, but it appears that the effective formation temperature must be greater than 20 K, otherwise the strength of the 1 215 GHz line cannot be explained.
| Species | = | |
|---|---|---|
| (cm-2) | ||
| NH | 1.51014 | 5.610-9 |
| NH2 | 8.01013 | 3.010-9 |
| NH3 | 8.71013 | 3.2 10-9 |
| NH+ | 1013 | 10-10 |
-
aCalculated in the velocity interval 11 – 54 km s-1.
We note that the three neutral nitrogen hydrides have comparable abundances: NH is approximately twice as abundant as NH2 and NH3. To estimate the abundance with respect to hydrogen we use = 2.71022 cm-2 as total column density of hydrogen in all forms (Neufeld et al. 2010b). This value is consistent with the estimated atomic hydrogen column density in this line-of-sight, (H) = 1.21022 cm-2 (Godard et al. 2010) inferred from absorption profiles observed with the VLA (Fish et al. 2003), and implies that the absorbing material is mostly molecular even if there most likely are large variations between the individual velocity components. Our estimate of the abundance of NH relative to total hydrogen is somewhat higher than the NH/H2 ratio of for six lines of sight where both are observed directly. The resulting abundances are found in Table LABEL:Table:_columns. The non-detection of NH+ is used to put an upper limit on its column density and abundance (3). A previous limit on NH+ towards Oph from ultraviolet observations, , is orders of magnitude less sensitive than our limit (Snow 1979; de Almeida & Singh 1982).
4 Discussion
The production of NH and NH2 by purely gas-phase processes is problematic since their formation is inhibited by a lack of a sufficient source of N+. The atomic ion can be formed by cosmic ray ionization of N or by reaction of He+ with N2 or CN, which were formed by neutral-neutral reactions.The standard gas-phase ion-molecule chemistry of nitrogen hydrides is then initiated by the reaction N++H NH+ + H, because H does not react rapidly with N. Typical steady state dark cloud models ( = 1103 – 5104 cm-3, = 10 – 40 K, ), predict an NH2 abundance of (1-10)10-8, an NH abundance 10 times lower, and an NH2/NH3 ratio of 0.3 – 1.5 for a wide range of assumptions (e.g. Millar et al. 1991; Langer & Graedel 1989), but these are not directly applicable to diffuse molecular gas.
Previous observations of NH in diffuse clouds were taken to imply that NH is produced on grain surfaces (Mann & Williams 1984; Wagenblast et al. 1993; O’Neill et al. 2002). Such models, however, often predict up to 1 000 times more NH3 than NH2 (Hasegawa & Herbst 1993). An additional source of NH and NH2 is fragmentation of ammonia by photodissociation in diffuse clouds. Models of ultraviolet illuminated PDRs predict NH2/NH31 and NH3/NH1 in regions with extinction (e.g. Sternberg & Dalgarno 1995). The abundance patterns that we see in diffuse molecular gas are clearly different from those in Sgr B2, where NH3/NH2/NH and the fractional abundance of NH is a few times 10-9 (Cernicharo et al. 2000; Goicoechea et al. 2004).
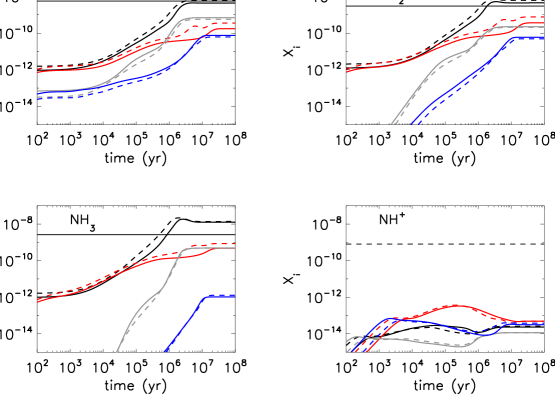
We have used two different approaches to chemical models in order to compare the nitrogen-hydride abundances with theory. First, we constructed a pseudo-time-dependent model with constant physical conditions including both gas-phase and surface chemistry (Hasegawa et al. 1992) with = 2 and 3, = 500 and 5 000 cm-3, = 30 and 50 K, and = 10 K. The ultraviolet field is 1 , and the cosmic ray ionization rate is = 1.310-17 s-1. The resulting abundances are found in Fig. 4 (online material). Gas-phase chemistry alone does not match the observed abundances, failing by factors of 10 to 100 for NH and NH2. Inclusion of processes on dust surfaces increases the abundances of the three neutral hydrides to 10-8 – 10-9, but fails to match the high NH/NH3 ratio. If the dominant source of NH3 is association on surfaces and if the / ratio is fixed at a surface temperature below 20 K, then the 1 215 GHz line should be much weaker relative to the 572 GHz line than is observed. The observed line ratio is perhaps somewhat better explained by a high formation temperature, which points to exoergic gas-phase formation of NH3.
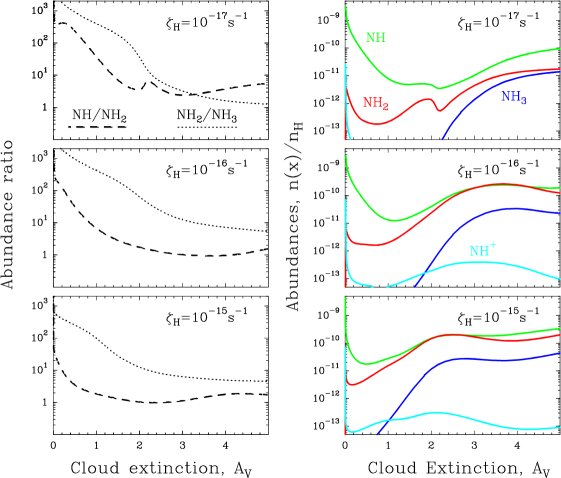
A second approach is to construct models of weak photon-dominated regions (PDR) through use of the Meudon PDR code (Le Petit el al. 2006; Goicoechea & Le Bourlot 2007), which is a steady-state, depth-dependent model with pure gas-phase chemistry. We use parameters appropriate for diffuse clouds, = 0.5 – 5 , = 100 – 1 000 cm-3, = 10-17 – 10-15 s-1, and illuminate one side only. The results of the best fitting model are found in Fig. 5 (online material). Although the resulting relative abundances of nitrogen-hydrides approach the observed ratios inside the cloud, the abundances relative to hydrogen are still too low.
5 Conclusions
Our first detections of spectrally resolved rotational transitions of nitrogen hydrides in the interstellar medium show remarkable similarities of line profiles and abundances towards one background source. The formation mechanisms are, however, difficult to explain. Neither standard gas-phase nor grain-surface chemistry can fully explain our observations, which may suggest that important reactions have been overlooked in the chemistry of interstellar nitrogen. Further analysis of the line profiles will yield abundance ratios in separate velocity components and will allow the nitrogen species to be compared directly with tracers of molecular hydrogen like CH and HF. Our sample will also be enlarged with seven additional sight-lines in the PRISMAS project. The chemical models will be refined and the possible role of turbulent dissipation regions will be assessed.
Acknowledgements.
HIFI has been designed and built by a consortium of institutes and university departments from across Europe, Canada and the United States under the leadership of SRON Netherlands Institute for Space Research, Groningen, The Netherlands and with major contributions from Germany, France and the US. Consortium members are: Canada: CSA, U.Waterloo; France: CESR, LAB, LERMA, IRAM; Germany: KOSMA, MPIfR, MPS; Ireland, NUI Maynooth; Italy: ASI, IFSI-INAF, Osservatorio Astrofisico di Arcetri- INAF; Netherlands: SRON, TUD; Poland: CAMK, CBK; Spain: Observatorio Astronómico Nacional (IGN), Centro de Astrobiología (CSIC-INTA). Sweden: Chalmers University of Technology - MC2, RSS & GARD; Onsala Space Observatory; Swedish National Space Board, Stockholm University - Stockholm Observatory; Switzerland: ETH Zurich, FHNW; USA: Caltech, JPL, NHSC. CP and JHB acknowledge generous support from the Swedish National Space Board. JC and JRG thanks spanish MICINN for funding support under projects AYA2009-07304 and CSD2009-00038 M.S. acknowledges support from grant N 203 393334 from Polish MNiSW.References
- (1) Cernicharo, J., Goicoechea, J. R., & Caux, E. 2000, ApJ, 534, L199
- (2) Cheung, A. C., Rank, D. M., Townes, C. H., Thornton, D. D., & Welch, W. J. 1968, Physical Review Letters, 21, 1701
- (3) Crawford, I. A. & Williams, D. A. 1997, MNRAS, 291, L53
- (4) de Almeida, A. A. & Singh, P. D. 1982, A&A, 113, 199
- (5) de Graauw. T., Helmich, F. P., Phillips, T. G., et al. 2010, A&A, 518, L4
- (6) Farmer, C. B. & Norton, R. H. 1989, A high-resolution atlas of the infrared spectrum of the sun and the earth atmosphere from space. A compilation of ATMOS spectra of the region from 650 to 4800 cm-1 (2.3 to 16 m). Vol. I. The sun., ed. Farmer, C. B. & Norton, R. H.
- (7) Feldman, P. D., Fournier, K. B., Grinin, V. P., & Zvereva, A. M. 1993, ApJ, 404, 348
- (8) Fish, V. L, Reid, M. J., Wilner, D. J., & Churchwell, E. 2003, ApJ, 587, 701
- (9) Gerin, M., de Luca, M., Black, J. H., Goicoechea, J., et al. 2010, A&A, 518, L110
- (10) Godard, J. R., Falgarone, E., Gerin, M., Hily-Blant, P., & de Luca, M. 2010, A&A, accepted
- (11) Goicoechea, J. R. & Le Bourlot, J. 2007, A&A, 467, 1
- (12) Goicoechea, J. R., Rodríguez-Fernández, N. J., & Cernicharo, J. 2004, ApJ, 600, 214
- (13) Hasegawa, T. I. & Herbst, E. 1993, MNRAS, 263, 589
- (14) Hasegawa, T. I., Herbst, E., & Leung, C. M. 1992, ApJS, 82, 167
- (15) Langer, W. D. & Graedel, T. E. 1989, ApJS, 69, 241
- (16) Le Petit, F., Nehmé, C., Le Bourlot, J., & Roueff, E. 2006, ApJS, 164, 506
- (17) Liszt, H. S., Lucas, R., & Pety, J. 2006, A&A, 448, 253
- (18) Mann, A. P. C. & Williams, D. A. 1984, MNRAS, 209, 33
- (19) Meier, R., Wellnitz, D., Kim, S. J., & A’Hearn, M. F. 1998, Icarus, 136, 268
- (20) Meyer, D. M. & Roth, K. C. 1991, ApJ, 376, 49
- (21) Millar, T. J., Bennett, A., Rawlings, J. M. C., Brown, P. D., & Charnley, S. B. 1991, A&AS, 87, 585
- (22) Müller, H. S. P., Schlöder, F., Stutzki, J., & Winnewisser, G. 2005, Journal of Molecular Structure, 742, 215
- (23) Nash, A. G. 1990, ApJS, 72, 303
- (24) Neufeld, D., Goicoechea, J.R., Sonnetrucker, P., et al. 2010a, A&A, this volume
- (25) Neufeld, D., Sonnetrucker, P., Phillips, T. G. et al. 2010b, A&A, 518, L108
- (26) O’Neill, P. T., Viti, S., & Williams, D. A. 2002, A&A, 388, 346
- (27) Ott, S. 2010, in Astronomical Data Analysis Software and Systems XIX, ed. Mizumoto, Y., Morita, K.-I., & Ohishi, M, Astronomical Society of the Pacific Conference Series, in press
- (28) Pickett, H. M., Poynter, I. R. L., Cohen, E. A., et al. 1998, Journal of Quantitative Spectroscopy and Radiative Transfer, 60, 883
- (29) Pilbratt, G., Riedinger, J. R., Passvogel, T., et al. 2010, A&A, 518, L1
- (30) Polehampton, E. T., Baluteau, J.-P., Swinyard, B. M., et al. 2007, MNRAS, 377, 1122
- (31) Roelfsema, P. R. 2010, A&A, this volume
- (32) Schmitt, J. L. 1969, PASP, 81, 657
- (33) Snow, Jr., T. P. 1979, Ap&SS, 66, 453
- (34) Sternberg, A. & Dalgarno, A. 1995, ApJS, 99, 565
- (35) Swings, P., Elvey, C. T., & Babcock, H. W. 1941, ApJ, 94, 320
- (36) van der Tak, F. F. S., Black, J. H., Schöier, F. L., Jansen, D. J., & van Dishoeck, E. F. 2007, A&A, 468, 627
- (37) van Dishoeck, E. F., Jansen, D. J., Schilke, P., & Phillips, T. G. 1993, ApJ, 416, L83
- (38) Wagenblast, R., Williams, D. A., Millar, T. J., & Nejad, L. A. M. 1993, MNRAS, 260, 420
- (39) Weselak, T., Galazutdinov, G. A., Beletsky, Y., & Krełowski, J. 2009, MNRAS, 400, 392
Appendix A Figures