Pressure Support in Galaxy Disks: Impact on Rotation Curves and Dark Matter Density Profiles
Abstract
Rotation curves constrain a galaxy’s underlying mass density profile, under the assumption that the observed rotation produces a centripetal force that exactly balances the inward force of gravity. However, most rotation curves are measured using emission lines from gas, which can experience additional forces due to pressure. In realistic galaxy disks, the gas pressure declines with radius, providing additional radial support to the disk. The measured tangential rotation speed will therefore tend to lag the true circular velocity of a test particle. The gas pressure is dominated by turbulence, and we evaluate its likely amplitude from recent estimates of the gas velocity dispersion and surface density. We show that where the amplitude of the rotation curve is comparable to the characteristic velocities of the interstellar turbulence, pressure support may lead to underestimates of the mass density of the underlying dark matter halo and the inner slope of its density profile. These effects may be significant for galaxies with rotation speeds , but are unlikely to be significant in higher mass galaxies. We find that pressure support can be sustained over long timescales, because any reduction in support due to the conversion of gas into stars is compensated for by an inward flow of gas. However, we point to many uncertainties in assessing the importance of pressure support in real or simulated galaxies. Thus, while pressure support may help to alleviate possible tensions between rotation curve observations and CDM on kiloparsec scales, it should not be viewed as a definitive solution at this time.
Subject headings:
cosmology: dark matter — ISM: kinematics and dynamics — galaxies: ISM — galaxies: kinematics and dynamics – galaxies: dwarf1. Introduction
Galaxy rotation curves offer some of the strongest evidence for dark matter on kiloparsec scales (Sofue & Rubin, 2001, and references therein). This evidence rests on the assumption that rotating disk galaxies are in equilibrium, such that the outward centripal force of the rotating disk exactly balances the inward gravitational force from the mass interior to the disk. The rotation speed seen in atomic gas at large radii therefore can constrain a galaxy’s mass. The apparent “excess” mass inferred from the rotation curve, compared to the much smaller mass inferred from observations of the baryons within the galaxy, is assumed to be due to dark matter. The dark matter furthermore must be distributed with an approximately density profile in the outer galaxy, to reproduce the flat rotation curve that is observed.
In the centers of galaxies, constraints on the dark matter require a more accurate accounting of the baryonic mass, since baryons make up a larger fraction of the mass in a galaxy’s inner regions (e.g., Kalnajs, 1983; Kent, 1986; van Albada & Sancisi, 1986). Unfortunately, assigning a mass to the baryonic component of galaxy is uncertain, due to our limited knowledge of the stellar mass-to-light ratio, the effects of dust extinction, and the contributions of atomic and molecular gas.
Alternatively, the difficulties in probing inner halos can be reduced by studying only galaxies with intrinsically low baryon fractions, such as dwarf and low surface brightness galaxies. These galaxies have no central bulges, low baryonic surface densities, and high gas fractions, thus minimizing the impact of uncertainties in the stellar mass-to-light ratio. Detailed analyses of such galaxies tend to show more slowly rising rotation curves than in massive spirals. Part of the slow rise is due to the reduced contribution of baryons to their inner density profiles (although, see Swaters et al., 2009). However, the slowly rising inner rotation curve is also indicative of shallow inner density profiles for the dark matter halo (, with ; see the thorough review by de Blok, 2009, and references therein). These inner slopes are in apparent conflict with predictions from numerical simulations of dark matter halos in CDM, which favor inner power law slopes with steeper than -0.75 on kiloparsec scales and below (Dubinski & Carlberg, 1991; Navarro et al., 1997; Moore et al., 1998; Colín et al., 2004; Navarro et al., 2004; Hayashi et al., 2004; Navarro et al., 2008; Stadel et al., 2009). When observational uncertainties in deriving rotation curves from long-slit spectra are taken into account, the apparent conflict is weaker (Spekkens et al., 2005; Rhee et al., 2004; Hayashi et al., 2004; Valenzuela et al., 2007), although the discrepancies between observations and theory still appear to persist when full velocity fields are considered (e.g., Spano et al., 2008; Kuzio de Naray et al., 2008, 2009; de Blok et al., 2008a).
In addition to the possible discrepancy in the inner slope of the density profile, the overall density likewise appears to be significantly lower than seen in simulated halos (Alam et al., 2002). The tension between the observed and predicted halo densities has been somewhat reduced by the latest WMAP results (Macciò et al., 2008), but significant offsets remain (see the discussion in Sellwood, 2009).
Taken together, the rotation curve analyses are some of the strongest lines of evidence that the success of CDM on large scales breaks down when observed on kiloparsec scales. The majority of these analyses rely on the assumption that the galaxy’s radial equilibrium is entirely governed by the competition between gravity and centripetal force. However, most rotation speeds are measured using Hi or Hii emission lines. These lines are emitted by gaseous disks, which can also experience radial forces due to pressure gradients. These pressure gradients have the potential to provide an additional outward force, which helps to support the disk radially. This support allows the disk to remain in equilibrium while rotating more slowly than the true circular velocity associated with the gravitational potential. Thus, if pressure support is neglected, then the inferred dynamical mass of the galaxy will be less than the true mass.
Pressure support in the ISM has several possible sources. The most obvious is thermal support (i.e. ). However, analysis of the temperatures and densities of the multiphase ISM suggest that thermal pressure falls far short of what is needed to support the observed vertical structure (e.g., Boulares & Cox, 1990). The second potential source of support is magnetic. However, it too appears to be insufficient to support the disk (e.g., de Avillez & Breitschwerdt, 2005). The final, and most likely dominant, source of pressure support comes from interstellar turbulence (see reviews by Elmegreen & Scalo, 2004; Mac Low & Klessen, 2004). This turbulence is most likely continuously driven by stellar winds and supernovae, although the exact source is under some debate, and other driving mechanisms may take over in regions where the star formation rate is low. The turbulent pressure scales with the gas density and the velocity dispersion as , such that regions of high gas density and high velocity dispersion have higher pressures. Since both of these quantities tend to decline with radius in galaxy disks, pressure decreases outwards, producing a pressure gradient that can contribute to the radial support of the disk.
Corrections for pressure support have a long and varied history in the literature. In the early days of interferometric 21 cm mapping of dwarf galaxies, it was recognized that the turbulent motions within dwarf galaxies were comparable to the amplitude of the rotation curve (e.g., Tully et al., 1978). Thus, pressure support due to turbulent motion had the potential to produce a significant difference between the true circular velocity and the observed rotational speed. It became standard to “correct” the observed rotation curve for pressure support111This correction was often erroneously referred to as a correction for “axisymmetric drift”, a term that applies to a stellar population’s difference from the true circular speed, due to its velocity dispersion. The observed offset is produced by the different sign of orbital epicycles for stars with guiding centers inside and outside of the radius of observation. Although the mathematics is similar, the underlying physical situation is quite different from the pressure support of the gas., usually assuming either a gaussian or a constant radial profile for the turbulent velocity (Tully et al., 1978; Skillman et al., 1987; Lo et al., 1993; Côté et al., 2000; Meurer et al., 1996). These corrections fell out of favor during the last decade, presumedly as the focus turned to slightly higher mass low surface brightness galaxies. In addition, assessment of the importance of pressure using more recent, higher quality data suggested that pressure support could be neglected in most circumstances (e.g., Swaters et al., 2009).
Renewed attention on the importance of pressure support comes from the latest generation of hydrodynamical simulations of galaxies. Most notably, Valenzuela et al. (2007) explicitly measured the difference between the rotational velocity of the gas and the true underlying circular velocity, for model late-type disk galaxies with a maximum circular velocity of . They found that the observed rotational velocity indeed underestimated the true circular velocity, and argued that pressure support was responsible for a significant portion of the difference. Although it is likely that the Valenzuela et al. (2007) simulations were not able to fully resolve all the relevant subgrid physics involved in generating turbulent pressure (e.g., Joung & Mac Low, 2006), their results certainly motivate a renewed examination of the effect of pressure in disk support, particularly in light of new observational constraints (e.g., Tamburro et al., 2009). In addition, recent simulations suggest the possibility that estimates of pressure support based on measurements of the vertical velocity dispersion may underestimate the true pressure support by at least a factor of two (e.g., Agertz et al., 2009).
In this paper we reassess the likely importance of pressure in different regimes of galaxy mass, for a range of plausible galaxy models, using modern data to constrain the distribution and kinematics of the gas. We first address the issue analytically, by calculating the expected differences between the observed rotation curves and true circular velocities, for both NFW halo profiles and realistic slowly-rising rotation curves. We show that the dark matter density profiles inferred from the observed rotation curves are extremeley sensitive to the details of the assumed pressure distribution. Thus, small changes in the assumptions can drastically change the scientific conclusions. We then consider whether pressure support is a sustainable phenomena. Gas consumption will tend to preferentially reduce the gas density in the center of galaxies, reducing the pressure support over time. We calculate the evolution in the pressure support with time, and find that inward redistribution of gas in response to decreased pressure support tends to counteract the central gas consumption, such that pressure support can be significant over the lifetime of a star forming disk. We next analyze the pressure support in a galaxy from the THINGS survey. In this particular case, we find that pressure support is not significant, as we expected from the overall rotation speed of the galaxy. However, the exercise highlights the difficulty in accurately assessing the amplitude of pressure support in real galaxies. Finally, we discuss the possible limitations of application of simplified analytic calculations of pressure support.
2. Pressure Support for Rotation
The circular speed of a test particle in a circular orbit is defined as
| (1) |
for an axisymmetric system, where is the gravitational potential. If the system is in equilibrium, then the inward radial force due to gravity must be balanced by an equal outward force. Traditionally, one assumes that the outward force is entirely dominated by centripetal force due to rotation with a velocity , such that
| (2) |
where is the mass contained with a radius , assuming that the potential is approximately spheroidal and thus that there is no significant gravitational force from mass at larger radii. This equation implicitly assumes that all material at a given radius is moving with the circular speed, and that that the observed tangential velocity obeys
| (3) |
However, in most cases (the “rotation curve”) is measured using gas as a tracer. Unlike ideal test particles, the gas (usually neutral Hi or ionized Hii) can experience an additional outward force due to pressure. This gas pressure can potentially provide additional radial support to the rotating gaseous disk. The resulting outward force allows the gas in the disk to rotate more slowly than the circular velocity, while still maintaining a stable circular orbit. In such cases, interpreting the observed angular velocity as the circular velocity would lead one to underestimate the mass within .
To estimate the importance of pressure support in modifying , we consider a parcel of gas at radius within a rotating disk. We assume that the gas has density within a volume (where is the surface area of the volume normal to the radius), giving a mass . For a stable circular orbit, the radial forces must be in balance, giving
| (4) |
where , , and are the forces due to gravity, centripetal acceleration, and the pressure gradient, respectively.
If we assume that the gravitational potential is dominated by an approximately spheroidal mass component (as one might expect for late type galaxies with low surface density disks), then the radial gravitational force is
| (5) |
The force due to centripetal acceleration is
| (6) |
and the force due to the pressure gradient is
| (7) | |||||
| (8) |
Substituting back into the force equilibrium equation, cancelling , and rearranging yields
| (9) |
To calculate the radial pressure gradient, we assume that the gas pressure is dominated by turbulent motions, rather than thermal processes. One can thus approximate the local gas pressure as
| (10) |
where is the density of the gas and is the one-dimensional velocity dispersion. Both the gas density and velocity dispersion tend to decline with radius, leading to a radial gradient in the pressure, which produces an outward force. If one assumes that the gas disk has constant thickness (e.g., Kregel et al., 2004; Bottema et al., 1986)222Note that the galaxies in both Kregel et al. (2004) and Bottema et al. (1986) have higher average circular speeds () than the galaxies that are relevant for this paper. For lower mass galaxies, firm constraints on the radial variation in the gas scale height appear to be unavailable, beyond the fact that the gas distribution seems to much thicker (compared to the scale length) than in more massive galaxies (Roychowdhury et al., 2010)., then where is the mass surface density of the gas disk. Equation 9 then becomes
| (11) |
where is the radial component of the gas velocity dispersion ellipsoid.
Equation 11 can be used to calculate the true circular velocity from the observable quantities , , and , assuming that one can estimate from the HI velocity dispersion. We will discuss this latter assumption in Section 5.1 below. Note also that the size of the correction to does not depend on the absolute value of the gas surface density, and instead only depends on its fractional rate of change with radius.
Equation 11 suggests that the observed tangential velocity can differ significantly from the true circular velocity in regions where the turbulent velocities are of the same order as the rotational velocity. In addition, it shows the that strength of the pressure support depends on the fractional rate of change in the turbulent velocities and the gas surface density with radius. Galaxies with rapidly declining values of or will have more significant pressure support, for the same .
In most applications the full expressions for and can be used in equation 11. However, it is instructive to simplify the expression by assuming that the gas surface density and 1-d turbulent velocity fall off radially like exponentials with scale lengths and , respectively. If so, then the force balance equation becomes
| (12) |
where we have defined a pressure scale length as
| (13) |
Empirically, the gas density falls far more steeply with radius than the velocity dispersion does (Section 3.1.1). Therefore, the term will typically dominate, such that .
Alternatively, we can attempt to estimate the pressure directly from the gas surface density. Joung et al. (2009) use hydrodynamic grid simulations to calculate the turbulent pressure in stratified gas layers, after adopting a power-law relationship between gas density and star formation rate. They find that the turbulent pressure scales with the star formation rate per unit area like
| (14) |
which, for a Schmidt law (; Kennicutt, 1998) gives a power-law relationship between the turbulent pressure and the local gas surface density:
| (15) |
Note that the exponent differs from Joung et al.’s equation 20 for the relationship between turbulent pressure and the gas density , due to variations in the gas scale height with gas density and star formation rate. With equation 15, we convert equation 9 into a form where the strength of the term depends on gas density alone.
| (16) |
For an exponential gas distribution, this equation reduces to
| (17) |
which is comparable to equation 12 if . For comparison, our first derivation of the correction to (equation 13) suggests that for (Section 3.1.1 below). The Joung et al. (2009) prescription should therefore produce changes in that are smaller than those in equation 12 by 60%, for the same velocity dispersion and gas surface density profile. Note however that the Joung et al. (2009) prescription in equation 14 has not yet been calibrated in the low star formation efficiency regime, within which the exponent on the relationship between gas surface density and star formation rate is typically much steeper than that adopted for a Schmidt law (e.g., Bigiel et al., 2008).
Unless otherwise stated, however, we will retain the more general form of equation 11 when calculating the effects of pressure support.
3. Corrections to the Mass Density
The reduction of the tangential velocity has a direct impact on the inferred mass density . For an arbitrary rotation curve, the density at some radius can be calculated from the rotation curve and its derivative
| (18) |
assuming the potential is roughly spherical.
The mean mass density within a radius , , can also be derived from the rotation curve
| (19) |
This quanity has the benefit of being a more robust measurement of the density, since it depends only on the normalization of the rotation curve, and not its derivative.
If no corrections are made for pressure support, then the mean density inferred to be within each radius is reduced from the true density, since . For the specific case of exponential scale lengths for the gas and velocity dispersion,
| (20) |
confirming that the net result will be to infer a lower mean density than the true mean density .
Pressure support will also alter the apparent slope of the density profile. The power law slope of the density (i.e., such that ) can be related to the logarithmic slope of the rotation curve (i.e., ) through
| (21) |
Pressure support will tend to make the apparent rotation curve shallower than the true rotation curve, reducing the value of . We therefore expect that neglecting pressure support would lead one to infer shallower inner density profiles (i.e., smaller values of ), for realistic values of .
The reduction in density will be most significant where the circular velocity is small compared to the gas velocity dispersion, and will thus be noticible over a larger fraction of a galaxy’s radii when the virial velocity of the galaxy is small. Thus, pressure support is potentially most significant in the regimes where the apparent discrepancies from simulated dark matter halos are largest – namely, the inner regions of low mass galaxies.
3.1. The Amplitude of Pressure Support
To calculate the amplitude of the effects of pressure support, we now calculate changes to the rotation curve and the inferred density profile. We do so in two ways – by starting with an assumed true and then calculating the rotation curve that would be observed, or by starting with observations of and then inferring the true . We consider three baseline models, with and . For each of the models, we first must set the physical parameters of the model galaxies (i.e. scale lengths, velocity dispersions, etc). In the following sections, we discuss the observations used to constrain the scale lengths and amplitudes of the gas density and velocity dispersion profiles (Section 3.1.1), the circular velocities of realistic dark matter halos (Section 3.1.2), and the observed galaxy rotation curves (Section 3.1.3).
3.1.1 Setting the Gas Density and Velocity Dispersion Profile
To assign realistic values for the amplitude of the pressure gradient, we must first specify the radial behavior of the gas density and the velocity disperion profile (e.g., Equation 10). We can constrain these values using the wealth of Hi observations of nearby galaxies.
Based on the observations of Swaters et al. (2002), we assume that the gas density declines as an exponential with a scale length of . We choose values for using observations of the Hi scale length as a function of given in Swaters et al. (2002) for a large sample of dwarf irregular galaxies. We find that galaxies follow for , after updating the distances in Swaters & Balcells (2002) with more recent determinations derived from the tip of the red giant branch, and eliminating galaxies with , for which distances are more uncertain. The scatter around the mean relation is . We note that the Hi scale lengths measured by Swaters et al. (2002) typically ignored the very inner regions, where the Hi profile rolls over to a nearly constant surface density of for late-type disks. However, we consider it likely that the saturation of the Hi surface density is due to the conversion of Hi into H2 (see Figure 8 of Bigiel et al., 2008, for example), in which case the gas density should in fact continue rising to the center. We thus assume that .
Our next step is to set the radial velocity dispersion profile of the galaxies using Tamburro et al. (2009)’s recent analysis of Hi data from THINGS (Walter et al., 2008). We take three galaxies (from their sample of 11) as being representative of the different velocity regimes we are probing – Holmberg II (; Puche et al., 1992), NGC 4214 (; Allsopp, 1979), and NGC 7793 (; Carignan & Puche, 1990); note that the exact rotation speeds of these galaxies are uncertain, as Tamburro et al. (2009) chose nearly face-on galaxies for their velocity dispersion analysis. The velocity dispersion profiles are well fit with exponentials , with measured approximately perpendicular to the plane of the galaxy. For our three representative galaxies, the velocity dispersion profile of the gas is well fit with and and and , for HoII, NGC 4214, and NGC 7793, respectively. There is remarkably little variation in the central velocity dispersion inferred for the range of galaxy masses we considered, and only a modest variation of . The scale lengths of the velocity dispersion profiles are much longer than those inferred for the gas surface density. Using the relationship between rotation speed and HI scale length we derived above, we estimate . Going forward, we therefore adopt for all model galaxies, and . Note that we are forced to assume that the velocity dispersion is isotropic (i.e. ), given that we lack any reliable way to measure for the gas.
3.1.2 Pressure Support for a True NFW Circular Velocity
With the above profiles for the gas density and velocity dispersion, we have sufficient information to calculate the radial pressure gradient for our model galaxies. We now must make assumptions for the rotational velocities of the model galaxies. In this section, we assume that there is some true underlying circular velocity profile known from N-body simulations, and then calculate the apparent rotation curve, including the effects of pressure.
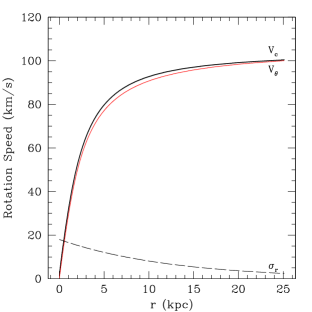
We adopt a true for the model galaxies by assuming that the mass distribution is dominated by an underlying NFW density profile (Navarro et al., 1996) with a virial concentration parameter . We adopt virial velocities that produce the desired fiducial rotation speeds at (such that typically ). We then use the numerical simulation results of Macciò et al. (2008) to fix as a function of , adopting for the WMAP5 cosmology; for the three fiducial rotation speeds of 30, 50, & , we derive , 13.5, & 11.0, respectively. The choice of and then fixes the core radius for the density profile, where and for an assumed WMAP5 cosmology. We then calculate the true circular velocity expected for the NFW profile, and derive the apparent angular velocity using equation 11 to include the effects of pressure support.
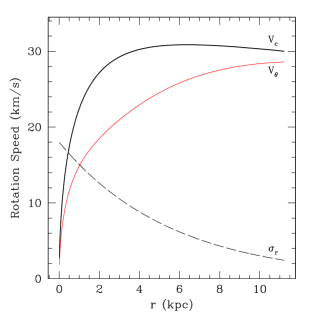
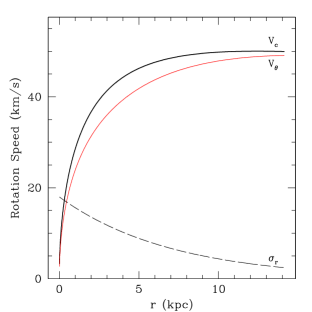
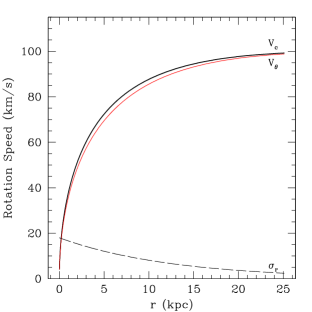
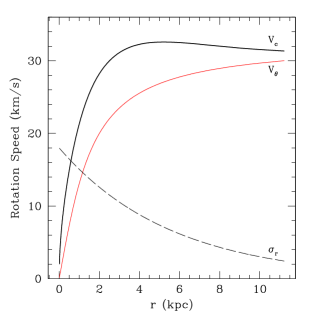
We plot the resulting observed rotation curves in Figure 1, for the three fiducial rotation speeds. At high rotation speeds , the angular momentum support is far more important than pressure support, and the observed rotation curve is an excellent tracer of the true circular velocity. At low rotation speeds, however, pressure support becomes significant, such that the gas disk can rotate more slowly while still being supported against collapse. In such cases, the observed rotation speed is significantly less than the true circular velocity.
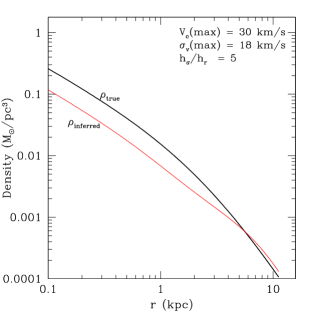
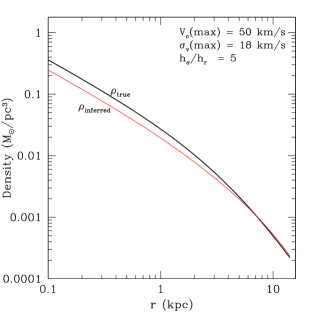
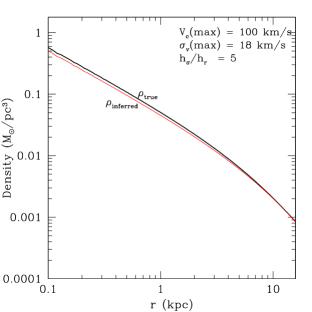
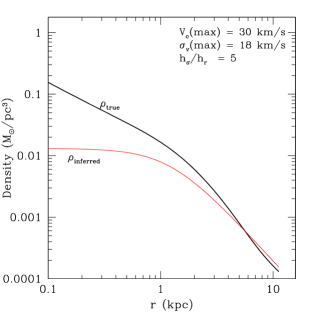
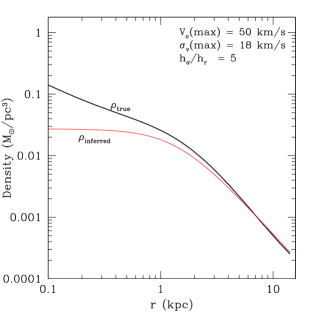
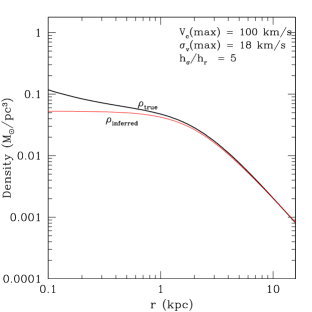
We calculate the density profiles that would be inferred from the observed rotation curves. We plot both the true and the inferred density profiles in Figure 2, for the same rotation curves shown in Figure 1. As expected, the inferred density profile is a good match to the true density profile for the models where pressure contributes little to the overall support of the disk. At lower rotation speeds, however, pressure support can lead to a significant reduction in the inferred density, by a factor of 1.46 in the model, and 2.18 in the model. If we consider the scatter in the halo concentration from Macciò et al. (2008), these reductions increase to factors of 1.96 and 6.98, respectively, at lower concentrations, producing more slowly rising circular velocities, and thus larger radial ranges over which the ratio of is large and pressure support is significant. At higher concentrations, the inferred density is reduced by smaller factors of 1.25 and 1.50 in the and models, respectively. The change in the inferred density is far less sensitive to our choice of .
Figure 2 suggests that pressure support can potentially lead to inferred densities that are significantly lower than the true underlying density, particularly for galaxies where the velocity dispersion is a significant fraction of the rotation speed. However, for the particular form of our model galaxies, there is no significant change in the inferred inner slope of the density profile. Both the true and the inferred density profiles show a cusped inner density profile with a power-law slope of approximately -1. Thus, pressure support does not necessarily create the appearance of a cored constant density mass profile, at least for our particular choice of velocity dispersion profile. However, while the literature suggests a possible discrepancy between observations of the inner density profile slope () and N-body simulations (e.g., de Blok, 2009), we note that such measurements depend on the second-derivative of the observed rotation curve (e.g., equation 18), and are thus highly dependent on non-circular motions (e.g., Spekkens & Sellwood, 2007; Wada et al., 2002), resolution, and changes in inclination.
3.1.3 Pressure Support for an Observed Isothermal Circular Velocity
In the above example, we considered how pressure support could alter the rotation curve and density profile expected for an NFW profile. In this example, we consider the true circular velocity that would be inferred for a frequently used parameterization of the observed rotation curve shape, after accounting for turbulent pressure support. In particular, we consider the arctangent description of the observed rotation curve
| (22) |
following the notation in Courteau (1997). This parameterization produces a rotation curve with an approximately linear rise out to a radius , beyond which it rolls over to a constant “flat” rotation curve with amplitude . The associated density profile has a constant density core with , which then declines as beyond .
We fixed values of as a function of using data from Courteau (1997) (including the data in Tables 6 and 7, for both the Courteau (1997) and Mathewson et al. (1992) samples of late type spirals), and from the Spekkens et al. (2005) sample of dwarfs. The Spekkens et al. (2005) rotation curves have been fit with a slightly different functional form, but one that agrees extremely well with equation 22 if their distance scale parameters are divided by 1.2 (i.e. in the Spekkens et al. (2005) notation) and their velocity scale parameters are divided by 0.87 (). We approximate using half of the Hi full-line velocity width for all samples. We use only those galaxies with asymptotically flat rotation curves ( for the Courteau (1997) fits and for the Spekkens et al. (2005) fits, where is a free parameter that accomodates rotation curves that do not become asymptotically flat at large radii); restricting the sample to this subset allows the Spekkens et al. (2005) and Courteau (1997) samples to be easily merged, in spite of their different parameterizations of the rotation curve shape.
Qualitatively, increases for lower rotation speeds over the interval from , as the effect of the central bulge on the density profile becomes systematically less important at lower galaxy masses. Below , however, all galaxies are essentially bulgeless, and the trend reverses, such that becomes slightly smaller with decreasing rotation speed. Because the bulge is essentially gone, the scaling of decreasing halodisk scale length with decreasing halo mass dominates at low masses. Since we are only interested in low mass galaxies with rotation speeds less than , we fit only to this latter regime, and adopt as a good representation of the range of the data. We note, however, that the scatter in this regime is quite large. Thus, at fixed maximum baryonic rotation speed (i.e., ), there is a significant range of density concentrations, such that in some galaxies the rotation curve reaches its peak value quickly, while in others the rotation curve is still rising at its last measured point.
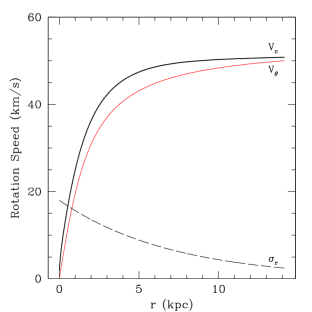
In Figure 3 we show the fiducial observed arctan rotation curves () adopted for the three mass ranges, along with the adopted velocity dispersion profiles (discussed in Section 3.1.1 above). We also show the true rotation curves () that would produce the observed rotation curve, given an outward pressure force due to gas pressure (e.g., equation 11). As we saw in Figure 1 for the NFW density profile circular velocities, the difference between the true circular velocity and the observed rotation speed are proportionally larger in lower mass galaxies. In addition, the differences between and are similar for a fixed maximum rotation speed, whether the models began with a true NFW circular velocity (Figure 1), or with an observed arctangent rotation curve (Figure 3).
Significant differences between the two approaches are seen, however, when we examine the inferred density profiles (equation 18) for the artangent rotation curves, shown in Figure 4. The density profile derived from the observed rotation curve would naively be interpreted as a modified isothermal density profile with a constant density core. However, once the effects of pressure support are included, the true density profile is seen to have a strong central cusp. The differences between the true and the observed density profiles are dramatic, and as such, failure to take pressure support into account would lead to fundamentally different scientific conclusions.
The relationship between the true and observed density profiles are quite different in the two cases we considered. When we started with a highly cusped density profile and then calculated the observed rotation curve in the presence of pressure support, we found little difference between the true NFW density profile and that which would have been inferred in the absence of corrections for pressure support. Both showed steep inner power law cusps with comparable slopes. In contrast, when we started with an observed arctangent rotation curve, the true density profile that would be derived after correcting for pressure support is far more cusped than one would infer from the observed rotation curve using traditional analyses.
Taken together, the two classes of models suggest that the typical effect of correcting for pressure support will be to make the inner density profile steeper, although by a small amount for apparent rotation curves that already suggest a steep inner cusp. More notably, however, the inferred density profile can be incredibly sensitive to the details of the pressure support. The differences between the observed rotation curves in Figures 1 & 3 are rather subtle, but they yield very different amplitudes for the correction needed to derive the true density profile. The corrections depend on the ratio of to , and thus we expect an equal level of sensitivity to subtle changes in the velocity dispersion profile.
This sensitivity is likewise reflected in the varying importance which past authors have placed on pressure support. Slight changes in assumptions for the velocity dispersion profile (e.g., flat, gaussian, exponential) led to a wide range of conclusions about the importance of correcting for pressure. Even more worrisome, this sensitivity indicates the difficulty in ever making an accurate correction for pressure support. Minor deviations in due to non-circular motions and varying inclination will easily compromise reconstruction of the true density profile, although numerical experiments seem to indicate that such affects are more likely to lead to overestimates of the mass, rather than the underestimates produced by neglecting pressure support (Wada et al., 2002). On the other hand, any correction is likely to push the inferred density profile closer to the true density profile. We discuss further complications due to observational limitations below in Section 5.1.
3.2. Reductions in the Mean Density
For a spherical mass density, the mean interior density within some radius is proportional to . Thus, the mean density inferred from a rotation curve will be artificially reduced if the observed rotational velocity is less than the true circular velocity, as it is in the presence of pressure support. This effect can be seen for both sets of models in Figures 2 & 4, which show systematic reductions in the density that would be inferred if pressure support were not taken into account.
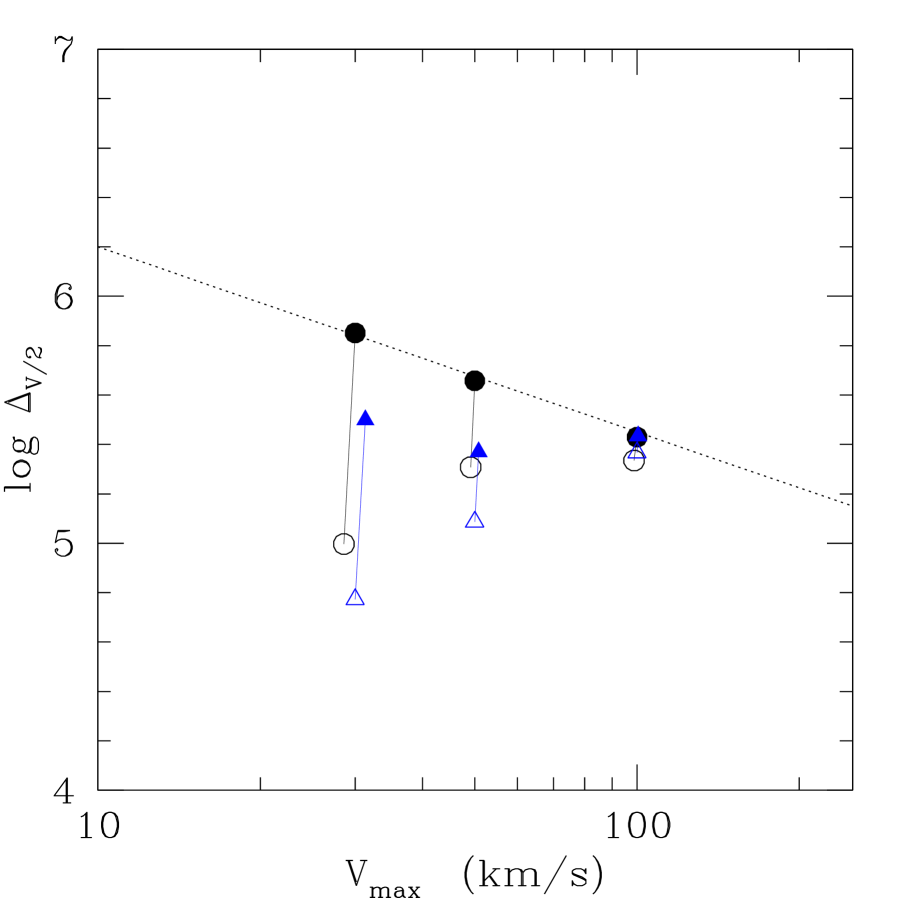
The mean interior density of a galaxy has been recently characterized by a dimensionless density , defined at the radius where the rotation curve has risen to half its maximum value (i.e., where ). The dimensionless density is defined at the mean interior density at this radius divided by the current critical density of the Universe (Alam et al., 2002):
| (23) | |||||
| (24) |
This quantity can be easily calculated for observed rotation curves and for simulated dark matter halos. Observationally, it is far more robust to uncertainties than calculations of the inner slope of the density profile, since it depends only on a single point on the rotation curve, at radii where the rotational speed is typically much larger than non-circular motions.
Initial comparisons between the value of for simulated halos and for low surface brightness galaxies suggested that the mean interior density of the simulated CDM halos was much higher than observed in real galaxies (Alam et al., 2002; Zentner & Bullock, 2003), even when no correction for the baryonic mass of the galaxies was made. Recent comparisons (Macciò et al., 2008) show less tension between the predictions and observations, largely due to the reduction in the predicted halo density with the currently favored WMAP5 parameters. However, the two barred galaxies modeled in detail by Weiner et al. (2001) and Zánmar Sánchez et al. (2008) find values of that are still an order of magnitude below the WMAP5 CDM prediction (although some of the low halo density may be due to angular momentum exchange from the bar itself; see review by Sellwood (2009)).
In Figure 5 we show the predicted measurements of the dimensionless density for our fiducial galaxies, showing both the true value of the dimensionless density (solid symbols), and the artificially low value that would be measured in the presence of pressure support (open symbols). For both the true NFW models (circles) and the observed arctan rotation curve models (triangles), pressure support significantly reduces the apparent dimensionless density for low mass galaxies. It has little effect for halos, however. Thus, correcting for pressure support could reduce any observed discrepancy for low mass halos, but would have no signficant impact at higher masses.
3.3. Can Pressure Support be Maintained?
The pressure support discussed above depends on the surface density of the gaseous disk. However, star formation will tend to erode the gas surface density, and thus reduce the pressure support. The gas will preferentially be depleted in the inner regions, due to the non-linear dependence of the star formation rate on gas density. The consumption of gas will then lead to an inward flow of gas, which in turn will help restore the pressure support. In this section we evaluate the importance of these effects, to assess whether pressure support can be a long-lived phenomena in an evolving star forming disk.
The evolution of pressure support in a disk depends to first order on the evolution of the gas surface density . The gas density at a radius in a rotating disk is governed by a series of differential equations governing the flow of matter through the annuli. The first of these equations describes the conservation of matter during flows:
| (25) |
where the gas surface density changes in response to the flow of matter between annuli (the second term on the LHS) and the conversion of gas into stars, as measured by the change in the stellar surface density .
The second equation describes the evolution of the radial forces,
| (26) |
which allows small radial velocities to develop when the angular velocity and pressure are no longer sufficient to balance the force that results from the gravitational potential . We have neglected the radial advection of , as terms proportional to are small.
The third equation describes constraints from angular momentum conservation
| (27) |
where the change in the angular momentum of the gas (first term) is due to angular momentum flux through the annulus at a rate controlled by the radial velocity (second term), and to the rate at which angular momentum drops out of the gas phase and into the stellar phase due to star formation (right hand side). In this equation we have ignored the effects of viscosity; see Firmani et al. (1996) for a full set of evolutionary equations containing viscous terms. Note that a gas disk will tend to collapse inwards in the presence of star formation (eqn. 26), due to decreased pressure support resulting from the conversion of gas into stars (eqn. 25). However, the resulting inward flow of high angular momentum gas (eqn. 27) will increase the circular speed, and thus will help counteract the shrinking of the disk.
To solve this system of equations, we make a series of simplifications. We first assume that the star formation rate surface density follows a Schmidt-type law, and is thus proportional to a power of the gas surface density, such that where is a fiducial surface mass density and is the fiducial star formation rate surface density when . We adopt , , and , in agreement with the mean trends found by Bigiel et al. (2008).
For our second assumptions, we assume that the gravitational potential is unchanged by the evolution in and , since the potential will be dominated by the dark matter and the stellar disk. We also assume that the gas disk starts in gravitational equilibrium (such that initially) before gas consumption drops the pressure support and takes the gas out of equilibrium.
Third, we assume that because , radial variations in the pressure are driven primarily by the change in gas density with radius. We thus assume that the velocity dispersion varies slowly enough with radius that it can be approximated as a constant, such that .
Finally, we assume that the velocity dispersion is constant with time, and thus that the energy in the turbulence is continually replenished due to energy input from evolving stars and magneto-rotational instabilities (see reviews by Mac Low & Klessen, 2004; Elmegreen & Scalo, 2004). To first order, this assumption has empirical support from observations that the average velocity dispersion depends very weakly on star formation rate, varying by less than a factor of two when the average star formation rate per unit area varies by more than a factor of 1000 (c.f., Figure 2 of Dib et al., 2006), for star formation rates comparable to those seen in late type galaxies. However, the assumption of constant velocity dispersion may be less valid in regions with star formation rates higher than , for which the apparent velocity dispersion does appear to correlate with star formation rate (c.f., Figure 1 of Tamburro et al., 2009), although again with only a factor of two range in velocity dispersion. Thus, although we expect that the decline in star formation rate due to gas consumption could potentially reduce the turbulent velocity dispersion, and thus the degree of pressure support, we expect the temporal variation in to be modest, due to the very weak empirical correlations between velocity dispersion and all other physical quantities.
With the above assumptions, we can rewrite the system of equations as:
| (28) | |||||
| (29) | |||||
| (30) |
where is the initial gravitational acceleration, set to keep the system in balance at the initial timestep (i.e. such that at ). These form a system of three differential equations with three unknowns (, , and ), which can be integrated forward from some assumed initial condition. We adopt an exponential profile for , with scale length chosen according to , as described for our fiducial disks in §3.1.1. We parameterize the initial rotation curve with an arctangent (eq. 22), with a scale length chosen as described in §3.1.3. We assume that the disk is initially in rotational equilibrium (), and fix the radial gas velocity dispersion at . Although it is unlikely that a real galaxy would ever be found in such an idealized state, these initial conditions are adequate for determining the timescales over which pressure support is significant.
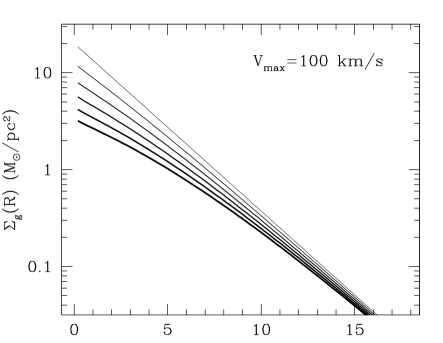
In Figure 6 we show the resulting evolution of the disk’s gas surface density (left column) and rotation curve (right column), for fiducial rotation speeds of , 50, & (top to bottom), at a series of timesteps separated by (light to dark, with the darkest line being the final state). In all disks, the gas surface density declines with time, with proportionally larger reductions in the center due to the higher star formation efficiency at high gas densities.
The models also show noticable radial redistribution of gas in the lowest mass galaxies, where pressure support is significant. In these galaxies, conversion of gas into stars leads to a reduction of pressure support. The reduced support then leads to an inward flow of gas, causing the gas disk to evolve with a nearly self-similar surface density distribution. This inward flow of material raises the mean angular momentum at each radius, causing the rotation speed to increase with time. In contrast, galaxies with higher rotation speeds have lower degrees of pressure support, leading to little radial redistribution of gas, and no obvious changes in the rotation curve.
Although the decline in the gas surface density does lead to some radial shrinking of the outskirts of pressure-supported gas disks, the rate of shrinking is not dramatic. The radius at which the outer disk passes through a fixed surface density (say, ) falls by only 10% over for the most pressure-supported galaxy, compared to 6% for the least pressure supported disk. Thus, while the reduction in pressure support in slowly rotating galaxies increases the rate of shrinking by a factor of two compared to rapidly rotating galaxies, the absolute amount of shrinking is small in either case. In constrast, the shrinking of disks due to falling pressure support was identified by Stinson et al. (2009) as a significant effect in the early evolution of dwarf galaxies. The rates calculated here are much smaller than found in the simulations, however, presumedly due to some combination of more rapid gas consumption and a larger degree of pressure support in the simulations.
The shrinking of the disk helps to refuel gas to the central regions. However, like the shrinking in the outskirts, the effect is small. The final surface density in the disk is 17% of the initial value, but is somewhat higher (21%) in the most pressure supported disk () due to the gas that has flowed inwards as the pressure support has decreased.
The overall conclusion from Figure 6 is that pressure support can have an impact on the evolution of gaseous disks, but the overall size of the impact should be modest. Moreover, while the degree of pressure support does decline somewhat with time, the overall decline is small, as can be seen from the fact that the ratio of remains close to its initial value. Thus, a disk that is partially supported by turbulent pressure is likely to be so over its lifetime, barring any significant change in its gas distribution or star formation rate in response to external forces (tidal interactions, infall, etc).
One caveat to the above conclusion is that the turbulent velocity of the gas may be time-dependent, as opposed to constant as we assumed above. For example, if the turbulent velocity of the gas is proportional to the star formation rate (e.g., Tamburro et al., 2009), then pressure support should increase during times of high star formation activity, and decrease during quiescent intervals. Such a variation could produce epochs of disk expansion and contraction, correlated with periods of high and low star formation rates, respectively. Empirically, however, the turbulent velocity does not seem to vary by more than a factor of two from galaxy-to-galaxy, even when the star formation rate per unit area varies by factors of ten or more. Self-regulation may therefore limit the strength of any possible correlation between turbulent velocity and star formation rate, which would then keep the degree of pressure support roughly constant.
4. Application to Real Galaxies
The calculations above adopt idealized model galaxies. We now derive the amount of pressure versus rotational support for real galaxies, using publicly-available Hi data.
Estimating the amplitude of pressure support requires measurements of the rotation speed, turbulent velocity, and gas surface density. Unfortunately, these quantities are frequently difficult to constrain observationally, especially within a single galaxy. First, the rotation speed is best measured for highly inclined galaxies with well-determined inclinations, but the velocity dispersion and gas surface density are most reliably measured for face-on systems. Second, the radial velocity dispersion controls radial pressure support, but only the vertical velocity dispersion can be easily measured (although the radial component can potentially be derived from detailed modelling). Third, the balance between pressure and rotation support can be most easily evaluated for velocity fields with negligible non-circular motions and constant inclination with radius, but such systems are rare among low mass galaxies. Third, the measured gas surface density should include both the molecular and atomic components, but molecular gas is rarely detected in low mass galaxies, possibly due to a strong mass-dependent variation in the ratio of CO to H2 (e.g., Boselli et al., 2002).
We select galaxies for testing the amplitude of pressure support from the THINGS sample of high-resolution VLA observations of Hi (The Hi Nearby Galaxy Survey; Walter et al., 2008). The data cubes for THINGS galaxies are publicly available, and rotation curves (de Blok et al., 2008a) and velocity dispersion profiles (Tamburro et al., 2009) are available for the majority of the galaxies. We restrict our initial selection to galaxies with , since only galaxies with are likely to show significant pressure support. The candidates are M81dwA, HoI, DDO53, M81dwB, HoII, NGC 628, NGC 4214, DDO154, and NGC 2366, in order of increasing apparent rotation speed (uncorrected for inclination). We further restrict the sample to those with inclinations , for which rotation curves can be reliably measured; only these galaxies have had rotation curves published in de Blok et al. (2008a). The remaining galaxies are DDO 154 () and NGC 2366 (), both of which are in a regime where the effects of pressure support may be marginally detectable. However, of these, NGC 2366 has a strongly declining rotation curve, suggestive of a kinematically disturbed galaxy, leaving DDO 154 as the only candidate for providing a legitimate analog of the models discussed in this paper. The few galaxies with potentially lower rotation speeds are nearly face-on, have asymmetric velocity fields, or are nearly spatially unresolved.
The rotation curve of DDO 154 was kindly given to us in electronic format by Erwin de Blok, based on de Blok et al. (2008a). We maintained consistency with the de Blok et al. (2008a) rotation curve by adopting their values for dynamical centers, inclinations, and distances for the sample galaxies, using the natural-weighted data sets.
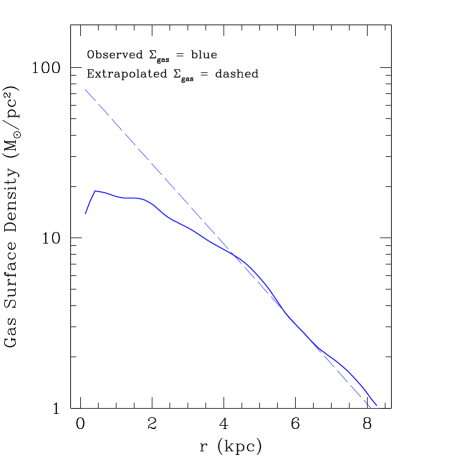
We estimate the average Hi surface density and velocity dispersion as functions of galactic radius. We obtained the inclination-corrected surface density from the moment 0 map, and the velocity dispersion from the moment 2 map, by integrating elliptical annuli with a width equal to that used by de Blok et al. (2008a) to derive the rotation curve. The total gas surface density at each radius was assumed to be , where the factor of 1.4 is an approximate correction for metals and molecular gas (since the latter is currently unavailable for these galaxies). We also considered a more extreme correction for molecular gas by assuming that follows an exponential profile into the center of the galaxy, such that the outer regions are dominated by atomic gas, but the inner regions are dominated by molecular gas, producing the apparent roll-over of towards the center. Both of the resulting gas density profiles are shown in Figure 7.
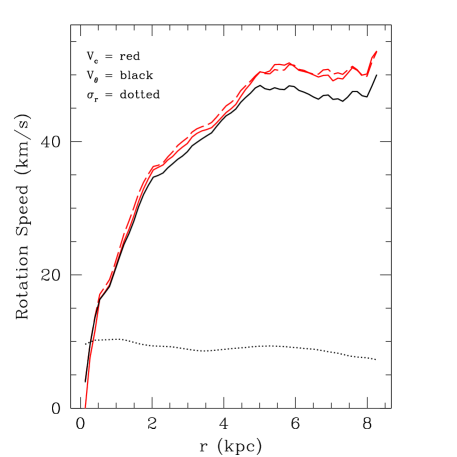
The pressure at each radius was taken to be , which implicitly assumes that . This assumption is not necessarily true, given that interaction between the ISM and stellar feedback may well differ between the vertical direction (where the ISM becomes diffuse over scales) and the radial and tangential directions (where the ISM remains dense on kiloparsec scales). This calculation also assumes that the pressure is due to random motions of the gas, rather than locally coherent motions due to expanding superbubbles. To better capture the broad radial trend in the pressure gradient, we chose to smooth the velocity dispersion and surface density before calculating the pressure. We then use equation 11 to calculate the true circular velocity that would be observed in the absence of pressure support.
In Figure 7 we plot the resulting data for DDO 154. The right hand panel shows the velocity dispersion profile (dotted line), the observed tangential velocity (black solid line), and the inferred underlying circular velocity (red), both for the observed gas surface density (solid line) and for an exponential surface density extrapolated to the center (dashed lines). There is little evidence that pressure support plays any significant role in this particular galaxy. The pressure gradient appears to be negligible in the inner regions, due to the relatively flat velocity dispersion profile and inner gas surface density profile. Moreover, the Hi velocity dispersion has a low amplitude compared to the fiducial model ( versus ). There is some evidence for pressure support in the outer regions, for which the true rotation speed may be 10% higher than observed. However, we have verified that this difference makes no significant changes in the inferred density profile. Likewise, the inferred dimensionless density increases by less than 2%, to , which still lies below the fiducial curve from simulations in Figure 5. However, while the evidence for pressure support is small in this case, this galaxy is not in a regime where we expected pressure support to be obvious.
5. Discussion of Possible Limitations
Our analysis of pressure support reveals a number of contradictions. On the one hand, straight-forward analytic calculations demonstrate that pressure support is likely to contribute significantly to the radial support of low mass galaxy disks, in agreement with numerical simulations. On the other hand, observational evidence for pressure support is weak. Our analysis of DDO 154 finds that corrections for pressure support would make only minor changes to the interpretation of the observed rotation curve. Swaters et al. (2009) reaches a similar conclusion for the dwarf irregulars in the Swaters et al. (2002) sample, which have .
These apparent contradictions must arise from limitations in the various analyses. Each of the approaches for assessing pressure support come with a number of caveats, which we now discuss.
5.1. Limitations of Observations of Pressure Support
Assessing the importance of turbulent pressure support requires knowledge of the radial turbulent velocity dispersion, the gas surface density, and the tangential rotation speed. Unfortunately, observations cannot measure all of these quantities within a single galaxy. Instead, we are forced to make several approximations, none of which may be completely satisfactory.
The first approximation is the use of the line-of-sight Hi velocity dispersion as a substitute for the radial velocity dispersion. There is no reason to believe that the velocity dispersion of the gas is strictly isotropic, given the very different boundary conditions for motions within the plane compared to motions in the vertical direction. The amplitude of may therefore be systematically different from the line-of-sight dispersion measured in nearly face-on galaxies. Adaptive mesh simulations of rotating disks by Agertz et al. (2009) find that the velocity dispersion in the plane of the galaxy is at least a factor of two higher than the vertical component of the velocity dispersion. Because the importance of pressure support scales as , using the measured vertical velocity dispersion () may significantly underestimate the degree of pressure support, as can be seen from the prefactor of the term in brackets in equation 9. Assuming a factor of two difference between and , the degree of pressure support for a galaxy with may actually be as high as that calculated for a galaxy with . Note that the term within the brackets in equation 9 will be unlikely to change significantly if is used as an estimate for , since (1) the logarithmic gradient in is likely to be similar between the two directions, assuming that the shape of the velocity ellipsoid varies slowly with radius; and (2) the gradient in contributes less to the pressure gradient than the gradient in surface density, and thus uncertainties in the velocity dispersion gradient are not likely to dominate the error budget.
Also concerning is that the line-of-sight Hi velocity dispersion only tracks one particular phase of the gas. Thus, Hi velocity dispersions are likely to be biased tracers of the velocity dispersion in regions of the galaxy that have significant molecular or ionized gas fractions. These other phases are known to have different scale heights than the Hi (see review by van der Hulst, 1996), and thus must have different characteristic velocity dispersions. Unfortunately, data on these other phases have historically been far more difficult to obtain than HI. Some hope for using only HI observations comes from recent grid-based hydrodynamic simulations by Joung et al. (2009), who find that different gas phases tend to come into turbulent pressure equilibrium (mirroring what has long been known for their thermal pressures). Thus, measuring the atomic turbulent pressure alone may provide an indirect estimate of the pressure from molecular and ionized phases.
In addition to the challenge of measuring turbulent velocities, there are also difficulties in comparing the observed tangential velocities to analytic calculations, due to the presence of non-circular motions. Analytic calculations assume that the gas moves on perfect circular orbits, and thus has no radial streaming motions which could otherwise support the radial extent of the disk. However, most late-type galaxies show some evidence for non-circular motions at the 5- level (e.g., Gentile et al., 2005; Trachternach et al., 2008), which is comparable to the typical amplitudes of turbulent velocities. Thus, when significant non-circular motions are present, the assessment of the importance of pressure support becomes more complicated than assumed in most calculations. Unfortunately, it seems that non-circular motions are almost always present in dwarf galaxies, particularly at the low masses where pressure support is most likely to be significant. In our search for a suitable galaxy to compare with our calculations (Section 4), it proved to be difficult to find low mass galaxies for which the velocity fields do not appear to deviate from what is expected for a simple rotating disk. Signatures of warps and elliptical streaming motions were sufficiently common that only one system barely qualified.
The difficulty of finding approrpiate systems for evaluating pressure support is even worse in lower mass galaxies than DDO 154. Although these systems would potentially have the most dramatic evidence for pressure support, they also have increasingly chaotic velocity fields (see Lo et al., 1993; Begum et al., 2008), making the measurement of the tangential velocities as complicated as measuring the radial velocity dispersion. Furthermore, the gas disks of low mass galaxies frequently appear to be far from equilibrium. The presence of dramatic Hi holes (e.g., see reviews by Brinks et al., 2007; van der Hulst, 1996) and complicated velocity fields indicates that the entire basis of the calculation (i.e., a disk in equilibrium) may be suspect.
There are equally large limitations in measuring the gas surface density. The easiest gas component to measure is atomic Hydrogen through the 21cm line. However, molecular and ionized gas also contribute to the turbulent pressure, but are far more difficult to measure. Molecular gas in particular is extremely challenging to identify in late-type galaxies, for which there are few CO detections, in spite of copious evidence for star formation (Israel et al., 1995; Matthews et al., 2005; Das et al., 2006; Leroy et al., 2005). The lack of CO detections most likely arises from factor of ten variations in the conversion factor from CO to H2, rather than any lack of molecular gas (e.g., Ohta et al., 1993; Arimoto et al., 1996; Israel, 1997; Madden et al., 1997; Boselli et al., 2002; Leroy et al., 2007). Thus, the true contribution of H2 to the turbulent pressure is particularly difficult to constrain in the systems where it is most important. Approximating the molecular gas distribution by scaling the Hi observations is unsatisfactory as well, since the ratio of H2 to Hi is known to vary spatially within galaxies (Wong & Blitz, 2002; Leroy et al., 2008, e.g.,).
The ionized gas component is as difficult to constrain as the molecular. Hot SN-heated gas is likely to fill the Hi “holes” that are prevalent in dwarf galaxies. However, x-ray detections of such gas are prohibitively expensive. On the other hand, hot gas appears to be a small fraction of the total mass in the Milky Way disk (e.g., Ferriere, 1998), suggesting that it may not necessarily be a significant source of pressure in dwarfs, provided one can safely extrapolate these results to such a different mass regime.
5.2. Limitations of Simulations of Pressure Support
The pressure support in a stable galaxy disk depends on the properties of the interstellar turbulence. This turbulence is thought to be driven by various forms of stellar feedback (winds, SNe, etc), which inject energy into the ISM over a range of physical scales (see reviews by Elmegreen & Scalo, 2004; Mac Low & Klessen, 2004). This energy then cascades to an even wide range of scales, forming a broad power spectrum of turbulent energies. The pressure that results from the turbulence thus depends on the sum of kinetic energy across a wide range of length scales.
Unfortunately for simulations, it appears that the vast majority of the kinetic energy is due to tubulent motions on scales smaller than 200 (Joung & Mac Low, 2006). These small scales have been successfully resolved using either adaptive mesh refinement (AMR) or smoothed particle hydrodynamic (SPH) codes (e.g., Price & Federrath, 2010), but only for simulations that model a small portion of the disk. While these high-resolution simulations can resolve the physical scales that dominate the turbulent energy, the same codes have difficulty simultaneoulsy simulating the large scale behavior of the galactic disk and its cosmological environment. In constrast, simulations that capture the physics of the disk on larger scales cannot currently fully resolve the “subgrid physics” of turbulence.
To explore the suitability of simulations for assessing the amplitude of pressure support, we will consider two state of the art simulations. The first is the suite of SPH simulations used by Valenzuela et al. (2007) to argue for the significance of pressure support, feedback, projection effects, and non-circular motions in explaining the discrepancy between observed rotation curves and the canonical NFW profile. The second is the AMR simulation of Joung et al. (2009) used to assess the scaling between pressure and star formation rate in self-gravitating stratified gas layers.
The Valenzuela et al. (2007) SPH simulations modeled a moderately low mass dwarf galaxy, created to be an analog of nearby dwarf irregular galaxies (). Their initial conditions embedded a mixed gasstar disk within a live axisymmetric NFW dark matter halo. Their model was then evolved using the SPH code GASOLINE (Wadsley et al., 2004) for . Because their simulation considered an isolated disk evolved for a short period of time, the galaxy is unaffected by any larger scale gravitational forces or long term evolution driven by interactions with other galaxies. These restrictions allowed them to use a large number of particles (2 million) and a small softening length (), such that Newtonian forces were reached beyond . The resulting gas disk successfully reproduces the holes and filaments that are characteristic of many dwarf galaxies, and has a slowly rising rotation curve, in spite of being embedded within a true NFW profile.
Unfortunately, even these carefully crafted simulations do not seem to be fully capturing the effects of pressure support. The midplane velocity field (their Figure 1) shows coherent rotational flow with significant radial velocities in the inner regions. However, it shows none of the fully turbulent motion that likely dominates the interstellar pressure. Comparing their effective force resolution () to the scales where the turbulent kinetic energy dominates () suggests that they are unlikely to have resolved the full amplitude of the turbulent pressure333Note that the difficulty in resolving the pressure is likely to become even more severe at higher star formation rates, which appear to shift the kinetic energy spectrum to even shorter characteristic length scales (Joung et al., 2009).. Thus, their success in reproducing slowly rising rotation curves is likely due to the dominance of the other effects they identified, rather than turbulent pressure. While this work leaves open the question of the amplitude of pressure support, it does point to mechanisms which may well cause the apparent discrepancies in higher mass galaxies where pressure is expected to be negligible.
In constrast, the Joung et al. (2009) AMR simulations do a superb job of resolving the turbulent motions down to very small scales (2). However, this high spatial resolution comes at the expense of not modeling the full galactic disk. Instead, they simulate small patches of a vertically stratified gas layer, on a side, with periodic boundary conditions in the plane. These simulations therefore are unable to capture radial flows or shear fields, and must view the disk in steady state. There are also several limitations in the simulation, such as the lack of correlation between local density and the local SN rate, which may contribute to the simulations’ apparent failure to reproduce the large holes seen in HI observations.
On the other hand, the Joung et al. (2009) simulations do offer a number of lessons for thinking about turbulent pressure in general. First, both the thermal and turbulent pressures appear to be in pressure equilibrium across phases, such that the turbulent pressure of the hot gas is comparable to the turbulent pressure of the cold gas on the larger scales where the turbulent pressure dominates. The net result is that pressure shows much lower variation with position than either density or temperature. Second, the turbulent pressure scales with the star formation rate, since both are correlated with energy input from SNe. This scaling relationship provides a means to potentially capture the subgrid physics of turbulence, which is otherwise unresolved in SPH simulations (Joung et al., 2009). The next generation of SPH simulations may thus have the power to capture both the large scale galactic context provided by SPH, while better assessing the degree of pressure support.
5.3. Limitations of Analytic Calculations of Pressure Support
The analytic calculations presented in Section 2 require a number of compromises that are made for analytic expediency, but that probably fail to capture some of the relevant physics. First, as discussed in Section 5.1, gas in real low mass galaxies shows significant deviations from pure circular motion, in contrast to what is assumed in Section 2. Bulk non-circular motions add an additional term to the Jeans equation, which is not accounted for in our calculations. The simulations in Valenzuela et al. (2007) show a significant contribution from non-circular motion, that leads to a reduction in the inner rotation curve. Second, the presence of holes and warps suggest that low mass galaxy disks are frequently not in a steady-state equilibrium, again in conflict with the analytic assumptions. Third, the derivations in Sections 2 & 3 assume that the gas disk has no significant viscosity, velocity anisotropy, or tilt in the velocity ellipsoid. Finally, we ignore any support due to thermal pressure, which dominates only on smaller scales and lower pressures
6. Conclusions
The calculations above suggest that in low mass galaxies with , gas pressure may help to support the disk against the inward force of gravity. In such cases, the observed tangential velocity of rotation curve tracers like Hii or Hi will be smaller than the circular velocity of an idealized test particle, leading to underestimates of the mass contained within a given radius. Accounting for pressure gradients in the gas may lead to higher mean densities and steeper inner halo profile slopes for low mass galaxies, thus reducing possible conflicts with CMD on small scales. Pressure support can be maintained over long time scales, even in the presence of star formation. In such cases, the reduction in pressure support due to central star formation leads to an inward flow of gas, which then re-establishes pressure support.
However, while our calculations suggest that pressure gradients could help support the centers of low mass galaxies, we find that there are many obstacles to ever establishing convincing observational or numerical evidence for pressure’s importance. Pressure support depends on the radial velocity dispersion of the entire ISM, but measurements are typically limited to measuring only the vertical velocity dispersion of the Hi. In addition, the effects of complex non-circular motions and evolving superbubbles may dominate the structure of the gas disk, making corrections based on simple steady-state circular models invalid in the low mass galaxies within which we expect pressure to have the largest impact. Likewise, simulations currently do not have sufficient resolution to simultaneously capture both the large scale galaxy dynamics and the small scale interstellar turbulence which dominates the pressure. In light of these caveats, while we consider pressure support to be an intriguing mechanism to reduce tensions with CDM on small scales, it is by no means a conclusive solution to current concerns. Other proposed mechanisms (e.g., Governato et al., 2010) may play an equally or more important role.
References
- Agertz et al. (2009) Agertz, O., Lake, G., Teyssier, R., Moore, B., Mayer, L., & Romeo, A. B. 2009, MNRAS, 392, 294.
- Alam et al. (2002) Alam, S. M. K., Bullock, J. S., & Weinberg, D. H. 2002, ApJ, 572, 34
- Allsopp (1979) Allsopp, N. J. 1979, MNRAS, 188, 765
- Arimoto et al. (1996) Arimoto, N., Sofue, Y., & Tsujimoto, T. 1996, PASJ, 48, 275
- Begum et al. (2008) Begum, A., Chengalur, J. N., Karachentsev, I. D., Sharina, M. E., & Kaisin, S. S. 2008, MNRAS, 386, 1667.
- Bigiel et al. (2008) Bigiel, F., Leroy, A., Walter, F., Brinks, E., de Blok, W. J. G., Madore, B., & Thornley, M. D. 2008, AJ, 136, 2846.
- Boselli et al. (2002) Boselli, A., Lequeux, J., & Gavazzi, G. 2002, Ap&SS, 281, 127
- Bottema et al. (1986) Bottema, R., Shostak, G. S., & van der Kruit, P. C. 1986, A&A, 167, 34
- Boulares & Cox (1990) Boulares, A., & Cox, D. P. 1990, ApJ, 365, 544
- Brinks et al. (2007) Brinks, E., Bagetakos, I., Walter, F., & de Blok, E. 2007, in IAU Symposium, Vol. 237, IAU Symposium, ed. B. G. Elmegreen & J. Palous, 76–83
- Carignan & Puche (1990) Carignan, C., & Puche, D. 1990, AJ, 100, 394
- Colín et al. (2004) Colín, P., Klypin, A., Valenzuela, O., & Gottlöber, S. 2004, ApJ, 612, 50.
- Côté et al. (2000) Côté, S., Carignan, C., & Freeman, K. C. 2000, AJ, 120, 3027
- Courteau (1997) Courteau, S. 1997, AJ, 114, 2402.
- Das et al. (2006) Das, M., O’Neil, K., Vogel, S. N., & McGaugh, S. 2006, ApJ, 651, 853.
- de Avillez & Breitschwerdt (2005) de Avillez, M. A., & Breitschwerdt, D. 2005, A&A, 436, 585.
- de Blok (2009) de Blok, W. J. G. 2009, ArXiv e-prints, 0910.3538
- de Blok et al. (2008a) de Blok, W. J. G., Walter, F., Brinks, E., Trachternach, C., Oh, S., & Kennicutt, R. C. 2008a, AJ, 136, 2648.
- Dib et al. (2006) Dib, S., Bell, E., & Burkert, A. 2006, ApJ, 638, 797
- Dubinski & Carlberg (1991) Dubinski, J., & Carlberg, R. G. 1991, ApJ, 378, 496
- Elmegreen & Scalo (2004) Elmegreen, B. G., & Scalo, J. 2004, ARA&A, 42, 211
- Ferriere (1998) Ferriere, K. 1998, ApJ, 503, 700
- Firmani et al. (1996) Firmani, C., Hernandez, X., & Gallagher, J. 1996, A&A, 308, 403
- Gentile et al. (2005) Gentile, G., Burkert, A., Salucci, P., Klein, U., & Walter, F. 2005, ApJ, 634, L145
- Governato et al. (2010) Governato, F. et al. 2010, Nature, 463, 203
- Hayashi et al. (2004) Hayashi, E. et al. 2004, MNRAS, 355, 794
- Israel (1997) Israel, F. P. 1997, A&A, 328, 471
- Israel et al. (1995) Israel, F. P., Tacconi, L. J., & Baas, F. 1995, A&A, 295, 599
- Joung & Mac Low (2006) Joung, M. K. R., & Mac Low, M. 2006, ApJ, 653, 1266
- Joung et al. (2009) Joung, M. R., Mac Low, M., & Bryan, G. L. 2009, ApJ, 704, 137
- Kalnajs (1983) Kalnajs, A. J. 1983, in IAU Symposium, Vol. 100, Internal Kinematics and Dynamics of Galaxies, ed. E. Athanassoula, 109–115
- Kennicutt (1998) Kennicutt, Jr., R. C. 1998, ARA&A, 36, 189
- Kent (1986) Kent, S. M. 1986, AJ, 91, 1301
- Kregel et al. (2004) Kregel, M., van der Kruit, P. C., & de Blok, W. J. G. 2004, MNRAS, 352, 768
- Kuzio de Naray et al. (2008) Kuzio de Naray, R., McGaugh, S. S., & de Blok, W. J. G. 2008, ApJ, 676, 920
- Kuzio de Naray et al. (2009) Kuzio de Naray, R., McGaugh, S. S., & Mihos, J. C. 2009, ApJ, 692, 1321
- Leroy et al. (2007) Leroy, A., Bolatto, A., Stanimirovic, S., Mizuno, N., Israel, F., & Bot, C. 2007, ApJ, 658, 1027
- Leroy et al. (2005) Leroy, A., Bolatto, A. D., Simon, J. D., & Blitz, L. 2005, ApJ, 625, 763
- Leroy et al. (2008) Leroy, A. K., Walter, F., Brinks, E., Bigiel, F., de Blok, W. J. G., Madore, B., & Thornley, M. D. 2008, AJ, 136, 2782
- Lo et al. (1993) Lo, K. Y., Sargent, W. L. W., & Young, K. 1993, AJ, 106, 507
- Mac Low & Klessen (2004) Mac Low, M., & Klessen, R. S. 2004, Reviews of Modern Physics, 76, 125
- Macciò et al. (2008) Macciò, A. V., Dutton, A. A., & van den Bosch, F. C. 2008, MNRAS, 391, 1940
- Madden et al. (1997) Madden, S. C., Poglitsch, A., Geis, N., Stacey, G. J., & Townes, C. H. 1997, ApJ, 483, 200
- Mathewson et al. (1992) Mathewson, D. S., Ford, V. L., & Buchhorn, M. 1992, ApJS, 81, 413
- Matthews et al. (2005) Matthews, L. D., Gao, Y., Uson, J. M., & Combes, F. 2005, AJ, 129, 1849
- Meurer et al. (1996) Meurer, G. R., Carignan, C., Beaulieu, S. F., & Freeman, K. C. 1996, AJ, 111, 1551
- Moore et al. (1998) Moore, B., Governato, F., Quinn, T., Stadel, J., & Lake, G. 1998, ApJ, 499, L5+
- Navarro et al. (1996) Navarro, J. F., Eke, V. R., & Frenk, C. S. 1996, MNRAS, 283, L72
- Navarro et al. (1997) Navarro, J. F., Frenk, C. S., & White, S. D. M. 1997, ApJ, 490, 493
- Navarro et al. (2004) Navarro, J. F. et al. 2004, MNRAS, 349, 1039
- Navarro et al. (2008) ——. 2008, ArXiv e-prints, 0810.1522
- Ohta et al. (1993) Ohta, K., Tomita, A., Saito, M., Sasaki, M., & Nakai, N. 1993, PASJ, 45, L21
- Price & Federrath (2010) Price, D. J., & Federrath, C. 2010, ArXiv e-prints, 1004.1446
- Puche et al. (1992) Puche, D., Westpfahl, D., Brinks, E., & Roy, J. 1992, AJ, 103, 1841
- Rhee et al. (2004) Rhee, G., Valenzuela, O., Klypin, A., Holtzman, J., & Moorthy, B. 2004, ApJ, 617, 1059
- Roychowdhury et al. (2010) Roychowdhury, S., Chengalur, J. N., Begum, A., & Karachentsev, I. D. 2010, MNRAS, 404, L60
- Sellwood (2009) Sellwood, J. A. 2009, in IAU Symposium, Vol. 254, IAU Symposium, ed. J. Andersen, J. Bland-Hawthorn, & B. Nordström, 73–84
- Skillman et al. (1987) Skillman, E. D., Bothun, G. D., Murray, M. A., & Warmels, R. H. 1987, A&A, 185, 61
- Sofue & Rubin (2001) Sofue, Y., & Rubin, V. 2001, ARA&A, 39, 137
- Spano et al. (2008) Spano, M., Marcelin, M., Amram, P., Carignan, C., Epinat, B., & Hernandez, O. 2008, MNRAS, 383, 297
- Spekkens et al. (2005) Spekkens, K., Giovanelli, R., & Haynes, M. P. 2005, AJ, 129, 2119
- Spekkens & Sellwood (2007) Spekkens, K., & Sellwood, J. A. 2007, ApJ, 664, 204
- Stadel et al. (2009) Stadel, J., Potter, D., Moore, B., Diemand, J., Madau, P., Zemp, M., Kuhlen, M., & Quilis, V. 2009, MNRAS, 398, L21
- Stinson et al. (2009) Stinson, G. S., Dalcanton, J. J., Quinn, T., Gogarten, S. M., Kaufmann, T., & Wadsley, J. 2009, MNRAS, 395, 1455
- Swaters & Balcells (2002) Swaters, R. A., & Balcells, M. 2002, A&A, 390, 863
- Swaters et al. (2009) Swaters, R. A., Sancisi, R., van Albada, T. S., & van der Hulst, J. M. 2009, A&A, 493, 871
- Swaters et al. (2002) Swaters, R. A., van Albada, T. S., van der Hulst, J. M., & Sancisi, R. 2002, A&A, 390, 829
- Tamburro et al. (2009) Tamburro, D., Rix, H., Leroy, A. K., Low, M., Walter, F., Kennicutt, R. C., Brinks, E., & de Blok, W. J. G. 2009, AJ, 137, 4424
- Trachternach et al. (2008) Trachternach, C., de Blok, W. J. G., Walter, F., Brinks, E., & Kennicutt, R. C. 2008, AJ, 136, 2720
- Tully et al. (1978) Tully, R. B., Bottinelli, L., Fisher, J. R., Gougenheim, L., Sancisi, R., & van Woerden, H. 1978, A&A, 63, 37
- Valenzuela et al. (2007) Valenzuela, O., Rhee, G., Klypin, A., Governato, F., Stinson, G., Quinn, T., & Wadsley, J. 2007, ApJ, 657, 773
- van Albada & Sancisi (1986) van Albada, T. S., & Sancisi, R. 1986, Royal Society of London Philosophical Transactions Series A, 320, 447
- van der Hulst (1996) van der Hulst, J. M. 1996, in Astronomical Society of the Pacific Conference Series, Vol. 106, The Minnesota Lectures on Extragalactic Neutral Hydrogen, ed. E. D. Skillman, 47–+
- Wada et al. (2002) Wada, K., Meurer, G., & Norman, C. A. 2002, ApJ, 577, 197
- Wadsley et al. (2004) Wadsley, J. W., Stadel, J., & Quinn, T. 2004, New Astronomy, 9, 137
- Walter et al. (2008) Walter, F., Brinks, E., de Blok, W. J. G., Bigiel, F., Kennicutt, R. C., Thornley, M. D., & Leroy, A. 2008, AJ, 136, 2563
- Weiner et al. (2001) Weiner, B. J., Sellwood, J. A., & Williams, T. B. 2001, ApJ, 546, 931
- Wong & Blitz (2002) Wong, T., & Blitz, L. 2002, ApJ, 569, 157
- Zánmar Sánchez et al. (2008) Zánmar Sánchez, R., Sellwood, J. A., Weiner, B. J., & Williams, T. B. 2008, ApJ, 674, 797
- Zentner & Bullock (2003) Zentner, A. R., & Bullock, J. S. 2003, ApJ, 598, 49