Limits on the quiescent radio emission from the black hole binaries GRO J1655-40 and XTE J1550-564
Abstract
We present the results of radio observations of the black hole binaries GRO J and XTE J in quiescence, with the upgraded Australia Telescope Compact Array. Neither system was detected. Radio flux density upper limits (3 ) of 26 Jy (at 5.5 GHz), 47 Jy (at 9 GHz) for GRO J, and 1.4 mJy (at 1.75 GHz), 27 Jy (at 5.5 GHz), 47 Jy (at 9 GHz) for XTE J were measured. In conjunction with quasi-simultaneous Chandra X-ray observations (in the case of GRO J) and Faulkes Telescope optical observations (XTE J) we find that these systems provide the first evidence of relatively ‘radio quiet’ black hole binaries at low luminosities; indicating that the scatter observed in the hard state X-ray:radio correlation at higher luminosities may also extend towards quiescent levels.
keywords:
black hole physics – binaries: close – stars: individual, XTE J. GRO J – ISM: jets and outflows – X-rays: binaries1 Introduction
Observations of accreting black holes (BHs) over the past decades have revealed the existence of spectral and temporal correlations between emission at different wavelengths, both in X-ray binaries (XRBs), and active galactic nuclei (AGN). Such relations allow us to investigate the nature of interactions between the coupled components that we believe make up these systems: accretion discs, coronae, jets and the BHs. The correlations highlight the association of accretion onto a compact object with an outflowing jet. Both these properties are observed when dealing with BHs and form an important method of energy transfer from compact sources to the surrounding environment. For reviews of the topic see Belloni (2007), Done, Gierliński and Kubota (2007), and Markoff (2009).
Generally, when speaking of accretion and outflow activity in BH systems we are referring to emission in the X-ray and radio wavebands, with the radio component arising from synchrotron emission within a well collimated jet (Hjellming & Han 1995) and X-rays originating from various possible sources, including the jets themselves, the hot inner disc and a Comptonising corona (Markoff, Falcke & Fender 2001; Remillard & McClintock 2006). Prior to the inclusion of radio jets into the standard concept of BHXRB accretion, system states were defined by the behaviour of the observed X-ray spectrum (for a review of X-ray states see Remillard and McClintock 2006). Most notable of the states are the hard state, named for the dominance of a power-law over the softer quasi-thermal component from the disk, and the soft state in which quasi-thermal component dominates. The state of a BH system also has an effect on the observed radio emission. Typically, a source in the hard state exhibits steady, flat-spectrum radio emission (e.g. Fender et al. 2001), whereas a soft state source shows little or no radio emission (Fender et al. 1999). Transitions between these two states are associated with radio flares.
Understanding of the relationship between the X-ray and radio regimes of black hole systems has significantly improved in recent years due to a number of works which combine observations from both bands, or present the results of simultaneous (important for BHXRBs) multi-wavelength campaigns (Corbel et al. 2003; Gallo, Fender & Pooley 2003; Falcke, Körding & Markoff 2004; Merloni, Heinz & di Matteo 2003, henceforth Co03, GFP03, FKM04 and MHdM03 respectively). Correlations have been observed between the radio and X-ray luminosities of hard state systems. Co03 used long term simultaneous radio and X-ray observations of GX 339-4 to reveal the relation LR LX0.7. This relationship was explored further by GFP03 investigating multiple binary sources. The same correlation was discovered to hold for another BHXRB, V404 Cyg, as well as a combination of points from additional sources (each additional source alone provided too few data points to reveal a relationship) indicating a correlation over 3 orders of X-ray magnitude. The basic characteristics of the X-ray and radio behaviours appear to be independent of BH mass, with similarities appearing between stellar mass BHs and their super-massive counterparts residing within galactic nuclei. This fact prompted further expansion of the correlation to include BHs of all sizes by MHdM03 and FKM04; they found that the inclusion of a BH mass term allowed for a new relationship to emerge, and the subsequent discovery of a “fundamental plane of black hole activity” characterised approximately by LR LX0.6MBH0.8.
As with any correlation, knowledge of the extremes can help greatly in further refining a fit, and additionally, the lower extreme of this relationship corresponds to a source regime where the dominant power output is of the form of radiatively inefficient outflows i.e. jet dominated (Fender, Gallo & Jonker 2003, Körding, Fender & Migliari 2006). Indeed, it may be that all hard state sources are jet dominated (Gallo et al. 2005). The possibility that the correlation between radio and X-ray extends all the way down to systems at quiescent levels should not be entirely unexpected as the quiescent state is often described as merely the hard state but at minimal accretion rates (though further differences are being uncovered; Corbel, Körding and Kaaret 2008). A quiescent binary system would likely still keep a jet, though of such low luminosity it would be difficult to detect with all but the most powerful radio telescopes (Jy level flux; GFP03).
The investigation into this regime has already met with success in the observation of A0620-00 in quiescence by Gallo et al. (2006). The flux measurements allowed for the expansion of the fundamental plane by a full two orders of magnitude in both radio and X-ray luminosities, as well as refining the correlation gradient; LR LX0.58±0.16. V404 Cyg has also been observed in ‘quiescence’ (Gallo, Fender & Hynes 2005) although it is considerably more luminous than other quiescent binaries. The next best sources for observation are the low-mass X-ray binaries GRO J and XTE J, based on distance and relative brightness (see GFP03).
1.1 GRO J1655-40
GRO J was discovered in 1994 as it went into outburst (Zhang et al. 1994) observed by the Burst and Transient Source Experiment (BATSE) aboard the Compton Gamma Ray Observatory. Radio observations revealed apparent superluminal jets (Hjellming & Rupen 1995, Tingay et al. 1995), only the second time such a phenomena had been observed from a binary source (there are now other examples). Analysis of optical observations of the system in quiescence yielded primary and secondary masses of 5.4 0.3 and 1.45 0.35 M⊙, respectively (Beer & Podsiadlowski 2002), with the primary’s mass exceeding the maximum limit for a neutron star, supporting a black hole classification. During this initial outburst the system was observed simultaneously at X-ray and radio wavelengths (Harmon et al. 1995) clearly showing relativistic ejection events following X-ray flares from the system. The system has also recently been observed in X-rays during quiescence (Pszota et al. 2008) where power law fits gave a flux of 6 erg s-1 cm-2 (0.5 - 10 keV). GRO J remained in quiescence when we observed, making it an ideal target for exploring the lower limits of the fundamental plane.
1.2 XTE J1550-564
XTE J was discovered in September 1998 (Smith 1998) with the All-Sky Monitor (ASM) aboard the Rossi X-ray Timing Explorer (RXTE), eventually reaching 6.8 Crab as detected by the RXTE (Remillard et al. 1998). Subsequent observations by Orosz et al. (2002) found the compact object’s mass to be M 10.1 1.5 M⊙: far greater than the stable neutron star limit. Radio observations of the 1998 outburst also showed evidence of relativistic jets, found to decelerate over time (Corbel et al. 2002). Interestingly, the jets were also seen in X-rays and extrapolation of radio fluxes suggested that much of the X-ray emission may come from the same relativistic electron population that produces the radio component: directly revealing the transfer of kinetic energy from the jets to accelerating particles towards TeV energies. XTE J is also in its quiescent state (Corbel, Tomsick & Kaaret 2006), observed at its faintest in X-rays to date (2 erg s-1 at 0.5 - 10 keV) and with a spectrum that can be adequately fitted with a power law. Like GRO J, XTE J’s distance and luminosity make it an ideal candidate for expanding the fundamental plane.
2 Observations & Data Reduction
Our goal was to determine the radio luminosity of the two black hole candidates using ATCA, (quasi-)simultaneously with an estimate of the X-ray flux. For GRO J we were able to do this directly with a near-simultaneous Chandra observation. In the case of XTE J1550-564 we used contemporaneous optical observations to indirectly estimate the X-ray flux via the X-ray:optical relations established in Russell et al. (2006) as well as use of past X-ray flux measurements from observations of the system in quiescence.
2.1 GRO J1655-40
2.1.1 Radio
Observations of GRO J were carried out on 2009 Jun 07 using the upgraded ATCA-CABB in 6A configuration. PKS 1934-638 was used as the primary/amplitude calibrator and 1729-37 (PMN J1733-3722) as the secondary/phase calibrator. Observations began at 07:31:25 UT (with actual source observations from 07:49:15 UT) and ended at 19:00:55 UT with time on the source being approximately 32.8 ks, giving predicted RMS noise of 6 and 8 Jy (using the ATCA Observing Characteristics Calculator at http://www.atnf.csiro.au/observers/docs/at_sens/) for the 5.5 and 9 GHz bands respectively (both with full 2 GHz CABB bandwidths). There was some radio frequency interference (RFI) evident in the second quarter of data at 5.5 GHz data and first quarter of 9 GHz data which was thoroughly flagged prior to image production. Inversion was straightforward and cleaning was carried out using a combination of MFCLEAN (multi-frequency: Sault and Wieringa 1994) and original CLEAN (Högbom 1974) subroutines. All data and image processing was carried out in MIRIAD (Sault, Teuben and Wright 1995).
2.1.2 X-ray
Chandra observations (using the ACIS-S detector in very faint mode) of GRO J took place on the 2009 Jun 08 02:27:18 (UT) for 20.7 ks (18.2 ks effective exposure) and ended at 08:11:42, 7.5 hours after ATCA observations finished, making them near-simultaneous. The analysis was carried out on the standard pipeline output level 2 data using CIAO version 4.1.2 (Fruscione et al. 2006). The data were also re-reduced manually in CIAO, with no significant difference to the pipeline output. No major background flares were detected. On source counts came to a total of 169, giving a net count rate of 9.310-3 counts s-1.
2.2 XTE J1550-564
2.2.1 Radio
Observations of XTE J took place on the 2009 Aug 04 (5.5 and 9 GHz) and 2009 Aug 06 (1.75 GHz) using the ATCA-CABB in 6D configuration. PKS 1934-638 and PKS 0823-500 were used as primary calibrators (PKS 0823-500 was only used where PKS 1934-638 data were unavailable or of bad quality) and PKS 1613-586 as the secondary calibrator. Observations on the 4th began at 02:45:00 UT (actual source observations began at 02:57:00 UT) and ended at 14:00:00 UT with approximately 33.8 ks on source. Observations on the 6th began at 02:02:30 UT, unfortunately during the run there were RFI related problems which required fixes to be made on-the-fly, subsequently resulting in observation interruptions and initial calibration errors. The observations ended at 13:59:00 UT with the final total on source time being 28.1 ks. Flagging, reduction and cleaning of the 5.5 and 9 GHz data were relatively straightforward; however the process for analysing the 1.75 GHz data was far more complicated. Approximately 75 of the data channels had to be removed because most of them displayed drops in amplitude to negligible levels. The remaining data underwent significant flagging to remove RFI spikes. The RMS in the 1.75 GHz images would therefore be significantly higher than initial predictions.
2.2.2 Optical
XTE J was observed with the EM03 camera on the 2-m Faulkes Telescope South located at Siding Spring in Australia, using the SDSS -band filter on the nights of 2009 Aug 04, 05 and 06. Observation conditions were particularly good on the nights of the 4th and 6th; however, they varied somewhat on the 5th limiting the usefulness of resultant images. Twenty-six 200s integrations were made on the 4th and stacked (using IRAF) into groups of three to improve signal to noise. Another 12 were produced on the 5th; unfortunately, many proved unusable (see section 3.1). Finally, 6 more images were obtained on the 6th. The images on target were de-biased and flat-fielded using the Faulkes pipeline. Calibration was carried out using known i’-band magnitudes of stars within the field from table 1 of Sánchez-Fernández et al. (1999). Typical uncertainty in the magnitudes is stated to be 0.01 magnitude.
3 Results
3.1 Flux Measurements
| Source | LX | Distance | X-ray Fν(1 kpc) | Predicted radio Fν | Measured “quiescent” Fν |
|---|---|---|---|---|---|
| (1032 erg s-1) | (kpc) | (10-6 Crab) | (Jy) | (Jy(GHz)) | |
| A 0620-00 | 0.02a-0.04b (1,2) | 1.20.4 | 1-5 | 13-30 | 517(8.5) |
| GRO J | 0.2c-3d (1,3) | 3.20.2 | 6-82 | 5-30 | 26(5.5) |
| 47(9) | |||||
| XTE J | 2e (4) | 5.32.3 | 70 | 10 | 1400(1.75) |
| 27(5.5) | |||||
| 47(9) | |||||
| GRO J0422+32 | 0.08d (5) | 2.80.3 | 2 | 3 | Unobserved |
| GS 2000+25 | 0.02d (5) | 2.70.7 | 0.5 | 1 | Unobserved |
| GS 1009-45 | 0.12d (6) | 5.70.7 | 3 | 1 | Unobserved |
| XTE J1118+480 | 0.035c (7) | 1.80.6 | 1 | 4 | Unobserved |
| XTE J1859+226 | 0.14f (8) | 6.31.7 | 4.2 | 1 | Unobserved |
| GS 2023+338 | 16g (9) | 4.0 | 400 | 58 | 350(1.4-8.4) |
| (V404 Cyg) |
Energy ranges: a 0.4-2.4 keV;b 0.4-1.4 keV;c 0.3-7 keV;d 0.5-10 keV;e 0.5-7 keV;f 0.3-8 keV;g 1-10 keV.
References: (1) Kong et al. (2002); (2) Narayan, McClinktock & Yi (1996); (3) Asai et al. (1998); (4) Corbel, Tomsick & Kaaret (2006); (5) Garcia et al. (2001); (6) Hameury et al. (2003); (7) McClintock, Narayan & Rybicki (2004); (8) Tomsick et al. (2003); (9) Campana, Parmar & Stella (2001).
R.M.S. values for this work’s radio limits (column 6) were measured using the CGCURS routine (mean value of multiple image regions). It is evident that the severe flagging of the 1.75 GHz observations limited the quality of the images in that band.
Neither GRO J nor XTE J was detected in any of the ATCA radio observations. The 3 upper limit for each band is listed in column six of Table 1. We also see no extended structure in the 1.75 GHz images of XTE J as previously detected in Corbel et al. (2002).
GRO J is clearly detected by Chandra. We extracted spectra, binning the counts into rebinned channels with atleast 15 photons each. We attempted to fit several model spectra to the data using XSPEC, the results of which are listed in Table 2. Assuming a power law fit (see Figure 1) and allowing NH to vary results in a fitted value of NH = 2.0 cm-2 and a corresponding unabsorbed 2-10 keV flux of FX = 9.04 erg cm-2 s-1, which with the distance from Jonker & Nelemans (2004) (3.20.2 kpc) gives an X-ray luminosity of LX = 1.11 erg s-1. We also include power law fits with the Hydrogen column density fixed at previously calculated levels; Asai et al. (1998): NH 0.3 cm-2, and Kong et al. (2002): NH 0.9 cm-2. The fits yield slightly larger luminosity values of 1.2 erg s-1 and 1.5 erg s-1 respectively along with shallower power laws.
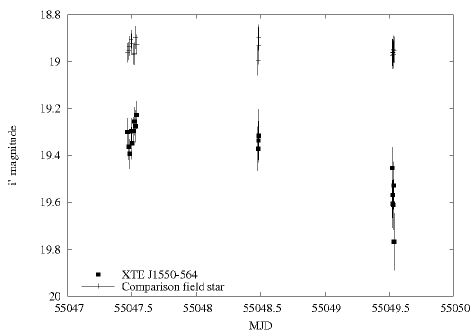
XTE J is easily detected in the Faulkes optical images on all three nights, for which we also compiled light curves. Little variability was detected in the source over the individual nights (the range of magnitudes is similar to the error on each magnitude); however, a noticeable drop in luminosity occurred on the third night (6th) of 0.3 magnitudes. It is possible that this variation is linked to orbital modulation (P 1.5 days, Orosz et al. 2002) or variation in accretion rate during quiescence. The magnitudes are consistent with the mean value obtained over 1.5 years of Faulkes Telescope monitoring (Lewis et al. 2008), implying the source was in quiescence at the time of observations.
Summarised optical results are listed in Table 3 and the light-curve for all three nights can be seen in Figure 2. Note that due to the variable conditions on the fifth we could only get 3 useful magnitudes out of the total 12 images.
| Model | NH | kT | (d.o.f.) | Null hypothesis probability | |
|---|---|---|---|---|---|
| (1022cm-2) | (keV) | ||||
| Power Law | 2.0 | 3.1 | – | 0.71(7) | 0.67 |
| Power Law | 0.3(fixed) | 0.9 | – | 4.5(7) | 10-4 |
| Power Law | 0.9(fixed) | 1.8 | – | 2.1(7) | 0.4 |
| Bremsstrahlung | 1.6 | – | 1.9 | 0.63(7) | 0.73 |
| Black-body | 1.3 | – | 0.9 | 0.59(7) | 0.76 |
| Date | mean i’ | 1 | mean error on each mag | de-red flux density | 1 | mean flux error |
|---|---|---|---|---|---|---|
| (mag) | (mag) | (mJy) | (mJy) | |||
| 2009-09-04 | 19.31 | 0.05 | 0.06 | 1.28 | 0.06 | 0.07 |
| 2009-09-05 | 19.34 | 0.03 | 0.10 | 1.24 | 0.03 | 0.12 |
| 2009-09-06 | 19.59 | 0.11 | 0.10 | 0.99 | 0.12 | 0.12 |
Though XTE J remained relatively stable during each observation period, the slight drop on the night of the 6th is evident.

3.2 Correlations
Using the values measured in the 5.5 GHz radio band and the quasi-simultaneous X-ray/optical measurements we can plot both upper limits along with other current detections of hard state BHs in the LR:LX plane (Figure 3).
In the case of XTE J we may extrapolate a predicted value for the X-ray luminosity using the relationship published in Russell et al. (2006). Within the paper it is shown that a correlation exists between the optical-infrared and X-ray band fluxes, approximated by the relation LOIR = 1013.1±0.6LX0.61±0.02 (see their Fig 1). Taking the mean optical flux value from the 2009 Aug 04, and subtracting the relative contribution of the secondary star in quiescence [LCS (LOIR); extrapolated from Orosz et al. 2002, Figure 4] we can then apply the relationship to crudely estimate the 2-10 keV X-ray luminosity of 6 erg s-1 at the time of observation.
Alternatively, we can combine our radio limit with recent quiescent X-ray observations; Corbel et al. (2006), under the assumption that the luminosity varies little during the quiescence. Corbel et al. (2006) supply a luminosity of 2 erg s-1 (0.5-10 keV) which we convert for 2-10 keV using the mission simulator WebPIMMS (http://heasarc.gsfc.nasa.gov/Tools/w3pimms.html) to get a Luminosity of 9 erg s-1: significantly lower than our estimate of 6 erg s-1.
The process for GRO J is straightforward in that the measured radio flux and X-ray luminosity can be converted and plotted directly on to the correlation graphs.
The points for both GRO J (purple circles) and XTE J (filled green triangles) lie at noticeably lower normalisations on the BHB plot than systems with similar X-ray luminosities (L erg s-1) from the previous ensemble of measurements: up to a full order of magnitude lower radio luminosity (in the case of XTE J). It is interesting to note that the only measurements of XTE J and GRO J at higher luminosities are also towards the ‘lower track’, which, when taking into account our new values, could be consistent with a LR L relation at a lower normalisation. The dashed lines marked on the plot illustrate this by extending the correlation gradient (0.6) from the previous measurements for the two sources. The fainter green triangle trailing off to the left of our XTE J estimate would be its position if we were to use the quiescent X-ray luminosity measured in Corbel et al. (2006). The result is a less dramatic scattering of points at lower luminosities.

3.3 Caveats
The best fitting power law model for our GRO J data provides a photon index of 3.1 which, given the large statistical errors, is broadly consistent with typical BH values ( 1.7 0.9; Kong et al. 2002). Examining the results outlined in Table 2 we might consider alternatives. The reduced statistic suggests that both Bremsstrahlung and black-body disk models are better fits to the data, though the blackbody model is made unlikely by an estimated inner disk radius of 0.2 km. Furthermore, in all models the column density value is higher than the majority of past references (only Sobczak et al. 2000 have such a high value: NH cm-2). However, the fit becomes progressively worse as NH is fixed lower, with the NH = 0.3 cm-2 being ruled out statistically.
We note that the small number of past observations of GRO J in quiescence have yielded X-ray luminosities (all using D 3.20.2 kpc) lower than those our power law model supplies; 3 erg s-1 and 5.9 erg s-1 for 0.5-10 keV in Asai et al. (1998) and Hameury et al (2003) respectively (our model gives 6 erg s-1) and 2.4 erg s-1 for 0.3-7 keV in Kong et al. (2002) (our model gives 1.1 erg s-1).
Justification of the XTE J result is more difficult since we are already dealing with a significant margin of error due to the OIR/X-ray extrapolation, and to a lesser extent the fraction of light contributed by the secondary star, which has not been measured well in band. In the case of the position of the XTE J point when using the past quiescent X-ray flux, we must remain aware that measurements of quiescent flux do appear to vary over three years and our assumption of little change during quiescence may be in error: though evidence for similar luminosities from distinct quiescent periods (between outbursts) is seen.
4 Discussion and Conclusions
Recent observations have revealed that at relatively high luminosities there is considerable scatter in the ‘universal’ hard state radio:X-ray correlation, with a number of sources appearing to be ‘radio quiet’ compared to GX 339-4 and V404 Cyg (e.g. XTE J: Corbel et al. 2004, XTE J: Brocksopp et al. 2005, SWIFT J: Cadolle-Bel et al. 2007). The upper limits on the quiescent radio luminosities of GRO J and XTE J presented here suggest that this range of normalisations for the correlation extends even to quiescent luminosities: had they followed an extrapolation of the GX 339-4 relation to A0620-00 they would certainly have been detected. Before this, the data could have been consistent with a narrow distribution of normalisations at low luminosities which would gradually broaden as the luminosity increased. In fact an explanation for exactly such a pattern of broadening distribution with luminosity) is put forward by Soleri & Fender (in prep.) wherein an increasing bulk Lorentz factor with luminosity results in increasing beaming. With the inclusion of our data points the scatter appears to exist all the way down to quiescent levels. In addition, GRO J and XTE J1550-564 are both sources which have been observed previously to be rather ‘radio quiet’ in higher luminosity hard states. It is possible that these two sources may be slightly more ‘radio quiet’ than the majority, and as such lie along a separate parallel track.
As mentioned before, the scatter at lower luminosities is reduced if we use previous quiescent X-ray flux measurements instead of the value derived from our simultaneous optical observations. In this case XTE J resides close to the higher luminosity track: yielding less evidence towards the ‘parallel track’ scenario. A scatter still exists with GRO J, but of lower magnitude in comparison to the higher luminosity region. The use of upper limits prevents us from seeing the full extent of the scatter, thus we cannot be sure if it truly decreases towards lower luminosities.
The low luminosity region of the BHB X-ray:radio correlation remains sparsely populated, as does the same region in the “fundamental plane of black hole activity”. It is only with further observations of quiescent systems that we can continue to test not only the validity of GFP03 correlation, but also the possibility, as suggested above, of the correlation power law index being universal while normalisation can vary. Table 1 summarizes the current information on radio detections and limits on black holes in quiescence. As well as tabulating our limits, and the detections of A 0620-00 and V404 Cyg, we refresh the predictions of GFP03, revising distances where appropriate, and adding new sources. Currently, the list of feasible targets at these levels is limited by the capabilities of available telescopes. However with many new upgrades such as the CABB (e.g. E-VLA) and new arrays (LOFAR, ASKAP, MeerKAT etc.) being completed in coming years, the low luminosity region will become far more open to exploration.
5 Acknowledgments
D.E.C. is supported by an STFC studentship. D.M.R. acknowledges support from a Netherlands Organisation for Scientific Research (NWO) Veni Fellowship. E.G. is supported through Hubble Postdoctoral Fellowship grant number HST-HF-01218.01-A from the Space Telescope Science Institute, operated by AURA under NASA contract NAS5-26555. The Australia Telescope Compact Array is part of the Australia Telescope which is funded by the Commonwealth of Australia for operation as a National Facility managed by CSIRO. F.L. would like to acknowledge support from the Dill Faulkes Educational Trust. We thank Harvey Tananbaum for allocating Chandra Director’s Discretionary Time to observe GRO J (ObsID: 10907). This research made use of software provided by the Chandra X-ray Center (CXC) in the application packages CIAO and ChIPS. The Faulkes Telescope Project is an educational and research arm of the Las Cumbres Observatory Global Telescope (LCOGT).
References
- [1] Asai, K., Dotani, T., Hoshi, R., Tanaka, Y., Robinson, C.R., & Terada, K., 1998, PASJ, 50, 611
- [2] Beer, M.E., & Podsiadlowski, P., 2002, MNRAS, 331, 351
- [3] Belloni, T., 2007, MmSAI, 78, 652
- [4] Brocksopp, C., Corbel, S., Fender, R.P., Rupen, M., Sault, R., Tingay, S.J., Hannikainen, D., & O’Brien, K., 2005, MNRAS, 356, 125
- [5] Cadolle-Bel, M., Ribó, M., Rodriguez, J., Chaty, S., Corbel, S., Goldwurm, A., Frontera, F., Farinelli, R., D’Avanzo, P., Tarana, A., and 4 coauthors, 2007, ApJ, 659, 549
- [6] Campana, S., Parmar, A.N., & Stella, L., 2001, A&A, 372, 241
- [7] Corbel, S., Fender, R.P., Tzioumis, A.K., Tomsick, J.A., Orosz, J.A., Miller, J.M., Wijnands, R., & Kaaret, P. 2002, Science, 298, 196
- [8] Corbel, S., Nowak, M.A., Fender, R.P., Tzioumis, A. K., & Markoff, S., 2003, A & A, 400, 1007
- [9] Corbel, S., Fender, R.P., Tomsick, J.A., Tzioumis, A.K., & Tingay, S., 2004, ApJ, 617, 1272
- [10] Corbel, S., Tomsick, J.A., & Kaaret, P., 2006, ApJ, 636, 971
- [11] Corbel, S.; Körding, E.G., & Kaaret, P., 2008, MNRAS, 389, 1697
- [12] Done, C., Gierliński, M., Kubota, A., 2007, A&A Rv, 15, 1
- [13] Falcke, H., Körding, E.G., & Markoff, S., 2004, A&A, 414, 895
- [14] Fender, R.P., Corbel, S., Tzioumis, T., McIntyre, V., Campbell-Wilson, D., Nowak, M., Sood, R., Hunstead, R., Harmon, A., Durouchoux, P., & Heindl, W., 1999, ApJ, 519L, 165
- [15] Fender, R.P., Hjellming, R.M., Tilanus, R. P.J., Pooley, G.G., Deane, J. R., Ogley, R.N., & Spencer, R.E., 2001, MNRAS, 322L, 23
- [16] Fender, R.P., Gallo, E., & Jonker, P.G., 2003, MNRAS, 343L, 99
- [17] Fender, R.P., Gallo, E., Russell, D.M., 2010, MNRAS accepted, arXiv, 1003, 5516
- [18] Fruscione, A., McDowell, J.C., Allen, G.E., Brickhouse, N.S., Burke, D.J., Davis, J.E., Durham, N., Elvis, M., Galle, E.C., Harris, D.E., and 11 coauthors 2006, SPIE, 6270E, 60
- [19] Gallo, E., Fender, R.P., & Pooley, G.G., 2003, MNRAS, 344, 60
- [20] Gallo, E., Fender, R.P., Kaiser, C., Russell, D.M., Morganti, R., Oosterloo, T., & Heinz, S., 2005, Nature, 436, 819
- [21] Gallo, E., Fender, R.P., & Hynes, R.I., 2005, MNRAS, 356, 1017
- [22] Gallo, E., Fender, R.P., Miller-Jones, J.C.A., Merloni, A., Jonker, P. G., Heinz, S., Maccarone, T. J., & van der Klis, M., 2006, MNRAS, 370, 1351
- [23] Garcia, M.R., McClintock, J.E., Narayan, R., Callanan, P., Barret, D., & Murray, S.S.,2001, ApJ, 264, L49
- [24] Hameury, J.-M., Barret, D., Lasota, J.-P., McClintock, J.E., Menou, K., Motch, C., Olive, J.-F., & Webb, N., 2003, A&A, 399, 631
- [25] Harmon, B.A., Wilson, C.A., Zhang, S.N., Paciesas, W.S., Fishman, G.J., Hjellming, R.M., Rupen, M.P., Scott, D.M., Briggs, M.S., & Rubin, B.C., 1995, Nature, 374, 703
- [26] Hjellming, R.M., & Rupen, M.P., 1995, Nature, 375, 464
- [27] Hjellming, R.M., & Han X., 1995, X-ray binaries, p. 308 - 330
- [28] Högbom, J.A., 1974, A&AS, 15, 417
- [29] Jonker, P.G., & Nelemans, G., 2004, MNRAS, 354, 355
- [30] Kong A.K.H., McClintock J.E., Garcia M.R., Murray S.S., Barret D., 2002, ApJ, 570, 277
- [31] Körding, E.G., Fender, R.P., & Migliari, S., 2006, MNRAS, 369, 1451
- [32] Lewis, F., Russell, D.M., Fender, R.P., Roche, P., & Clark, J.S., 2008, arXiv, 0811, 2336
- [33] Markoff, S., 2010, LNP, 794, 143
- [34] Markoff, S., Falcke, H., & Fender R., 2001, A&A, 372, L25
- [35] Markwardt, C.B., & Swank, J.H., 2005, ATel, 414, 1
- [36] McClintock, J.E., Narayan R., & Rybicki, G.B., 2004, ApJ, 615, 402
- [37] Merloni, A., Heinz, S., & di Matteo, T., 2003, MNRAS, 345, 1057
- [38] Narayan, R., McClintock, J.E., & Yi, I., 1996, ApJ, 457, 821
- [39] Orosz, J.A., Groot, P.J., van der Klis, M., McClintock, J.E., Garcia, M.R., Zhao, P., Jain, R.K., Bailyn, C.D., & Remillard, R.A., 2002, ApJ, 568, 845
- [40] Pszota, G., Zhang, H., Yuan, F., & Cui, W., 2008, MNRAS, 389, 423
- [41] Remillard, R., Morgan, E., McClintock, J., & Sobczak, G., 1998, IAUC, 7019, 1
- [42] Remillard, R.A., & McClintock, J.E., 2006, AAS, 209, 0705
- [43] Russell, D.M., Fender, R.P., Hynes, R.I., Brocksopp, C., Homan, J., Jonker, P.G., & Buxton, M.M., 2006, MNRAS, 371, 1334
- [44] Sánchez-Fernández, C., Castro-Tirado, A.J., Duerbeck, H.W., Mantegazza, L., Beckmann, V., Burwitz, V., Vanzi, L., Bianchini, A., della Valle, M., Piemonte, A., Dirsch, B., Hook, I., Yan, L., & Giménez, A., 1999, A & A, 348, L9
- [45] Sault, R.J., Wieringa, M.H., 1994, A&A, 108, 585
- [46] Sault, R.J., Teuben, P.J., & Wright, M.C.H., 1995, ASPC, 77, 433
- [47] Smith, D.A., 1998, IAUC, 7008, 1
- [48] Sobczak, G.J., McClintock, J.E., Remillard, R.A., Cui, W., Levine, A.M., Morgan, E.H., Orosz, J.A., & Bailyn, C.D., 2000, ApJ, 544, 993
- [49] Tingay, S.J., Jauncey, D.L., Preston, R.A., Reynolds, J.E., Meier, D.L., Murphy, D.W., Tzioumis, A.K., McKay, D.J., Kesteven, M.J., Lovell, J.E.J., & 10 coauthors, 1995, Nature, 374, 141
- [50] Tomsick, J.A., Corbel, S., Fender, R.P., Miller, J.M., Orosz, J.A., Rupen, M.P., Tzioumis, A.K., Wijnands, R., & Kaaret, P., 2003, ApJ, 597L, 133
- [51] Zhang, S.N., Wilson, C.A., Harmon, B.A., Fishman, G.J., Wilson, R.B., Paciesas, W.S., Scott, M., & Rubin, B.C., 1994, IAUC, 6046, 1