STUDY OF THE MESON STRUCTURE, WIDTH AND INTERACTIONS WITH NUCLEONS AT COSY–11††thanks: Presented at Excited QCD, 31.02.-06.03.2010 in Stara Lesna, Slovakia
Abstract
We present results on the isospin dependence of the production cross-section in nucleon–nucleon collisions, as well as the results of comparative analysis of the invariant mass distributions for the and reactions in the context of the proton– and proton– interaction. Additionally, the value of the total width of the is reported as derived directly from the measurement of the mass distribution and an explanation of the experimental technique used in order to achieve a precision about an order of magnitude better then former experiments is included.
13.60.Le, 13.75.Cs, 14.40.Be, 14.70.Dj
1 Experimental setup
The reported experiments have been performed in the Research Centre Jülich at the cooler synchrotron COSY [1] by means of the COSY–11 detector system [2] presented in Fig. 1. The collision of a proton from the COSY beam with a proton or deuteron cluster target may cause an meson creation. In that case all outgoing nucleons have been registered by the COSY–11 detectors, whereas for the meson identification the missing mass technique was applied.

2 Production of the meson in the reaction
The main goal of this experiment was the determination of the excitation function for the quasi-free reaction near the kinematical threshold. The motivation was the comparison of the and total cross-sections in order to learn about the production mechanism of the meson in the channels of isospin 1 and 0, and to investigate aspects of the gluonium component of the meson.
The ratio has not been measured so far, and the existing predictions differ drastically depending on the model. Cao and Lee [7] assumed, by analogy to the production of the meson, that the production of the meson proceeds dominantly via the S11(1535) resonance. As a consequence, they predicted within an effective Lagrangian approach a value equal to the experimentally established value. In contrast, Kaptari and Kämpfer [8] predicted a value of close to 1.5 in the kinematic range of the COSY–11 experiment with the dominant contribution coming from the meson conversion currents. In the extreme scenario of glue-induced production saturating the production cross-section, the ratio would approach unity after correcting for the final state interaction between the two outgoing nucleons.
Detailed description of measurement and data analysis is presented in [5, 9]. The result is shown in Fig. 2. The horizontal bars represents the intervals of the excess energy, for which the upper limit of the total cross-section was calculated.
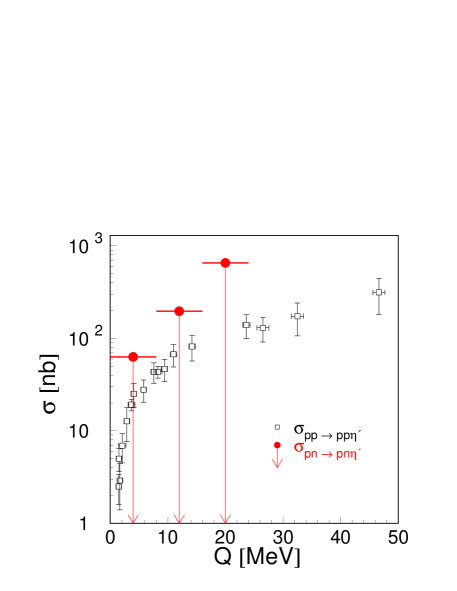
The total cross-section for the reaction was measured in previous experiments [10, 11, 12, 13, 14]. It reveals a strong excess energy dependence, especially very close to threshold. This dependence must be taken into account when comparing to the results for the reaction which were established for 8 MeV excess energy intervals. Therefore, for a given interval of excess energy, we have determined the mean value of the total cross-section for reaction using the parametrisation of Fäldt and Wilkin [15, 16] fitted to the experimental data [17]. For the meson the upper limit of the ratio for the excess energy range MeV is nearly equal to values of the ratio obtained for the meson, whereas for larger excess energy ranges MeV and MeV the upper limits of the ratio are lower by about one standard deviation each. The value of is 6.5 at excess energies larger than MeV [18] suggests the dominance of isovector meson exchange in the production mechanism. The decrease of close to the threshold [19] may be explained by the different energy dependence of the proton–proton and proton–neutron final state interactions [20]. A smaller than is consistent with a possible greater role for singlet currents in production than production. If there are important new dynamics in the production process relative to eta production, a key issue is the relative phase [21] of possible additional exchanges compared to the isovector currents which dominate the production. The observed limit thus constrains modelling of the production processes. To confirm these interesting observations and to go further, new experimental investigations with improved statistics are required.
3 Interactions of the meson
In principle, studies of reactions permit information about the proton–meson interaction to be gained not only from the shape of the excitation function but also from differential distributions of proton–proton and proton–meson invariant masses. Therefore, in order to investigate the proton– interaction the COSY–11 Collaboration performed a measurement [22] of the proton– and proton–proton invariant mass distributions close to the threshold at Q = 15.5 MeV, where the outgoing particles possess small relative velocities. Indeed a large enhancement in the region of small proton– and large proton–proton relative momenta was observed111The same enhancement was also seen in independent measurements by the COSY–TOF Group [23].. However, the observed effect cannot be univocally assigned to the influence of the proton– interaction in the final state [24, 25], since it can also be explained by the admixture of higher partial waves in the proton–proton system [26], or by the energy dependence of the production amplitude [27, 28].
The endeavor to explain the origin of the observed enhancement motivated the measurement of the proton–proton and proton– invariant mass distributions for the reaction presented in this article. Detailed description of measurement and data analysis resulted in invariant mass distributions for the reaction is presented in [6, 29]. The absolute values of the cross-section for the reaction determined as a function of and are shown in Fig. 3.
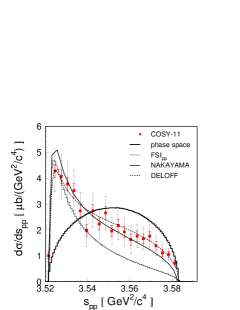
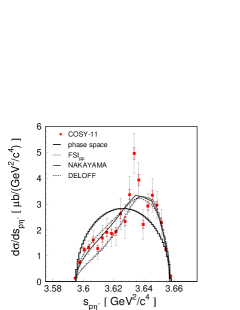
Within the statistical and systematic error bars both model of Deloff [27] and of Nakayama et al.[26] describe the data well although they differ slightly in the predicted shapes. This indicates that perhaps, not only higher partial waves but also the energy dependence of the production amplitude should be taken into account. Also, the inclusion of the proton–proton final state interaction is not sufficient to explain the enhancement seen in the range of large values.
Within the achieved uncertainties, the shape of the proton–proton and proton–meson invariant mass distributions determined for the meson is essentially the same to that established previously for the meson. Since the enhancement is similar in both cases, and the strength of proton– and proton– interaction is different [30, 6], one can conclude that the observed enhancement is not caused by a proton–meson interaction. Therefore, on the basis of the presented invariant mass distributions, it is not possible to disentangle univocally which of the discussed models is more appropriate. As pointed out in [26], future measurements of the spin correlation coefficients should help disentangle these two model results in a model independent way.
4 Total width of the meson ()
In the latest review by the Particle Data Group (PDG) [31], two values for the total width of the meson are given. One of these values, (0.30 0.09) MeV/c2, results from the average of two measurements [32, 33], though only in one of these experiments was extracted directly based on the mass distribution [33]. The second value (0.205 0.015) MeV/c2, recommended by the PDG, is determined by fit to altogether 51 measurements of partial widths, branching ratios, and combinations of particle widths obtained from integrated cross-sections [31]. The result of the fit is strongly correlated with the value of the partial width , which causes serious difficulties when the total and the partial width have to be used at the same time, like e.g. in studies of the gluonium content of the meson [34, 35, 36].
The value of the total width of the meson was established directly from its mass distribution independently of other properties of this meson, like e.g. partial widths or production cross-sections. The meson was produced in proton–proton collisions via the reaction and its mass was reconstructed based on the momentum vectors of protons taking part in the reaction. The reader interested in the description of the detectors and analysis procedures can find detailed informations in Ref. [4, 37]. The momentum of the COSY beam and the dedicated zero degree COSY–11 facility enabled the measurement at an excess energy of only a fraction of an MeV above the kinematic threshold for the meson production. This was the most decisive factor in minimizing uncertainties of the missing mass determination, since at threshold the partial derivative of the missing mass with respect to the outgoing proton momentum tends to zero. In addition, close to threshold the signal-to-background ratio increases due to the more rapid reduction of the phase space for multimeson production than for the .


The systematic error was estimated by studying the sensitivity of the result to the variation of parameters describing the experimental conditions in the analysis and in the simulation [4]. Finally, the total systematic error was estimated as the quadratic sum of independent contributions and is MeV/c2. The final missing mass spectra are presented in Fig. 4. The total width of the meson was extracted from the missing-mass spectra and amounts to MeV/c2. The result does not depend on knowing any of the branching ratios or partial decay widths. The extracted value is in agreement with both previous direct determinations of this value [33, 32], and the achieved accuracy is similar to that obtained by the PDG [31].
The work was partially supported by the European Commission under the 7 Framework Programme through the Research Infrastructures action of the Capacities Programme. Call: FP7-INFRASTRUCTURES-2008-1, Grant Agreement No. 227431, by the PrimeNet, by the Polish Ministry of Science and Higher Education through grants No. 1202/DFG/2007/03, 0082/B/H03/2008/34, 0084/B/H03/2008/34 and 1253/B/H03/2009/36, by the German Research Foundation (DFG), by the FFE grants from the Research Center Jülich, and by the virtual institute Spin and Strong QCD (VH-VP-231).
References
- [1] R. Maier et al., Nucl. Instrum. Methods Phys. Res. A390, 1 (1997).
- [2] S. Brauksiepe et al., Nucl. Instrum. Methods Phys. Res. A376, 397 (1996).
- [3] P. Moskal et al., Nucl. Instrum. Methods Phys. Res. A466, 448 (2001).
- [4] E. Czerwinski, PhD thesis, arXiv:0909.2781 [nucl-ex].
- [5] J. Klaja, PhD thesis, arXiv:0909.4399 [nucl-ex]..
- [6] P. Klaja, PhD thesis, arXiv:0907.1491 [nucl-ex].
- [7] Xu Cao, Xi-Guo Lee, Phys. Rev. C78, 035207 (2008).
- [8] L.P. Kaptari, B. Kämpfer, Eur. Phys. J. A37, 69 (2008).
- [9] J. Klaja et al., Phys. Rev. C81, 035209 (2010).
- [10] P. Moskal et al., Phys. Lett. B474, 416 (2000).
- [11] A. Khoukaz et al., Eur. Phys. J. A20, 345 (2004).
- [12] F. Balestra et al., Phys. Lett. B491, 29 (2000).
- [13] P. Moskal et al., Phys. Rev. Lett. 80, 3202 (1998).
- [14] F. Hibou et al., Phys. Lett. B438, 41 (1998).
- [15] G. Fäldt, C. Wilkin, Phys. Lett. B382, 209 (1996).
- [16] G. Fäldt, C. Wilkin, Phys. Rev. C56, 2067 (1997).
- [17] P. Moskal et al., Int. J. Mod. Phys. A22, 305 (2007).
- [18] H. Calén et al., Phys. Rev. C58, 2667 (1998).
- [19] P. Moskal et al., Phys. Rev. C79, 015208 (2009).
- [20] C. Wilkin, private communication (2008).
- [21] G. Fäldt, C. Wilkin, Phys. Scr. 64, 427 (2001).
- [22] P. Moskal et al., Phys. Rev. C69, 025203 (2004).
- [23] M. Abdel-Bary et al., Eur. Phys. J. A16, 127 (2003).
- [24] A. Fix, H. Arenhövel, Phys. Rev. C69, 014001 (2004).
- [25] A. Fix, H. Arenhövel, Nucl. Instrum. Methods Phys. Res. A697, 277 (2002).
- [26] K. Nakayama et al., Phys. Rev. C68, 045201 (2003).
- [27] A. Deloff, Phys. Rev. C69, 035206 (2004).
- [28] S. Ceci, A. Švarc, B. Zauner, Acta Phys. Pol. B Proc. Supp. 2, 157 (2009).
- [29] P. Klaja et al., Phys. Lett. B684, 11 (2010).
- [30] P. Moskal et al., Phys. Lett. B482, 356 (2000).
- [31] C. Amsler et al., Phys. Lett. B667, 1 (2008).
- [32] R. Wurzinger et al., Phys. Lett. B374, 283 (1996).
- [33] D.M. Binnie et al., Phys. Lett. B83, 141 (1979).
- [34] B. Di Micco, Acta. Phys. Pol. B Proc. Supp. 2, 63 (2009).
- [35] F. Ambrosino et al., J. High Energy Phys. 07, 105 (2009).
- [36] B. Di Micco, Eur. Phys. J. A38, 129 (2008).
- [37] E. Czerwinski, P. Moskal et al., Phys. Rev. Lett. 105, 122001 (2010).