New parton distributions for collider physics
Abstract
We extract new parton distribution functions (PDFs) of the proton by global analysis of hard scattering data in the general-mass framework of perturbative quantum chromodynamics. Our analysis includes new theoretical developments together with the most recent collider data from deep-inelastic scattering, vector boson production, and single-inclusive jet production. Due to the difficulty in fitting both the DØ Run-II lepton asymmetry data and some fixed-target DIS data, we present two families of PDFs, CT10 and CT10W, without and with these high-luminosity lepton asymmetry data included in the global analysis. With both sets of PDFs, we study theoretical predictions and uncertainties for a diverse selection of processes at the Fermilab Tevatron and the CERN Large Hadron Collider.
pacs:
12.15.Ji, 12.38 Cy, 13.85.Qk1 Introduction
Parton distribution functions (PDFs) of the proton are essential for making theoretical predictions, and potentially obtaining breakthrough physics results, from experiments at high-energy hadron colliders such as the Fermilab Tevatron and the CERN Large Hadron Collider (LHC). An accurate determination of PDFs, and their corresponding uncertainties, from the global analysis is therefore crucial. There have been continuous efforts on this front by several groups Alekhin et al. (2010); Ball et al. (2010); Pumplin et al. (2009); Aaron et al. (2010); Martin et al. (2009). In this paper, we describe several theoretical advancements in the global QCD analysis that was used to produce the previous CTEQ6.6 Nadolsky et al. (2008) and CT09 Pumplin et al. (2009) PDFs, and also present a study of the impact on the PDFs by new precision collider data. We begin by summarizing the principal changes in the theoretical treatment.
First, we now treat the systematic uncertainty associated with the overall normalization factor in each of the data sets in the same manner that all other systematic error parameters are handled. Since the log-likelihood is an approximately quadratic function of the normalization parameters, their best-fit values can be computed algebraically for any values of the other fitting parameters. This development simplifies the fitting procedure, since explicit numerical minimization of the experimental normalizations is no longer required. It improves the estimate of uncertainties, expanding them slightly, by allowing the estimated normalizations to vary during the process of finding the most extreme acceptable fits.
Second, we now compute , which measures the consistency between a given set of PDFs and the data, using weight 1 for all experiments (with just one exception to be discussed below). In the previous CTEQ fits, weights larger than 1 were applied to some data sets to disallow bad fits to these sets, especially in the course of defining eigenvector PDF sets that delimit the uncertainty. That goal is now handled by adding an extra contribution to the total , to guarantee the quality of fit to each individual data set and halt the displacement along any eigenvector early, if necessary, to prevent one or more individual data sets from being badly described.
Third, we use more flexible PDF parametrizations for some parton flavors (, , and ) at the initial scale in order to reduce parametrization dependence. This increases the uncertainty in the strange quark and gluon distributions in kinematical regions where the constraints from the data are still limited. In total, the CT10 PDF parametrizations include 26 free parameters, expanded from 22 used in the CTEQ6.6 analysis.
Besides these theoretical advancements, the CT10 analysis includes new precise experimental data in every major category of scattering processes: deep-inelastic scattering (DIS), vector boson production (VBP), and single-inclusive jet production. In Ref. Pumplin et al. (2009), we compared the Tevatron Run-II single-inclusive jet production data Aaltonen et al. (2008); Abazov et al. (2008a) with the Run-I jet data sets Affolder et al. (2001); Abbott et al. (2001) and examined their impact. In addition to these Run-I and Run-II jet data sets, the CT10 analysis includes other recent data from HERA and Tevatron experiments. The HERA-1 “combined” data set on DIS Aaron et al. (2010), developed by a collaboration between the H1 and ZEUS experiments, has replaced eleven original independent HERA-1 data sets. We also include data on the rapidity distribution of production, which has been measured at the Tevatron by both the CDF Aaltonen et al. (2010) and DØ Abazov et al. (2007) collaborations. Finally, we consider data on the measurement of the Tevatron Run-II lepton asymmetry, : the asymmetry in the rapidity distribution of the charged lepton from boson decay Acosta et al. (2005); Abazov et al. (2008b, c). These data are sensitive to the flavor content of the proton, especially to the ratio of down- and up-quark PDFs, .
The high-luminosity Run-II lepton asymmetry data by the DØ Collaboration Abazov et al. (2008b, c) play a special role in this study. While being precise, they run into disagreement with some previous data sets; and in addition, they exhibit some tension among themselves. Because of these disagreements, we present results from two different PDF fits: CT10, in which the DØ data on are ignored; and CT10W, in which these data are emphasized by moderately increasing their weights, which suffices for getting an acceptable fit to these data sets.
Another aspect of this paper consists of a study of the quality of the fit to the various data sets. This study aims to quantify the degree of consistency of constraints imposed on the PDFs by different sets of experiments, in order to establish the extent of the PDF uncertainty allowed by the experimental measurements. Similar questions have been recently addressed by an examination of contributions provided by the individual experiments Pumplin et al. (2009); Pumplin (2010), using techniques discussed in Refs. Collins and Pumplin (2001); Pumplin (2009). Here, we explore the quality of fit issues with the help of a function defined in Eq. 2, which is convenient for comparing the goodness-of-fit among data sets containing different numbers of data points . Using this function, we demonstrate that non-negligible tensions between the fitted data sets (also noticed in Ref. Pumplin (2009)) persist regardless of the number of PDF parameters introduced in the global fit.
The organization of the paper is as follows. Sec. 2 discusses the new features in CT10 theoretical treatment in more detail. Sec. 3 overviews the newly included data sets. Sec. 4 discusses the impact of the combined HERA-1 data. Sec. 5 examines the DØ Run-II lepton asymmetry data. Sec. 6 compares the PDFs obtained from the CT10 and CT10W global fits. Sec. 7 examines the quality of the fits to each data set in terms of the statistical variable defined in this Section. Sec. 8 presents typical applications of the new PDFs to collider physics, such as jet pair production at the Tevatron, electroweak and Higgs boson production at the Tevatron and LHC, and various processes beyond the Standard Model. Sec. 9 presents our conclusions. Finally, the appendix contains a detailed comparison of the CT10 fits with the HERA-1 DIS data in various regions. We also comment on the agreement of the combined HERA-1 data set with the next-to-leading order (NLO) DGLAP evolution of CT10 distributions in the probed region of and .
2 Theoretical developments
We implemented several new features in the global analysis procedures, as compared to the CTEQ6.6 Nadolsky et al. (2008) and CT09 Pumplin et al. (2009) studies.
In the new fits, the normalization uncertainty in each experiment is handled just like any other systematic error parameter. Under a reasonable assumption that the normalization errors obey quasi-Gaussian statistics, the normalization choice that minimizes can be determined algebraically, by following the approach in Refs. Stump et al. (2001); Pumplin et al. (2002). This revision simplifies the fitting procedure, by eliminating the need to assign an explicit search parameter (up to 30-40 extra MINUIT James and Roos (1975) parameters in total) to each normalization factor during the numerical minimization. At the same time, it improves the estimate of PDF uncertainties, by correctly allowing the normalization factors to vary, as the total log-likelihood is explored along each eigenvector direction to determine uncertainty limits. In previous CTEQ analyses, the normalizations were frozen during that exploration, so that this upgrade results in a small increase in the final estimated uncertainty range. (We have checked that the normalization shifts found in the fits, both for the central fit and the eigenvector uncertainty sets, lie within a reasonable range, when compared to the published normalization uncertainty of each data set.)
At the initial scale for DGLAP evolution Gribov and Lipatov (1972); Altarelli and Parisi (1977); Dokshitzer (1977), both CT10 and CTEQ6.6 sets assume the same functional form for valence quark PDFs:
| (1) |
where or . While all parameters ,…, are varied freely in CT10, the coefficient for was set to zero in CTEQ6.6; consequently, the CT10 down-quark PDF is more flexible at large than that of CTEQ6.6. (The coefficients ,…, for and are taken to be independent. The values, expected to be close to 0.5 based on Regge theory, are set equal to each other.)
For the gluon, CTEQ6.6 also used the form (1) with . The same form is employed in CT10, multiplied by an additional factor to allow for extra freedom of the gluon at small . This extra term is not required for getting the best fit to the current data, since it reduces the minimum by only 6 units. Rather, it allows us to better explore the uncertainty in the small- region, where the current data provide little constraint on .
For strangeness PDF, CTEQ6.6 used an ad hoc prescription designed to avoid fits in which the ratio of strange to non-strange sea quark PDFs, , was counterintuitively large at , where this ratio is not constrained by the current data Nadolsky et al. (2008). In CT10, is given by a more flexible form (1) with . The desire to impose reasonable expectations on in the is handled in CT10 by adding a soft constraint (a penalty term) such that solutions with outside of the range 0.4-1 are disfavored at below . (The same power-law behavior was assumed for , , and in the limit , based on Regge theory; with the same coefficient for and , so that and as .) For simplicity, an assumption of symmetry between the strangeness and anti-strangeness PDFs was made, , similarly to CTEQ6.6.
When computing the measure of consistency between the PDFs and the data in CT10, we follow the usual CTEQ analysis approach Pumplin et al. (2001); Stump et al. (2001) of requiring agreement at the confidence level (CL) of about 90% with each experiment included in the fit, for each final PDF eigenvector set provided to compute the PDF uncertainty. This is achieved, on average, by defining an upper bound on the excursion of the global from its minimum value, chosen so as to keep the function of each individual experiment within the 90% CL computed (for the number of data points in this experiment Pumplin et al. (2002)). In addition to this overall tolerance condition, CTEQ6.6 and the earlier fits assigned weights greater than 1 to some data sets—particularly those with a small number of points—to ensure that the fits to those data sets remained acceptable for all of the eigenvector sets that define the uncertainty range. The procedure for the choice of weights was time-consuming and varied depending on the selection of experiments and “tensions” between them. It might also give some experiments with extra weights an undue influence on the best fit.
In the CT10 fit, we introduce a different approach, which reaches the same objective of enforcing the 90% CL agreement with all experiments in a more efficient way. Each data set is assigned weight in CT10, with the exception of the DØ Run-II lepton asymmetry data. We define a variable
| (2) |
for each data set with data points. On statistical grounds explained in Sec. 7, is expected to be well approximated by a standard normal distribution (with a mean of zero, variance of 1, and negligible skewness), independently of the number of points for . Thus, in an ideal situation, it is easy to assign a confidence level to each excursion of from its central value, for all practical . For example, a 90% CL excursion in the -th experiment would correspond to , cf. Fig. 15.
In reality, the distribution of values is broader than a Gaussian of unit variance even in the best fit (cf. Sec. 7), due to some incompatibility between the different data sets. For this reason, in the experiments that have already in the best fit, we compute by dividing the value by its best-fit value, to bring the distribution in close agreement with the standard normal distribution. We then add a penalty term to the log-likelihood function (which also includes the usual contributions from the individual data points, of the type shown in Eq. (4)) to exclude solutions with improbable positive values.
The specific penalty term we chose is
| (3) |
It applies only to experiments with , as indicated by the theta function . Individual values are raised to power , selected so that is negligible in most of the allowed parameter region, but grows rapidly when a 90% CL boundary for some experiment (corresponding to for this experiment) is reached.
The final PDF uncertainty shows little dependence on the exact form of , provided that it is small in the bulk of the allowed region and grows rapidly near the 90% CL boundaries. The penalty term warrants that none of the alternative eigenvector PDFs disagrees strongly with any individual data set within the estimated PDF uncertainty range. Because of the large power law , it can quickly halt the displacement along any eigenvector direction, owing to the CL criterion.
The procedure described captures the idea of preserving the 90% CL agreement among the data sets Pumplin et al. (2001); Stump et al. (2001); Martin et al. (2009) explicitly and automatically, while still retaining most of the original importance of the criterion based on the global . In particular, we find that the penalties are important for about half of the final eigenvector sets. They guarantee that data sets with small numbers of data points are not ignored in a large global fit, even in situations when a significant increase in of a specific small data set is misconstrued as a harmless minor change in the global . (The two-part structure of loosely resembles a bicameral legislature such as the US Congress, where votes in the House are proportional to population—data points in our case—while votes in the Senate represent specific entities—experiments or data sets in our case.)
The CT10 and CT10W central fits and their eigenvector uncertainty sets were computed using QCD parameters (evolved by numerically solving the RG differential equation at two loops with the HOPPET program Salam and Rojo (2009)), and . The value chosen for is close to the world average value, which is constrained most strongly by electroweak precision experiments that are not directly included in the PDF fitting. In addition to the eigenvector PDF sets for this central value, the CT10(W) distributions ct (1) provide several PDFs for alternative values in the interval 0.113-0.123. Those can be used to evaluate the combined uncertainty due to the PDFs and in any physical process of interest, by following a convenient procedure that is spelled out and derived in Ref. Lai et al. (2010). The procedure is to add the PDF and uncertainties in quadrature, which is sufficient for evaluating the combined uncertainty, including the full correlation between the PDFs and .
Our choice of the input charm mass GeV is based on a mild preference for that value in for the global fit. (The charm mass behaves as phenomenological parameter in the PDF fit at NLO — in part because it plays a role in approximating phase space effects.) A systematic study of the allowed range for and will be undertaken in a future publication.
The calculations at NLO accuracy in various processes in this and previous CTEQ analyses Nadolsky et al. (2008); Pumplin et al. (2009); Lai et al. (2010) are summarized as follows. The NLO terms are included directly for DIS and VBP processes. To speed up the calculations, inclusive jets and the W lepton asymmetry are calculated using a lookup table which gives the ratio NLO/LO 111 The contribution from next-to-next-leading-logarithm(NNLL) resummation at small transverse momenta of bosons is added into the NLO term for the case of . separately for each data point. This table depends only very weakly on the parameters for the input PDFs. The table is updated in the course of the fitting, and we check its agreement with the final run of the fitting to be sure that the calculation is accurate at NLO. The method is therefore just a calculational convenience, not an approximation. That is, there is an effective NLO calculation for every inclusive jet and data point used in the fitting. To be clear, the same PDFs and 2-loop are used in both the numerator and denominator for the table. The lookup table just summarizes the effects of the NLO corrections to the matrix elements for each data point.
3 Overview of new data sets
In the past two years, several new precise data sets became available, expanding the scope of the earlier data used in the previous CTEQ6.6 and CT09 analyses.
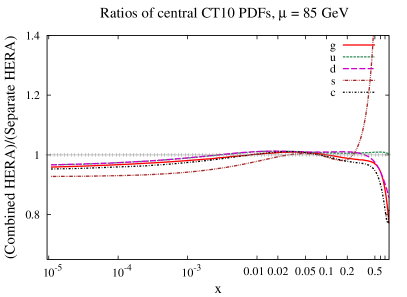
The H1 and ZEUS collaborations at the HERA collider released a joint data set Aaron et al. (2010) that combines results from eleven measurements in neutral-current (NC) and charged-current (CC) deep inelastic scattering (DIS) processes at HERA-1. In our previous analyses, which included the HERA results as separate data sets, each one was handled independently from the other ten sets, and the correlations between systematic errors in the distinct data sets were neglected. Since many systematic factors are common to both experiments and affect all results in a correlated way, Ref. Aaron et al. (2010) presents the HERA-1 DIS results as a single data set, with all 114 correlated systematic effects shared by each data point. The combined data set has a reduced total systematic uncertainty, as a result of cross calibration between H1 and ZEUS measurements. When the combined HERA-1 data set is used, we observe a reduction in the PDF uncertainty, compared to a counterpart fit based on the separate HERA-1 data sets. We shall discuss the impact of the combined HERA-1 data in Sec. 4.
New data on the asymmetry in the rapidity distribution of the charged lepton from boson decay, measured in collisions at , have been published by both the CDF and DØ Collaborations. The lower luminosity CDF Run-I Abe et al. (1995) and Run-II Acosta et al. (2005) data agree well with the other data sets used in the global analysis. The high-luminosity DØ Run-II data Abazov et al. (2008b, c) conflict with some of the fixed-target DIS experiments. Since the DØ Run-II lepton asymmetry data show significant tension with respect to the other data — and to some extent with themselves— we produce two separate fits: CT10, from which the DØ lepton asymmetry sets are excluded; and CT10W, in which they are included. The fits to the data are presented in Sec. 5, and the resulting PDFs are compared in Sec. 6.
Measurements by the CDF Aaltonen et al. (2010) and DØ Abazov et al. (2007) collaborations of the rapidity distribution for bosons at the Tevatron are also included in this analysis. The DØ measurement with integrated luminosity of agrees very well with the theory prediction, with for 28 data points in the CT10 (CT10W) fit. The agreement with the (more precise) CDF data at is slightly worse, with for 28 data points. The CDF data show a slight preference for CT10W over CT10. Comparisons of these data sets with the NLO theoretical predictions based on CT10 and CT10W PDFs are shown in Fig. 9. Overall, the impact of the rapidity data sets on the best fit is quite mild.
The analyses presented here also include Run-II inclusive jet data from CDF and DØ Aaltonen et al. (2008); Abazov et al. (2008a), present in the CT09 analysis Pumplin et al. (2009), but not in CTEQ6.6. In total, the CT10 (CT10W) fit is based on 29 (31) data sets with a total of 2753 (2798) data points.
4 Impact of the combined HERA-1 data
The combined H1/ZEUS data set for DIS at HERA-1 Aaron et al. (2010) is included in our analysis, together with the estimates of the correlated experimental uncertainties provided by the HERA experiments HER . When comparing each experimental value with the respective theory value (dependent on PDF parameters ), we account for the possible systematic shifts in the data, as estimated by the correlation matrix . There are 114 independent sources of experimental systematic uncertainties, quantified by the parameters that should obey the standard normal distribution. The contribution of the combined HERA-1 set to the log-likelihood function is given by
| (4) |
where is the total number of points, and is the total uncorrelated error on the measurement , equal to the statistical and uncorrelated systematic errors on added in quadrature. Minimization of with respect to the systematic parameters is realized algebraically Stump et al. (2001); Pumplin et al. (2002).

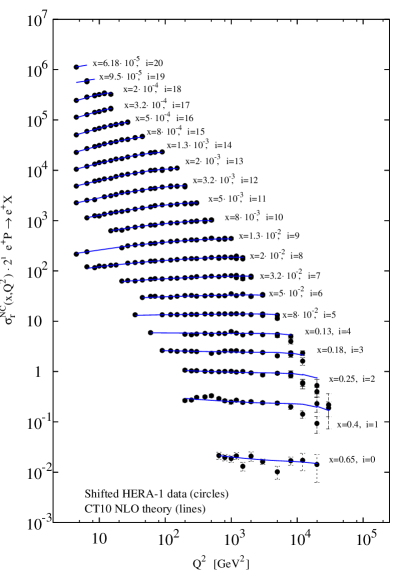
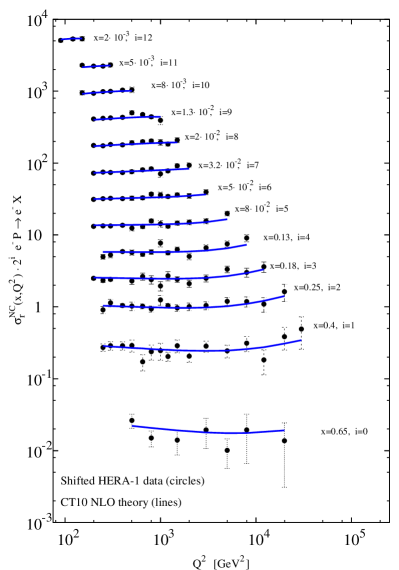
Both the CT10 and CT10W central fits, designated as CT10.00 and CT10W.00 respectively, show acceptable agreement with the combined H1/ZEUS set of reduced DIS cross sections. For the rest of this section, we discuss the CT10 fit. The outcome of the CT10W fit is very similar; figures comparing the CT10W fit to the combined HERA data are available at ct (1). For the HERA-1 sample, we obtain for the points that pass our kinematical cuts for the DIS data: and . A comparison of theory predictions with the NC and data is shown in Fig. 1. Apart from some excessive scatter of the NC data around theory predictions, which results in a slightly higher-than-ideal value of , NLO theory describes the overall data well, without obvious systematic discrepancies.
The data points shown in Fig. 1 include systematic shifts bringing the theoretical and experimental values in closer agreement, by allowing the systematic parameters to take their most optimal values within the bounds allowed by the correlation matrix . As expected, the best-fit values of are distributed consistently with the standard normal distribution. Their contribution to in Eq. (4) is better than the expected value of .
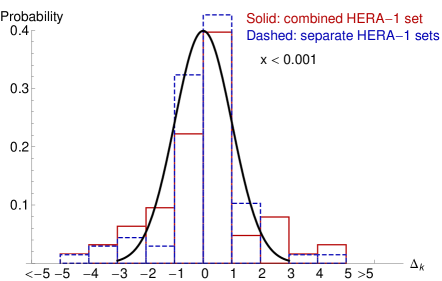
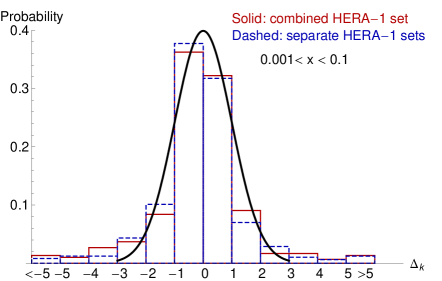
The histogram of values obtained in the best CT10 fit (CT10.00) is shown in Fig. 2, with an overlaid standard normal distribution. The histogram is clearly compatible with its stated Gaussian behavior. With many eigenvector sets, one observes 1-2 values at 2-3, but such large displacements are not persistent.
The overall agreement with the combined HERA-1 data is slightly worse than with the separate HERA-1 data sets, as a consequence of some increase in for the NC data at and . To investigate the origin of this increase, we compare the CT10 fit to an alternative fit, in which the combined HERA-1 set is replaced by the eleven separate HERA DIS data sets, and with the rest of the inputs kept identical to those in the CT10 fit. In this “alternative CT10 fit”, each HERA-1 data set contributes a term of the same form as in Eq. (4), but with independent correlation matrices and systematic parameters in each measurement.
The Appendix examines the contributions of the individual data points to in the CT10 and alternative CT10 fits and finds them to be consistent with random point-to-point fluctuations of the combined data in the small- and large- ranges. The fluctuations are somewhat irregular and larger than normally expected. Their spread widens upon the combination of the data sets. Thus, this analysis does not reveal significant systematic differences between the NLO QCD theory and the full sample of the HERA-1 DIS data. In the same spirit, we demonstrate in the appendix that the HERA-1 set is compatible with the NLO DGLAP evolution of CT10 PDFs, whether those PDFs are fitted to the whole DIS sample, or only to a specially selected subsample of it with points at large and .
Modifications induced by the combination of HERA-1 sets are illustrated by figures comparing the PDFs in the CT10 and alternative CT10 fits. Figs. 3(a,b) show error bands for (a) the gluon and (b) the charm quark, as a function of Bjorken at GeV. These PDFs are chosen because they exhibit the largest changes upon the combination of the HERA-1 sets. The modifications in the bottom quark are comparable to those in gluon and charm, while the changes for other flavors are smaller.
The error bands in Figs. 3(a,b) represent the asymmetric positive and negative uncertainties of the PDFs , computed as Nadolsky and Sullivan (2001)
| (5) |
in terms of , the best-fit (central) PDF value, and , the PDFs for positive and negative variations of the PDF parameters along the -th eigenvector direction in the -dimensional PDF parameter space. The red solid band corresponds to the combined HERA set, and the blue hatched band corresponds to the separate sets. The uncertainties are shown as ratios to the central PDFs in their respective fits,
| (6) |
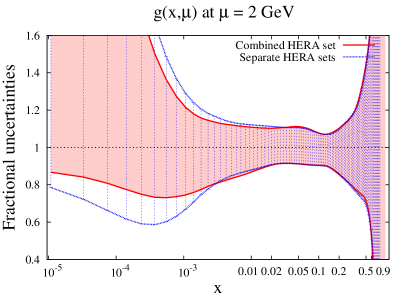
The impact of the HERA-1 data on the uncertainties of the gluon and charm PDFs is quite clear in the small- region, starting from and going down to , where we observe contraction of the error bands. In the large region, the error bands for the combined and separate HERA data sets are almost coincident.

(a) (b)
(a) (b)
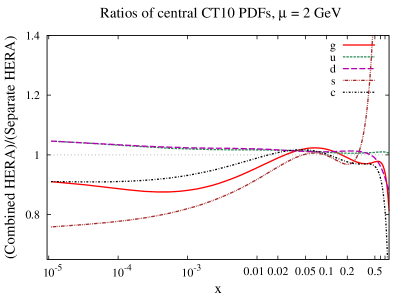
Ratios of the PDFs in the central PDF sets of the CT10 and alternative CT10 fits are shown in Figs. 4(a) and (b), at GeV and GeV. At GeV (Fig. 4(a)), the effect of the new data is again most evident in the behavior of the gluon and charm PDFs at below . These PDFs are suppressed by up to 10% upon the combination of the HERA sets. In addition, one observes a suppression of the strange (anti-)quark PDF, which, however, is small compared to the large PDF uncertainty associated with this flavor. The light-quark PDFs are slightly enhanced at small , while at medium to large region, down-quark PDF becomes smaller and up-quark PDF remains about the same.
Fig. 4(b) shows how these ratios are impacted by the DGLAP evolution to GeV. Some suppression persists in the gluon PDF at , but this is diminished by the singlet evolution, which also suppresses the ratios for all quarks in the same region. At medium to large , the features of PDFs are similar to those at GeV described above.
All the differences observed between the PDFs using the combined and the separate HERA data sets are fully contained in the respective error bands, so no tension between the best-fit solutions of the two fits is evident. The resulting changes in predictions for collider observables, with the exception of those sensitive to gluon or heavy-quark scattering at and small momentum scales, are thus expected to be mild.
| Collider/observable | |||
|---|---|---|---|
| Tevatron, TeV | |||
| LHC, TeV | |||
| LHC, TeV |
As an illustration, Table 1 shows the changes, due to the combination of the HERA sets, in inclusive and boson production cross sections at the Tevatron and LHC, as well as in their ratios, computed at NLO in in accordance with the settings discussed in Sec. 8. The largest observed change is an increase of 2.5% in the and cross sections in the Tevatron Run-II. Changes in the LHC cross sections are about 0.7% at most. These changes are well correlated in the and scattering processes, so that the ratio of the and cross sections, shown in the last column of the table, changes (decreases) marginally by 0.02-0.07%.
5 lepton asymmetry in the global PDF analysis
The interest in the Tevatron boson charge asymmetry originated in the late 1980’s Berger et al. (1989); Martin et al. (1989), when its measurement was proposed in order to resolve a controversy between constraints on the ratio of up and down quark PDFs, , obtained from DIS on hydrogen and deuterium targets. At the time, a discrepancy between the values derived from DIS data by BCDMS Benvenuti et al. (1989, 1990), EMC Aubert et al. (1987), and, to some extent, SLAC Whitlow (1990) limited the accuracy of predictions of and boson observables in the early Tevatron runs, notably , , and . A more precise measurement of proton and deuteron DIS cross sections by NMC Amaudruz et al. (1992) was found to be in better agreement with BCDMS than with EMC. Several theoretical Badelek and Kwiecinski (1992); Virchaux and Milsztajn (1992) and experimental Bazizi and Wimpenny (1991); Milsztajn et al. (1991) factors were also identified that could cause the discrepancy and, in the long run, limit the accuracy of determination of the ratio from the DIS cross sections. So, when CDF measured Abe et al. (1995) and found it to agree with the PDFs fitted to the BCDMS+NMC data and disagree with the PDFs fitted to the EMC data, the controversy was generally assumed to be resolved in favor of BCDMS and NMC. The combination of the BCDMS, NMC, and CDF data sets has been used since then as a self-consistent input by MRSA Martin et al. (1994), CTEQ3 Lai et al. (1995), and subsequent global analyses.
This status quo has been challenged recently by high-luminosity measurements of charge asymmetry in electron and muon channels by DØ Abazov et al. (2008b, c). The DØ data disagree significantly with NLO theoretical predictions based on CTEQ6.1 and 6.6 PDFs Abazov et al. (2008b, c). They disagree even more with the PDFs produced by the other groups Catani et al. (2010). When the DØ data are included in our global fit, they show significant tension with the NMC ratio , BCDMS , and CDF Run I , but are generally compatible with the other data sets – not unexpectedly, since it is mostly the above three sets that probe the same PDF ratio . In addition, there appears to be some disagreement among the subsets of the DØ data themselves, as will be discussed below.
To understand how the charge asymmetry data can seriously contradict some PDF sets in spite of the agreement of these PDFs with other precise measurements, note that is very sensitive to the average slope of in the relevant kinematic region Berger et al. (1989); Martin et al. (1989). Small differences between the slopes of distinct PDF sets can significantly change the behavior of ; see, for instance, Figs. 2 and 19 of Ref. Lai et al. (1995). It is therefore not surprising that the existing PDF sets, while being compatible with the available fixed-target DIS cross sections, can vary drastically in their predictions for .
The emerged discord in asymmetry measurements poses a dilemma for our global analysis. On one hand, boson production is not affected by hard-to-control uncertainties typical for DIS on a deuterium target. Several factors beyond the leading-power perturbative QCD affect deuterium DIS cross sections at , including target-mass, dynamical higher-twist, and nuclear binding effects Accardi et al. (2010). (No nuclear corrections to the deuteron DIS data are included in this analysis.) In principle, these factors themselves need to be determined from the DIS data, increasing the uncertainty in the resulting PDFs. In practice, their impact is minimized by the selection cuts imposed on the DIS data included in the global analysis. Even with the safeguards, the large- quark PDFs may have residual sensitivity to these uncertainties beyond the leading-twist QCD Accardi et al. (2010); Thorne et al. (2010).
On the other hand, the fixed-target DIS experiments continue to provide significant constraints on the PDFs both at intermediate and large Pumplin (2010) and cannot be discarded without increasing the PDF uncertainties; nor are the tensions between the subsets of the data fully understood yet. Until these issues are clarified, our provisional solution is to present two separate sets of PDFs, CT10 without the DØ Run-II data, and CT10W with them, in order to explore possible implications for collider experiments sensitive to the ratio.
5.1 Detailed comparison to DØ lepton asymmetry data
The Tevatron charge asymmetry studied here is constructed from rapidity distributions, , of the charged lepton or from the decay of the boson:
| (7) |
These distributions are observed directly; selection cuts are usually imposed on transverse momentum of in various bins to emphasize the sensitivity of this distribution to in different ranges of Acosta et al. (2005).
We compute using the program ResBos Balazs et al. (1995); Balazs and Yuan (1997); Landry et al. (2003), which returns fully differential cross sections for both decay leptons at NLO and, in addition, performs next-to-next-to-leading-logarithm (NNLL) resummation at small transverse momenta of bosons. The distributions with cuts on have some sensitivity to the resummed and NNLO corrections Balazs and Yuan (1997); Catani et al. (2010), which can reach a few percent at the largest values of accessible at the Tevatron. We examined the magnitude of these corrections and found them to be unimportant in comparison to the current experimental errors.222The sensitivity to NNLO effects was examined by redoing the calculation for after adding the exact correction for bosons produced with non-zero transverse momentum. This correction captures a large part of the full NNLO effect. The changes in the results were found to be small and comparable to the difference between the exact NLO and NNLO values found in Ref. Catani et al. (2010).
| Bin | Cut | Points | (CT10) | (=1) | (CT10W) | |
|---|---|---|---|---|---|---|
| 1 | GeV | 12 | 79.5 | 37.2 | 25.3 | |
| 2 | GeV | 12 | 20.7 | 20.3 | 25.5 | |
| 3 | GeV | 12 | 91.4 | 41.7 | 26.5 | |
| 4 | GeV | 9 | 8.3 | 10.8 | 13.5 |
Any fit that agrees with the Run-II must sacrifice some of the agreement with the Run-I data and some DIS experiments, as both are probing similar PDF kinematics. To obtain a reasonable in the CT10W fit, we find it necessary to increase the weight of the DØ Run-II data, as we did, e.g., for a special PDF set (CTEQ4HJ) for high jets from the Tevatron in 1995 Lai et al. (1997). From the sample of DØ muon , only one bin, with GeV, has reasonable when fitted together with the electron data; the values in the muon bins with GeV and GeV stay above 15 for 9 data points for all combinations of the weights tried. The CT10W fit therefore includes three electron bins and the compatible muon bin, as shown in Table 2.333The missing transverse energy is required to be larger than 25 GeV in the electron asymmetry data, and 20 GeV in the muon data. The impact of the weights on the values for the DØ Run-II data is also shown in this table.
The table demonstrates that the CT10 PDFs, obtained without the DØ data, disagree strongly with bins 1 and 3 of . In the next column, taken from a fit that includes the DØ data with weight , the values in bins 1 and 3 are still rather poor. Because the number of DØ data points is small, this fit tends to ignore them when they conflict with the other high-statistics data sets. To emphasize the four most compatible data sets, the function of the CT10W fit, shown in the rightmost column, includes their contributions with weights (5,2,5,2). The weights make values in this column more acceptable, even though still not entirely perfect.
A measure of the tension between DØ and the other data sets can be obtained by examining the increase in the total for the other data sets, after the DØ data are included. The resulting increase is 67, so the CT10W fit can be considered acceptable within the CT10 analysis based on the 90% global tolerance criterion. Of the total increase in of 67 units, 33 units are contributed by the NMC ratio data Arneodo et al. (1995). The other major source of conflict comes from the BCDMS deuterium data Benvenuti et al. (1990), with an increase in of 19. Also significantly worse is the fit to the CDF Run-I W lepton asymmetry data Abe et al. (1995), with an increase of by 5, for only 11 data points. Aside from those three sets, all other sets accommodate CT10 and CT10W equally well.
The DØ Run-II W lepton asymmetry data sets also appear to have considerable tension among themselves. For example, the fit to bin 2 is worse in CT10W than in CT10.
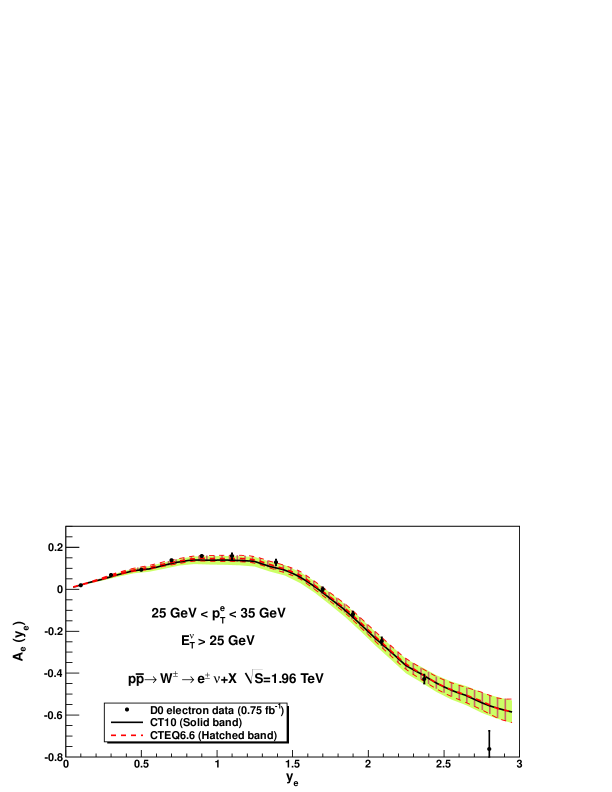
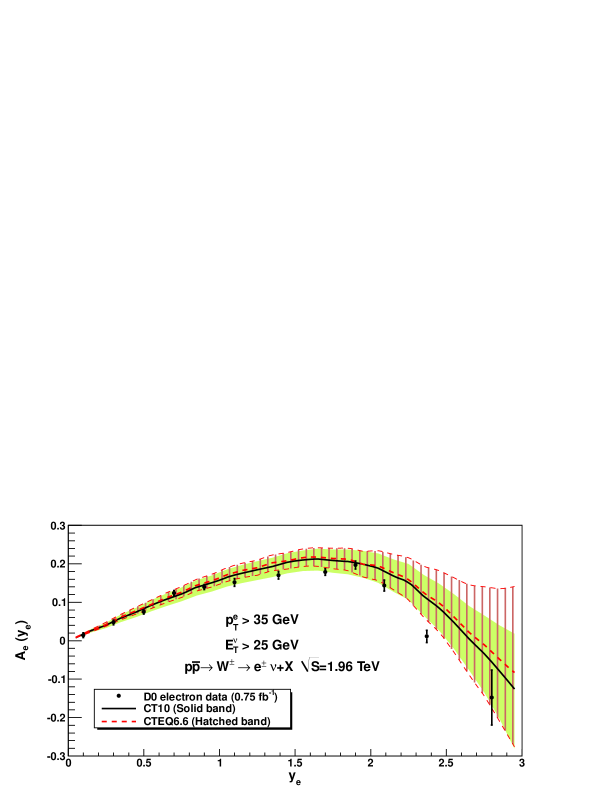
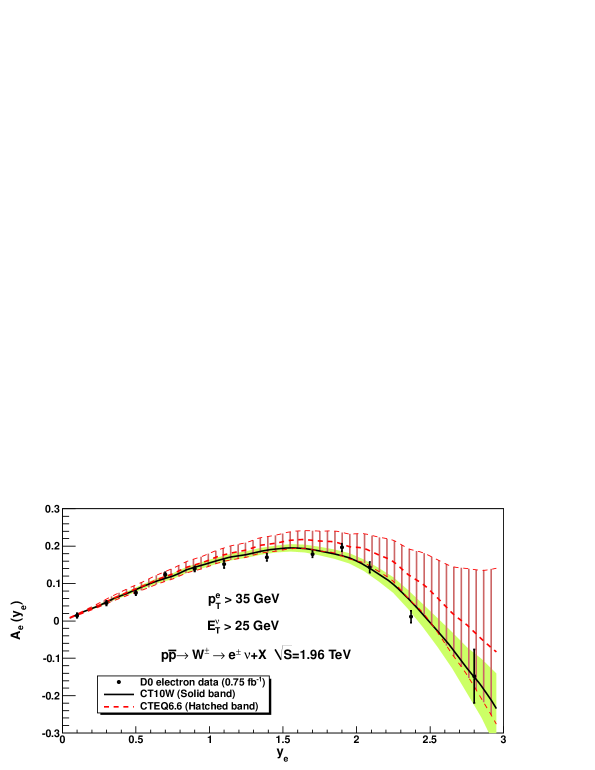
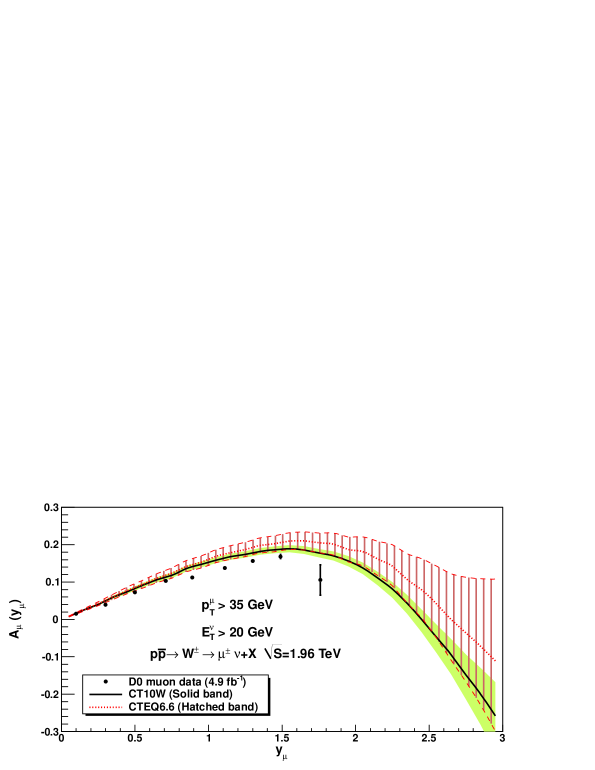
Agreement of the individual DØ data points with NLO theoretical predictions based on CTEQ6.6, CT10, and CT10W PDF’s is illustrated by Figs. 5-8, for the cuts on and specified in the figures. In the case of the electron asymmetry shown in Fig. 5, CT10 central values and PDF uncertainties are similar to those obtained with CTEQ6.6, except for the large-rapidity region () in the bin , where CT10 predicts a somewhat smaller PDF uncertainty. It is obvious that the CT10 prediction does not describe the data better than CTEQ6.6. (Note again that these data are not included in the CT10 fit.).
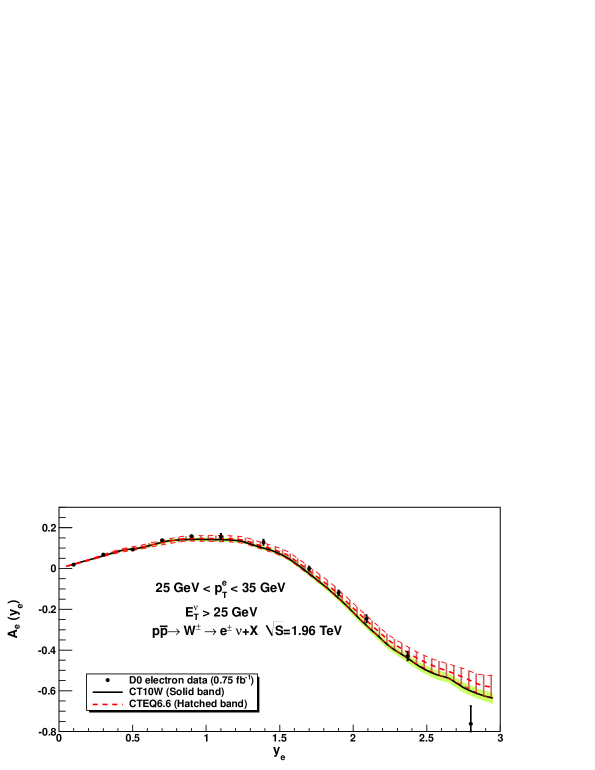
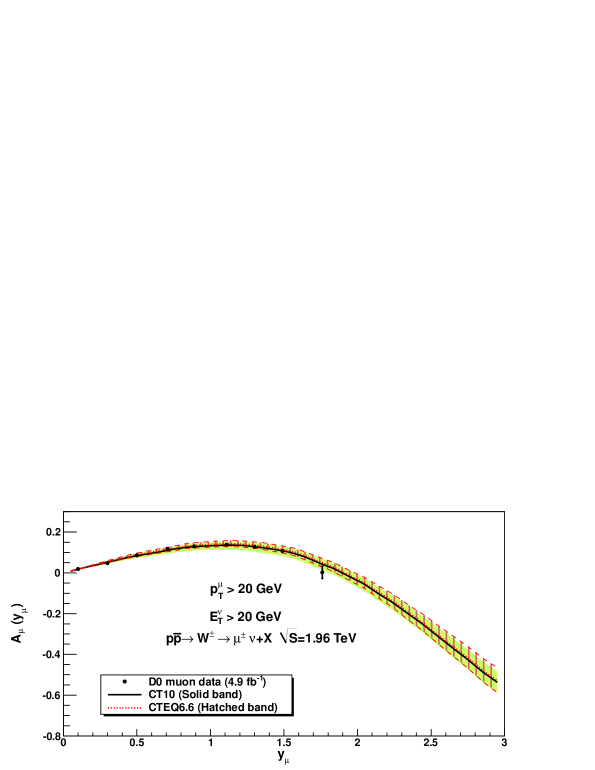
In contrast, the CT10W prediction in Fig. 6, obtained upon including the DØ Run-II data, agrees with these data much better. Most noticeably, the PDF uncertainty band of the CT10W set is narrower than that of CTEQ6.6 or CT10. As we will see in the next section, this reflects significant reduction in the uncertainty of the (slope of the) ratio, once the data are included to constrain it.
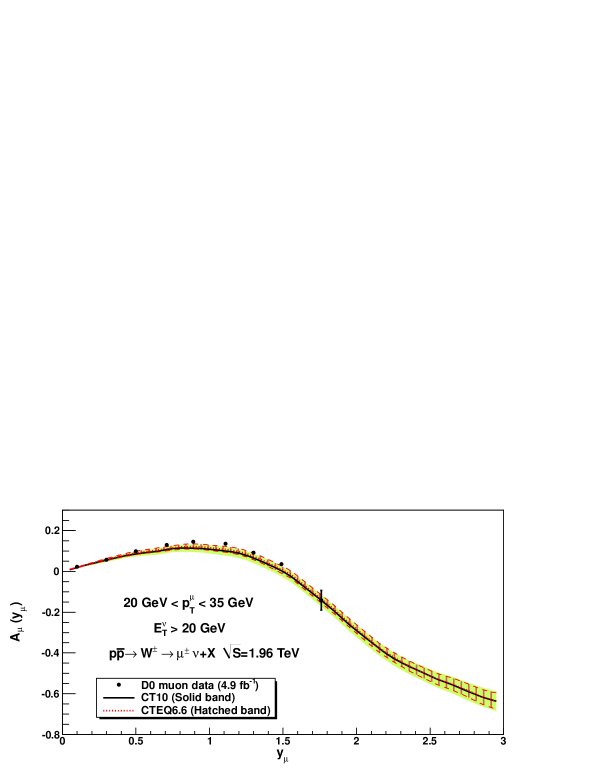
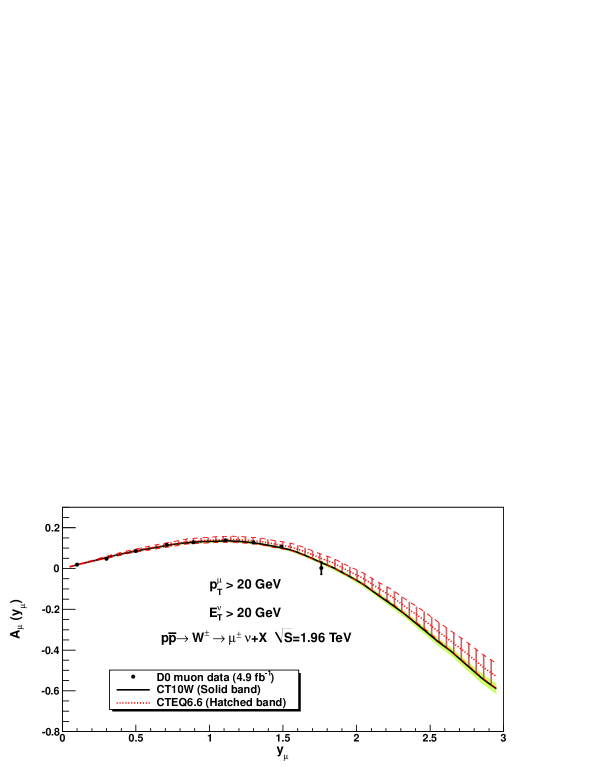
Figs. 7 and 8 are similar to Figs. 5 and 6, but show the DØ Run-II muon charge asymmetry. In the bin, the agreement of the CT10W.00 prediction with the data is actually slightly worse than that of the best-fit CTEQ6.6 set (CTEQ6.6M) and CT10.00 predictions. All three theoretical predictions (CTEQ6.6, CT10, and CT10W) disagree with the data in the other two bins. Taken together, Figs. 7 and 8 suggest that only one bin of the muon asymmetry data can be accommodated in the fit.
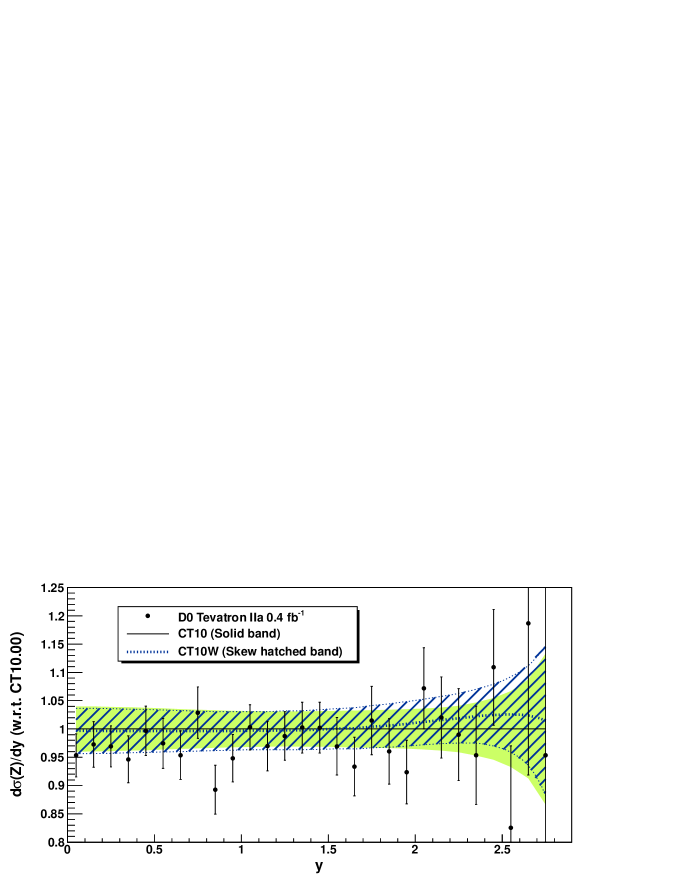
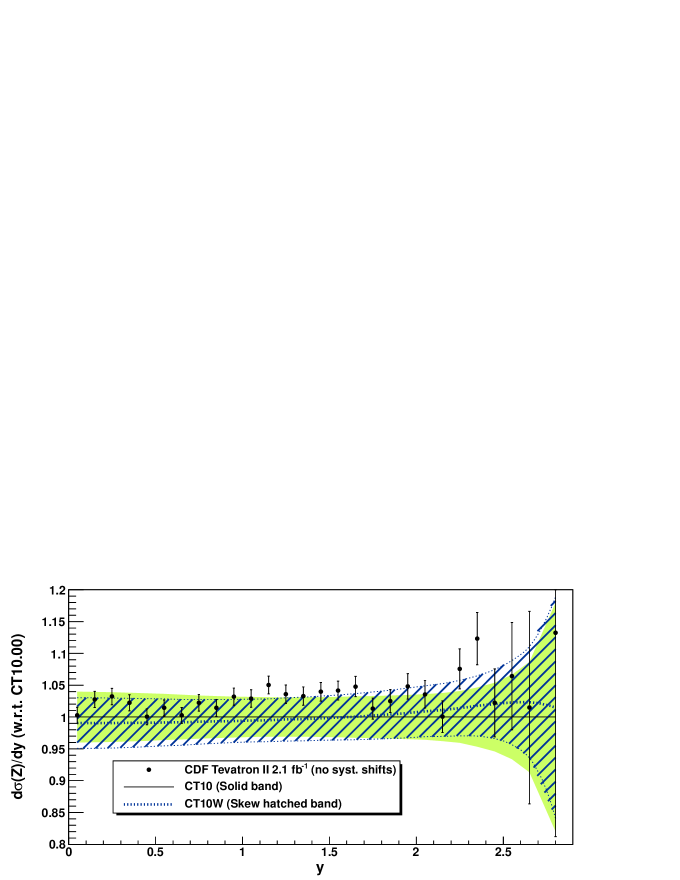
Figure 9 compares NLO theoretical predictions for rapidity () distributions of bosons with the experimental data by CDF Run-II Aaltonen et al. (2010) and DØ Run-II Abazov et al. (2007). Both CT10 and CT10W sets give similar predictions and are in good agreement with the data. Among the two experimental measurements, the more precise CDF Run-II rapidity data (in the lower inset) appear to be closer to the CT10W prediction at than to the CT10 prediction, i.e., to mildly favor the trend suggested by the latest data. CDF has published the systematic uncertainties of their measurement. Those are included in our fit and produce additional correlated shifts of the data toward the theoretical values; however, the lower inset of Fig. 9 shows these data without such shifts. With the systematic shifts included, the agreement between NLO theory and CDF Run-II data is even better than is seen in Fig. 9.


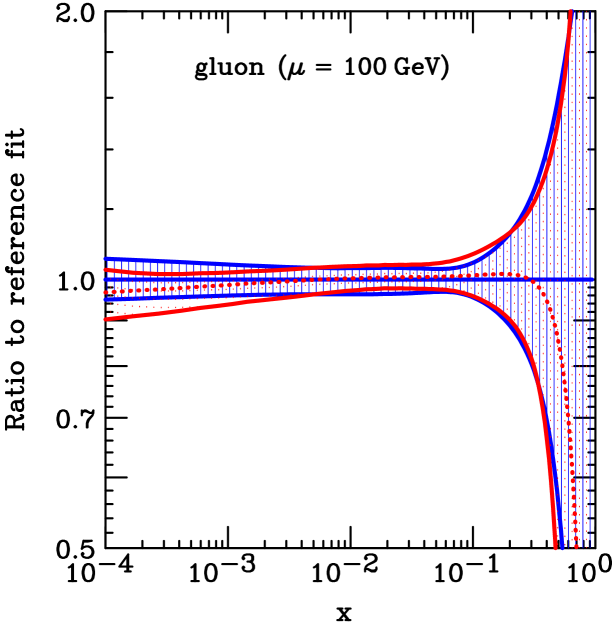
6 Comparison of CTEQ6.6, CT10, and CT10W PDF sets
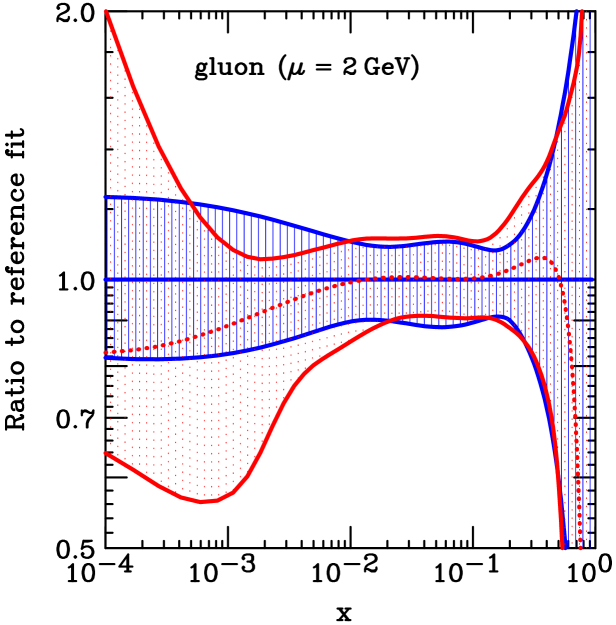
Figure 10 shows the best-fit PDFs and uncertainty ranges of the gluon distribution in CTEQ6.6 and CT10 eigenvector PDF sets, relatively to the CTEQ6.6 best-fit PDF, CTEQ6.6M. The two error bands are similar, except at small , where the more flexible parametrization of the CT10 gluon PDF allows for a wider uncertainty. The CT10 uncertainty range can be larger than that of CTEQ6.6, because the additional constraints from new experimental data are offset by the combined effect of allowing the experimental normalization factors to vary during eigenvector set searches, the increased freedom in the parametrizations, and the change to weight 1 for every data set, as discussed in Sec. 2.
Figure 11 compares from the CTEQ6.6 and CT10 sets. Again, CT10 lies within the 90% CL range derived from CTEQ6.6. However, has increased to a value close to the CTEQ6.6 estimated upper limit at , even at scale , again as a result of modifications discussed in Sec. 2. (No such increase is observed in , which undergoes qualitatively similar changes in other aspects.)
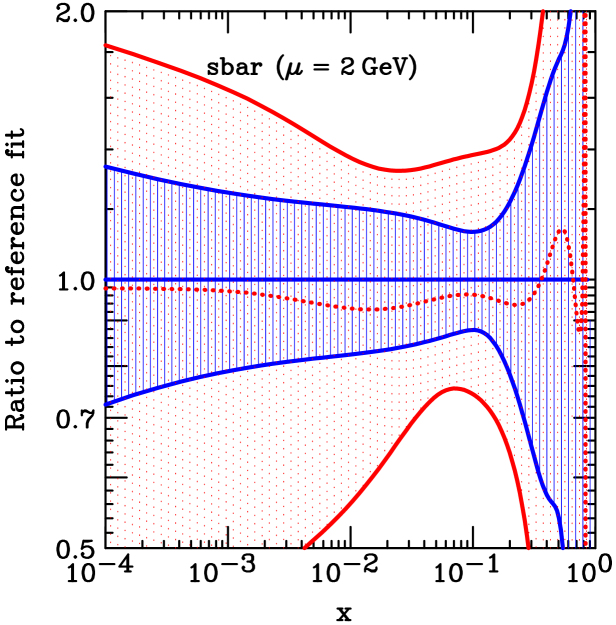
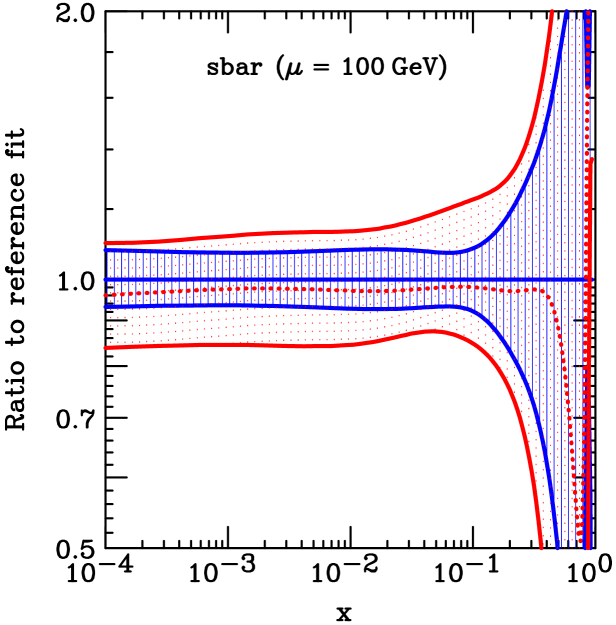
Comparison of CT10 with CTEQ6.6 distributions for strange (anti-) quarks () is shown in Fig. 12. Here the CT10 central fit again lies well inside the CTEQ6.6 uncertainty estimate; however, the CT10 uncertainty on strangeness is much larger than in CTEQ6.6, as a result of the more flexible parametrization assumed in CT10.
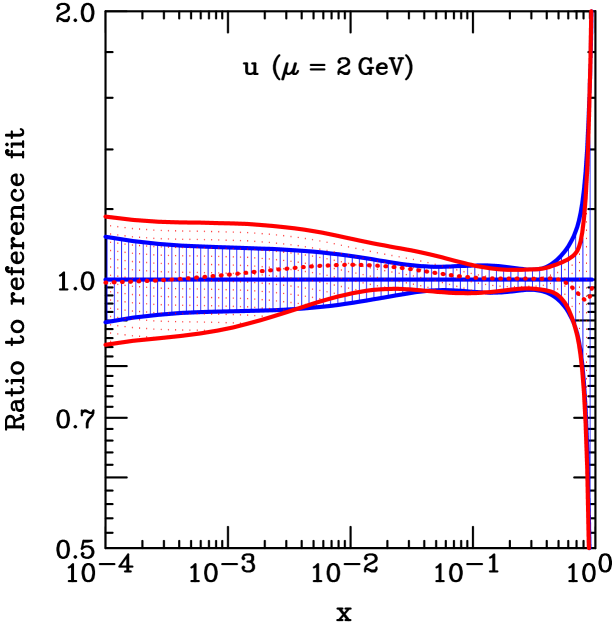
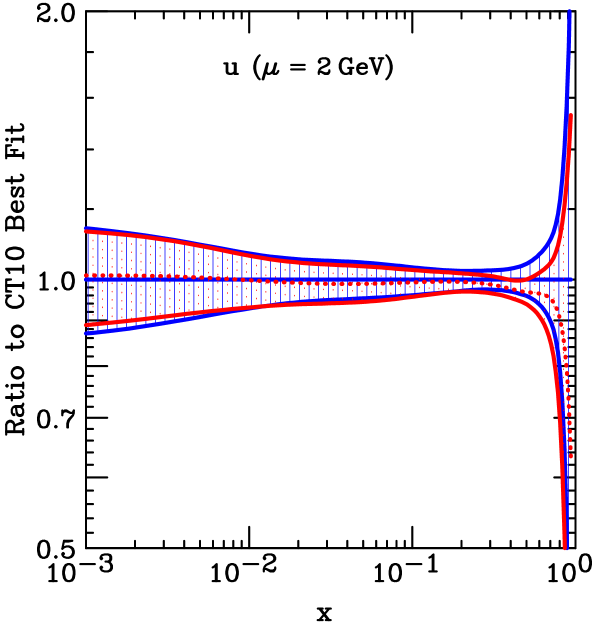
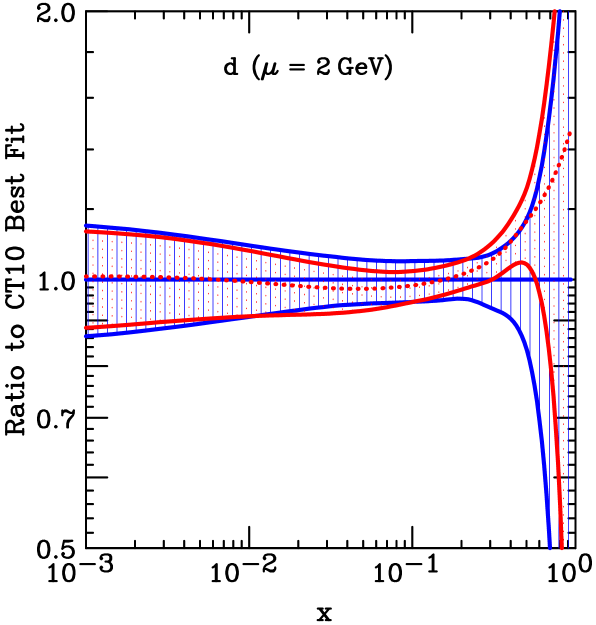
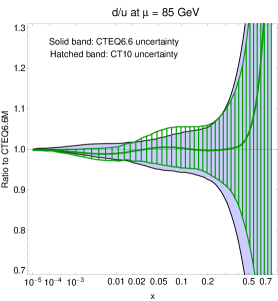
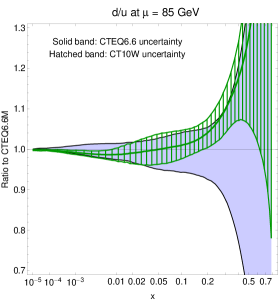
Figure 13 compares the best-fit PDFs and uncertainty ranges for the and quark PDFs in the CT10 and CT10W sets. (The PDFs for the gluon and sea quarks (not shown) are more or less the same in the two sets). The PDFs are compared at scale GeV, but the pattern of their differences persists at larger scales as well. The up quark distribution of CT10W is smaller than that of CT10 at of about 0.2 and above, whereas the down quark distribution is larger in this region. These two changes are induced by the inclusion of the DØ Run-II data. While the uncertainties on and PDFs themselves do not change much between CT10 and CT10W, the ratio for CT10W, shown in Fig. 14, has a markedly different slope at and reduced uncertainty, as compared to CT10. Clearly, the precise data has important implications for the large- ratio and observables sensitive to it.

7 Quality of fits to individual data sets
We will now address the consistency of the CT10(W) global fits with each of the 29 (31) data sets included in the fit. This issue can be explored with several techniques employed by one of us (J. P.) recently in Refs. Collins and Pumplin (2001); Pumplin (2010, 2009). All these approaches require to redo the global fit after introducing special features, such as variable weights for the individual data sets, or a special eigenvector basis in the PDF parameter space.
Alternatively, one might assess the consistency between various data sets directly from the best fit, by studying the values for each individual experiment. In a sample of experiments with data points each, values will be smaller than their most probable values, , in some experiments, and larger than in other experiments. Comparison of observed frequencies of with the expected probabilities would reveal how well the experiments are fit in their ensemble; and it is more informative than just the global for all experiments. For example, the frequency distribution can help one to identify experiments that are fitted too well or too poorly, even if the global is excellent.
Such a comparison can be done with the frequencies directly, but it requires an integration of several distributions with non-identical degrees of freedom, . A faster method uses a secondary statistical distribution derived from the distribution, such that closely resembles some standard distribution and is maximally independent of .
Several distributions of this kind are known to exist (see, e.g., Ref. Lewis (1988), and references therein), with one of the simplest ones attributed to R. A. Fisher Fisher (1925). Fisher’s approximation shows that the function in Eq. 2 (with the subscript ignored) closely follows the standard normal distribution even for small values of . The theoretical distribution for at is approximately Gaussian with the mean and standard deviation of , which implies that the distribution for approaches a Gaussian one with the mean 0 and standard deviation 1. The utility of comes from the fact that its Gaussian approximation is already quite accurate for as small as 10, and it becomes symmetric (not skewed in either direction) faster than the distribution itself (whose skewness is not neglible for up to ).444At , the skewness parameter of the distribution is asymptotically four times smaller than that of the distribution. The values can thus be used to compare the fit quality among experiments with varying numbers of data points, in a simple manner that avoids lengthier calculations based on the direct analysis of .
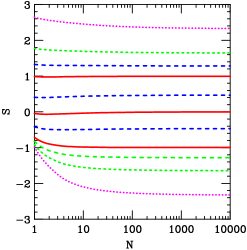
The accuracy of the Gaussian approximation for is demonstrated by Fig. 15. Here we plot contours of the constant cumulative probability in the plane of and . The lines correspond to values for the cumulative probability ranging from 1% to 99%, for each given . Note that the three solid curves, which contain the middle 68% of the distribution, lie very close to , , and . This is entirely expected to happen for the Gaussian limit ; but it is seen here to be a good approximation even down to . For our purposes, the important curves in Fig. 15 are the top three, which contain cumulative probabilities of , , and —e.g., the chance of exceeding the value , 1.6 and 2.4, are , , , respectively, for the whole range of that appears in PDF fitting.
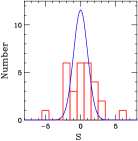
The left side of Fig. 16 shows a histogram of the -values for the 29 data sets included in the CT10 best fit. The smooth bell curve is a Gaussian distribution with mean 0 and variance 1. The observed histogram is compatible with a zero mean, but its variance is larger than unity; it would agree better with a Gaussian with the standard deviation of 2 or 3. This indicates some tension between the experiments, of the magnitude compatible with the findings in other recent studies Pumplin (2010, 2009). It has been observed, for example, that discrepancies between contributions to from individual experiments, which are expected to obey the standard normal distribution, in fact follow a wider normal distribution, with a variance of about 2 Pumplin (2010). It is also interesting to note that such level of discrepancy appears to be independent of the flexibility of the PDF parametrizations. The right-hand side of Fig. 16 shows a histogram of the parameter in a fit with a much more flexible Chebyshev parametrization, which triples the number of the total parameters compared to the CT10 parametrization. In this fit, the distribution still preserves the overall, too wide, shape and does not eliminate the two most-outlying points. (The outlying point on the right is the NMC proton DIS data. The outlying point on the left is the CCFR data.) The analysis of the distribution leads us to believe that non-negligible tensions do exist between the subsets of the current global hadronic data, regardless of the number of free parameters in the PDFs, and contrary to the existing claims of the opposite Ball et al. (2010).222footnotetext: By this measure, similar tensions between the experiments appear to exist in the NNPDF2.0 analysis Ball et al. (2010). The overall =1.27 of that analysis is larger than our 1.1. The parameter distribution of the NNPDF2.0 fit, computed from the breakdown of the values over experiments in Tables 1 and 10 of Ref. Ball et al. (2010), is significantly broader than the expected normal distribution.

8 Applications to Tevatron and LHC Physics
In this section, we examine the impact of the CT10(W) parton distribution functions on the production of , , top quark, Higgs boson and representative new physics signals at the Tevatron Run-II and the LHC. The processes selected are important for benchmark measurements of the Standard Model parameters or illustrate typical patterns of the PDF dependence in new physics searches, as discussed in some detail in the published CTEQ6.6 paper Nadolsky et al. (2008). In addition, we also comment on a recently published measurement of DØ Run-II dijet invariant mass distribution Abazov et al. (2010).
8.1 and Physics
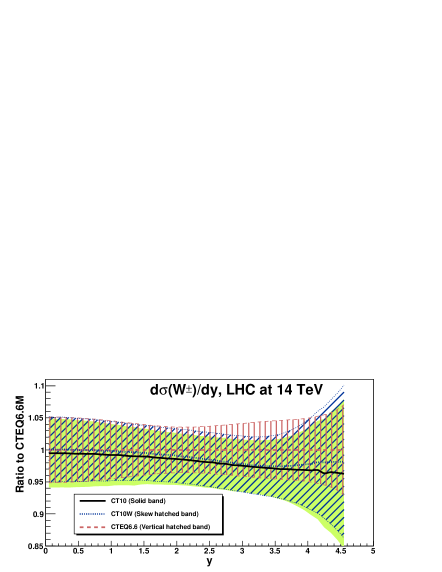
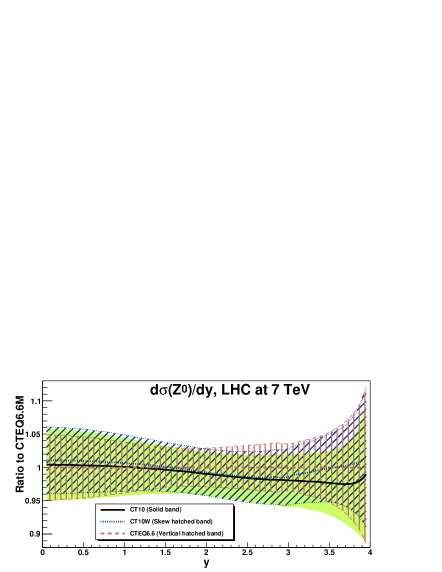
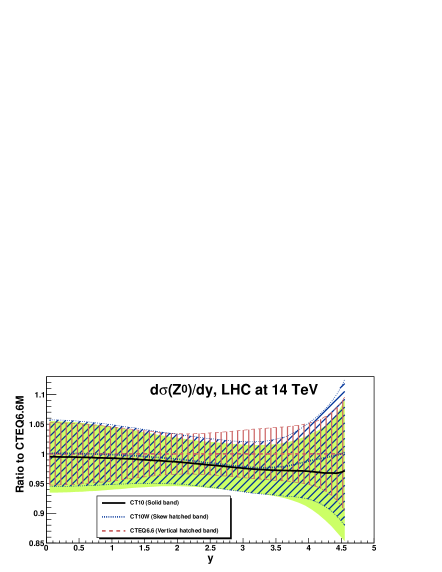
Figure 17 shows the PDF uncertainty bands for the rapidity distributions in inclusive and boson production at the LHC ( and 14 TeV), calculated at NNLL+NLO using a resummation program ResBos Balazs et al. (1995); Balazs and Yuan (1997); Landry et al. (2003) and CT10 (green solid fill), CT10W (blue skew-hatched fill), and CTEQ6.6 (red vertical fill) PDF eigenvector sets. Each cross section is normalized to the corresponding cross section for the CTEQ6.6M PDF. The CT10 and CT10W central predictions are similar to those of CTEQ6.6, but have slightly larger PDF uncertainties for the reasons explained in Sec. 2.
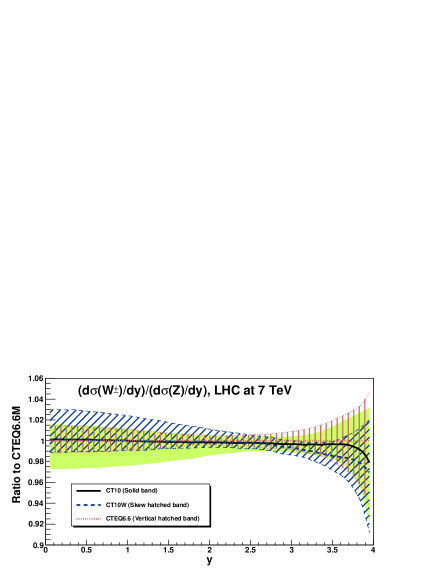
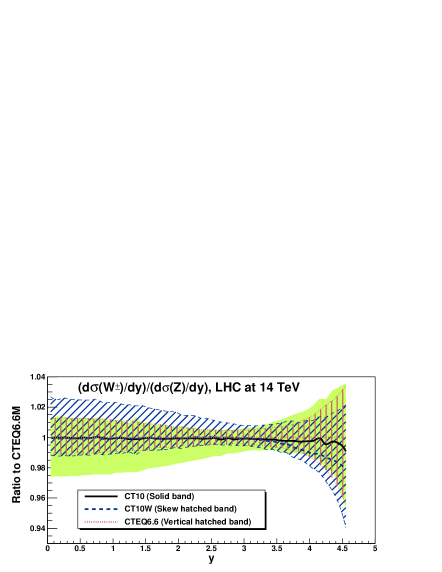
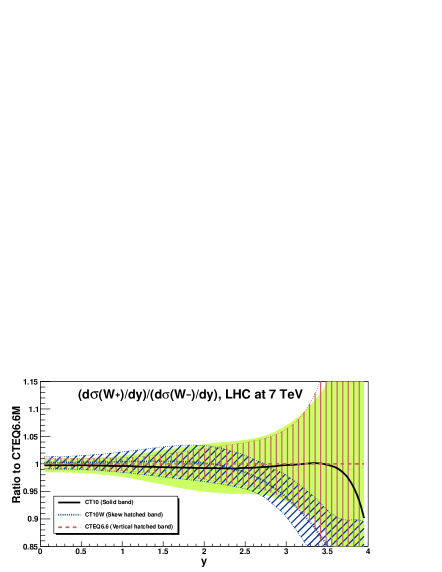
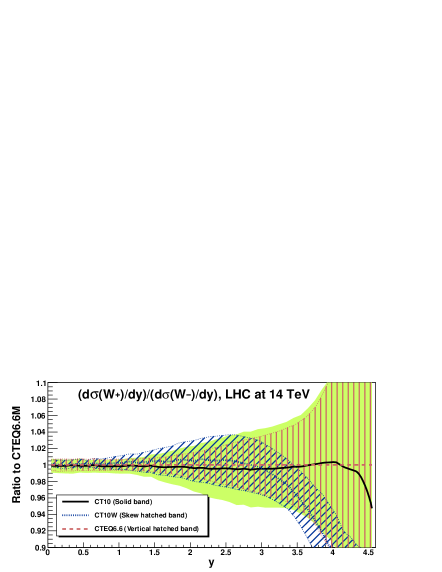
Figure 18 shows the uncertainty bands of three PDF sets for the ratio of the and production cross sections in the upper two subfigures, and for the ratio of and production cross sections in the lower two subfigures. The ratios obtained with CT10W are smaller than the CTEQ6.6 and CT10 ratios at large rapidities (), and they are slightly larger than the CTEQ6.6 and CT10 ratios at small rapidities. For the ratio of the rapidity distributions of + and , both CT10 and CT10W sets predict larger PDF uncertainties than does CTEQ6.6, in the region where the rapidity of the boson is less than about 3. This is a result of the more flexible parametrization of the strange (anti-strange) quark PDF employed in the CT10 and CT10W PDFs. However, for the ratio of to , the CT10 predictions provide a slightly smaller PDF uncertainty than does CTEQ6.6, and CT10W has an even smaller uncertainty. The latter is a result of the inclusion of the DØ Run-II lepton asymmetry data, which reduces the uncertainty in , especially in the large region.
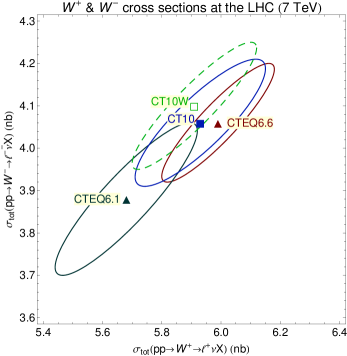
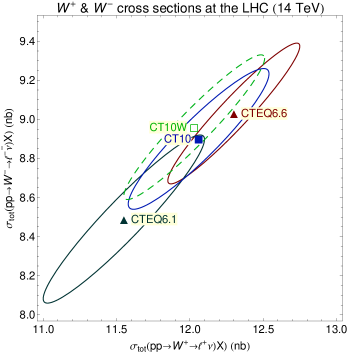
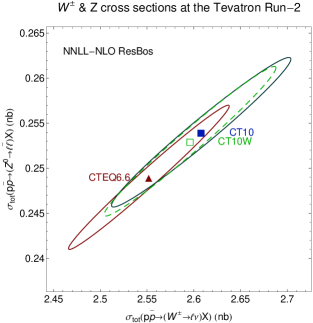
Finally, we examine PDF-driven correlations between the total cross sections for the boson and the boson at the Tevatron Run-II and the LHC. Following the method described in Ref. Nadolsky et al. (2008), we show tolerance ellipses for various cross sections of , and bosons, calculated at NLO in QCD, unless specified otherwise.
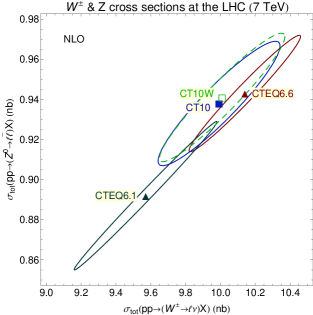
Figure 19 shows the comparison between and total cross sections at the LHC. Compared to CT10, the CT10W set predicts slightly smaller total cross sections and larger cross sections (with the latter increased by 1-2%). The correlation between CT10(W) and cross sections is relaxed somewhat compared to CTEQ6.6, reflecting larger flexibility of the CT10(W) input parametrizations.
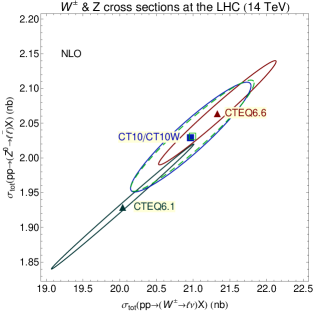
Fig. 20 shows the and total cross sections at the Tevatron Run-II and the LHC. At the Tevatron, the CT10 and CT10W cross sections are larger by 1% than the respective CTEQ6.6 cross sections for both and , which is within the PDF uncertainty ellipse for either PDF set. Also, the CT10 and CT10W ratios of and cross sections at the Tevatron are the same as that for CTEQ6.6. However, while the central CT10(W) cross sections at the LHC also agree with their CTEQ6.6 counterparts within the PDF uncertainties, there is a noticeable difference between the CT10(W) and CTEQ6.6 ratios of and cross sections. In addition, the PDF uncertainties of the and cross sections are less correlated in the case of CT10(W), as a result of additional freedom in the CT10(W) strangeness PDF.

8.2 Other Significant Processes
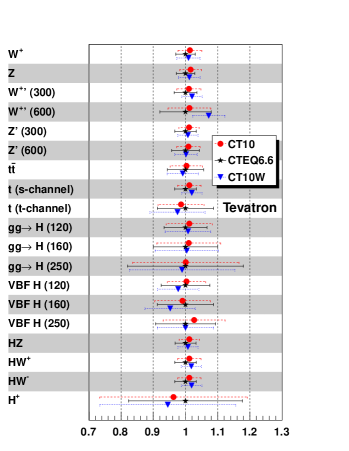
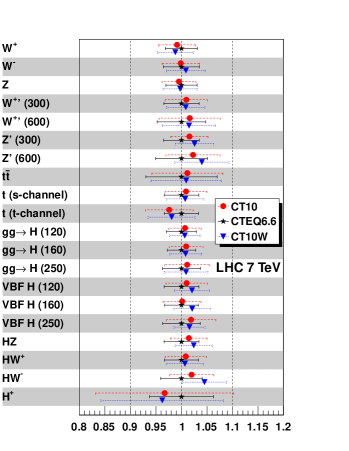

To illustrate the impact of the CT10(W) PDFs on hadron collider phenomenology, we compare the total cross sections of some selected processes at the Tevatron Run-II and the LHC (at center-of-mass energies 7 TeV, 10 TeV and 14 TeV). The processes include the production of , , and bosons, also discussed above; top-quark () pairs; single top-quark in and channels; Standard Model (SM) Higgs boson via gluon fusion (, with Higgs boson mass being 120 GeV, 160 GeV or 250 GeV) Spira (1995); SM Higgs boson via weak gauge boson fusion () Arnold et al. (2009); associated production of SM Higgs boson and a weak gauge boson (, and ); “sequential” heavy weak bosons, and , with masses 300 GeV or 600 GeV; and a 200 GeV charged Higgs boson via , as predicted by the two-Higgs-doublet model. (The couplings of and bosons to fermions are taken to be the same as those in the Standard Model.)
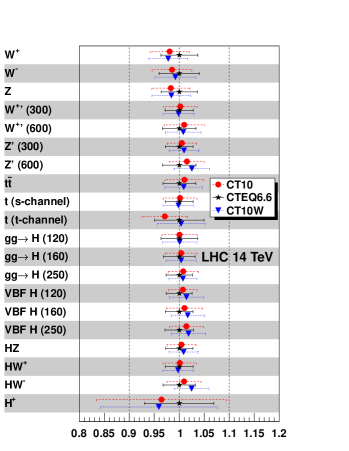
Fig. 21 shows the ratios of the NLO total cross sections, obtained using CT10 and CT10W PDFs, to those obtained using CTEQ6.6 PDFs. For most of the cross sections, CT10 and CT10W sets provide similar predictions and uncertainties, which are also in good agreement with those from CTEQ6.6 (i.e., well within the PDF uncertainty band). At the LHC, the PDF uncertainties in CT10 and CT10W predictions for some processes are larger than those in CTEQ6.6 predictions, reflecting the changes in the framework of the fit discussed in Sec. 2. At the Tevatron, the CT10(W) PDF uncertainties tend to be about the same as those for CTEQ6.6, with a notable exception of production cross sections, which have a smaller PDF uncertainty with the CT10W set, because of stricter constraints on the up- and down-quark PDFs at the relevant values.
Another notable change is in the (600 GeV) production cross section at the Tevatron, which is enhanced with CT10W PDFs as a result of the increase in the large- down quark PDF driven by the data. At the 14 TeV LHC, the total cross sections of and bosons decrease, while those of and increase. The decrease in the central value of the cross section in CT10 and CT10W predictions is due to the decrease in the strange quark PDF at the relevant values; however, its uncertainty also increases with CT10 or CT10W, as compared to the predictions based on the CTEQ6.6 PDFs.
8.3 Dijet Invariant Mass Distributions
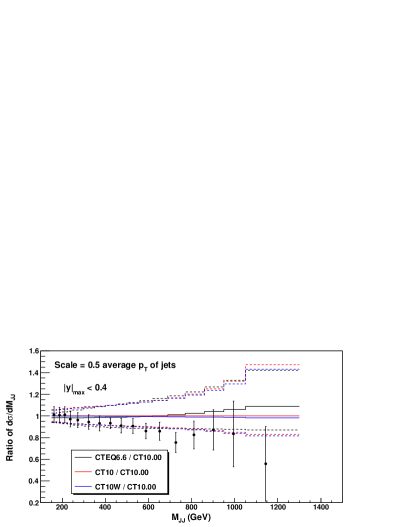

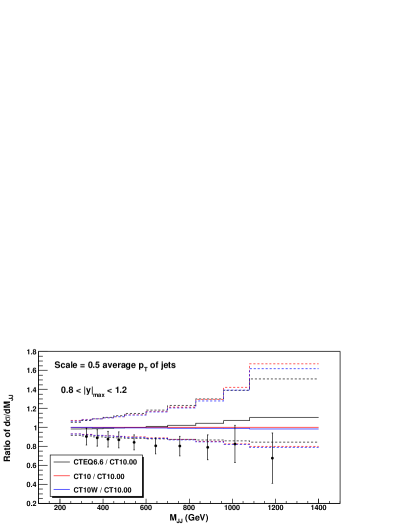
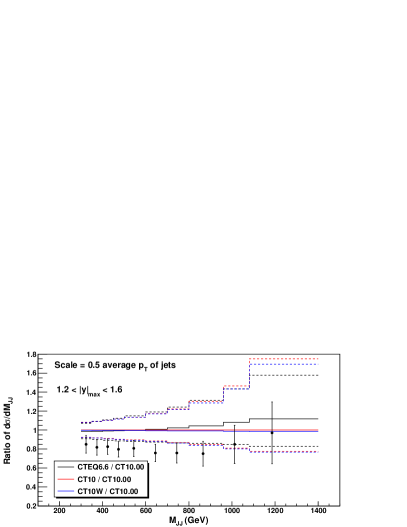


Recently, the DØ Collaboration reported their measurement of the dijet invariant mass distribution Abazov et al. (2010), in which a comparison was made to an NLO theory calculation (with FastNLO code Kluge et al. (2006)) using the CTEQ6.6M PDF set, with both the renormalization and factorization scales set equal to the average of the transverse momentum of the jet pair, . In Fig. 2 of Abazov et al. (2010), it appears that the predictions using the CTEQ6.6M PDFs cannot describe the data in the large dijet invariant mass region. Below, we shall examine the above analysis with a different choice of the hard scale, rather than , which is approximately equal to the scale used in our theoretical cross sections for the Tevatron Run-I and Run-II inclusive jet data. The reason for examining the predictions with this choice of the scale is that the high- gluon distribution in our global fits is primarily determined by the Tevatron inclusive jet data. At NLO, the size of the predicted jet cross sections, and thus the size of the gluon distribution determined, depends tangibly on the assumed renormalization and factorization scales Stump et al. (2003). The gluon distribution in this region would have been different, had the average transverse momentum of the dijet pair been used in the global fit. Of course, both scales are equally valid for the dijet cross section evaluation, but it is important to understand any differences generated by the use of one scale for the the PDF determination and another for the evaluation of the dijet cross section.555The two processes are clearly related, and consist basically of the same events. Such scale uncertainties form a part of theoretical uncertainties arising in PDF determination.
Fig. 22 shows the NLO dijet invariant mass distributions at the Tevatron Run-II, , for CTEQ6.6 (black), CT10 (red) and CT10W (blue) PDFs, normalized to for the CT10.00 PDF, and including the PDF uncertainties. The cross sections are computed in bins of , with the renormalization and factorization scales chosen to be . The DØ data, with statistical and total systematic errors added in quadrature, are also shown. We find that with this choice of the scale, all three PDF sets are in better agreement with the data than the conclusions of the DØ paper Abazov et al. (2010) indicate, although an overall systematic shift, of order of the systematic shifts observed in the CT09 study of the related single-inclusive jet distributions Pumplin et al. (2009), may further improve the agreement. As shown in the figure, the predictions for the central fits of CT10 and CT10W PDFs are close to each other and closer to the data than CTEQ6.6.
The extent of the CTEQ6.6, CT10, and CT10W PDF uncertainty bands in this ratio is larger, by a factor of two, than those derived from the MSTW2008 PDFs. As a result, the MSTW2008 predictions are within our error bands, although the reverse is not true.666This observation is consistent with the analysis of the dijet invariant mass distribution of CDF Run-II data Abazov et al. (2010), which also shows a sizable uncertainty band using CTEQ6.6 PDFs. The PDF error bands for large dijet masses are not symmetric; the upper side has more variation than the lower side. The asymmetry arises because dijet production at large and is dominated by quark-quark or quark-antiquark scatterings, with a smaller contribution from gluon-quark scattering. Since the quark distributions are relatively better determined at medium to large values, the differential cross section of the dijet invariant mass distribution cannot become too small. (The quark-gluon scattering process can only increase the cross sections.)
9 Conclusions
With the LHC is reporting its first cross sections, it becomes even more important to provide the best tools necessary for accurate predictions and comparisons to those cross sections. We have produced two new PDF sets, CT10 and CT10W, intended for comparisons to data at the Tevatron and LHC. The two PDF sets include new data, primarily the DIS combined data sets from HERA Aaron et al. (2010), the rapidity distribution of production at the Tevatron, and the Tevatron Run-II lepton asymmetry data from the DØ Collaboration, as well as several improvements to the global fitting procedure. The latter includes more flexible PDF parametrizations, the treatment of experimental normalizations in the same manner as other systematic uncertainties, the removal of weights associated with the data sets (except for the lepton asymmetry data in the case of CT10W), and a more dynamical determination of the allowed tolerance along each eigenvector direction.
Due to the difficulty in fitting both the Tevatron Run-II lepton asymmetry data and the other data sets in the global analysis (primarily, the deuteron/proton DIS cross section ratio from the NMC experiment), we have produced two new families of PDFs, CT10 and CT10W. CT10 is obtained without using the DØ Run-II lepton asymmetry data, while CT10W contains those high-luminosity data with added weights to ensure reasonable agreement. The resulting predictions for LHC benchmark cross sections, at both 7 TeV and 14 TeV, are generally consistent with those from the older CTEQ6.6 PDFs, in some cases with a slightly larger uncertainty band. The latter is a result of the greater flexibility included in this new generation of global fits. Most noticeable differences in various cross sections, such as the charged Higgs boson and extra heavy gauge boson production, are induced by changes in the strange-quark PDF, the gluon PDF in the small- region, and the up-quark and down-quark PDFs in the medium to large region.
As compared to the CTEQ6.6 prediction, both CT10 and CT10W predict a smaller PDF induced uncertainty in the total cross section for the top-quark pair production at the Tevatron Run-II. No large differences are observed for LHC predictions between the CT10 and CT10W PDF sets, except in those observables that are sensitive to the ratio of down-quark to up-quark PDFs. One example is the ratio of the rapidity distributions of the and bosons produced at the LHC.
In summary, the CT10 and CT10W sets are based on the most up-to-date information about the PDFs available from global hadronic experiments. There are 26 free parameters in both new PDF sets; thus, there are 26 eigenvector directions and a total of 52 error PDFs for both CT10 and CT10W. The CT10 and CT10W PDF error sets, along with the accompanying error sets, allow for a complete calculation of the combined PDF+ uncertainties for any observable Lai et al. (2010). To support calculations for heavy-quark production in the fixed-flavor-number factorization scheme, we provide additional PDF sets CT10(W).3F and CT10(W).4F, obtained from the best-fit CT10.00 and CT10W PDF sets by QCD evolution with three and four active quark flavors. All the relevant PDF sets discussed in this paper are available as a part of the LHAPDF library lha and from our website ct (1).
Acknowledgments
We thank A. Glazov for advice on the implementation of HERA-1 correlated errors, and M. Wobisch for help with implementation of DØ Run-II dijet production data. We also thank S. Forte, J. Linnemann, L. Lyons, F. Olness, J. Rojo, H. Schellman, D. Stump, R. Thorne, J. Zhu, and CTEQ members for useful discussions. We are grateful to the Center for High Energy Physics at Peking University in China (visited by C.P.Y.), National Center for Theoretical Sciences in Taiwan (visited by C.P.Y. and H.L.L), and the Aspen Center for Physics in Aspen, Colorado (visited by P.N.), for their hospitality during the work on a part of this study. This work was supported in part by the U.S. DOE Early Career Research Award DE-SC0003870; by the U.S. National Science Foundation under grant PHY-0855561; by the National Science Council of Taiwan under grants NSC-98-2112-M-133-002-MY3 and NSC-99-2918-I-133-001; by LHC Theory Initiative Travel Fellowship awarded by the U.S. National Science Foundation under grant PHY-0705862; and by Lightner-Sams Foundation.
Appendix: Agreement of QCD theory with the combined HERA-1 data
In this Appendix, we provide additional details on the comparison of CT10 predictions with the combined HERA data, and the origin of the increase in that is observed when the independent HERA data sets are combined. The values in the intervals , , and , found in the CT10 best fit to the combined (CT10.00) and separate (CT10-like) HERA-1 data sets, as well as in the CTEQ6.6M fit, are listed in Table 3. At , is about 1.19 for the combined HERA-1 set, vs. 0.81-0.84 in the fits to the separate sets. At , where irregular scatter is obvious in the plots of both and NC sets (cf. Fig. 1), is increased upon the combination of the data sets from 1.25 to 1.43.
| range | CT10.00, comb. | CT10-like, sep. | CTEQ6.6M | |||
|---|---|---|---|---|---|---|
| <0.001 | 63 | 1.19 | 68 | 0.81 | 68 | 0.84 |
| 0.001-0.1 | 298 | 0.94 | 485 | 0.92 | 485 | 0.92 |
| >0.1 | 150 | 1.43 | 257 | 1.26 | 257 | 1.25 |

To see if these increases in may be caused by systematic discrepancies, we plot histograms of relative frequencies of residuals for each data point ,
| (8) |
with
| (9) |
in each range listed in Table 3, and in notations of Sec. 4. In an excellent fit, the residuals follow a standard normal distribution, with a mean of zero and a unit standard deviation. A non-zero mean observed in the actual distribution would indicate a systematic discrepancy affecting the whole histogrammed set of points; on the other hand, a smaller or larger than normal width may be due to incorrectly estimated random effects (see Appendix B.2 in Ref. Pumplin et al. (2002)).
Distributions of the residuals for the best fits to the combined and separate HERA-1 sets are plotted in Fig. 23. At (central figure), frequencies of the residuals agree well with the standard distribution, regardless of whether the HERA-1 sets are separate or combined. At , the mean of the residual distribution remains consistent with zero upon the combination of the data sets, while the width of the distribution increases. The residual distribution at also widens and changes the shape, with more residuals having small negative values or large positive (outlying) values, as compared to the fit to the separate sets. Neither of these patterns indicates systematic deviations of the data from NLO QCD theory. On the other hand, the histograms are suggestive of significant point-to-point random fluctuations in the NC DIS data at and , which appear to be exacerbated when the systematic uncertainties are reduced through the combination of the data sets.

An alternative perspective is provided by dependence on a “geometric scaling” variable (with ), which may reveal disagreements with the NLO QCD framework in the region of small and .777 is proportional to the variable arising in some saturation models Stasto et al. (2001); Caola and Forte (2008). The parameter has been studied in recent NNPDF1.2 and 2.0 global analyses to seek possible deviations from NLO DGLAP factorization due to saturation or related small- phenomena Caola et al. (2010a, b). In the region , Refs. Caola et al. (2010a, b) found a systematic disagreement between the dependence of the measured DIS cross sections and the prediction based on the NLO DGLAP evolution of their PDFs, according to a pattern consistent with saturation effects. This discrepancy is not expected to be remedied by NNLO corrections, as those include large logarithms requiring all-order summation in the small- region. If confirmed, it will profoundly affect our understanding of high-energy QCD and various phenomenological applications.
The disagreement stated by NNPDF is not significant (below ) if the data at small are included in the fit. However, it becomes significant at the level of or more if the small- data are excluded while determining the PDFs (so that the PDFs are fitted only to the large- data, for which the DGLAP factorization is presumably valid), but included at the end, when comparing the full data sample to the resulting theoretical cross sections.
We repeated a part of the NNPDF study in the region GeV, where our data are selected. Our goal is to find out if any deviations exist in the included region, where higher-order corrections are known to be mild, and with the full general-mass treatment of heavy quarks. (The NNPDF analysis is realized in the zero-mass approximation and also includes DIS data in the less safe region GeV.) Besides the CT10 fit, several additional fits were performed only to the data at , and using several parametrizations of the gluon PDF at to estimate the sensitivity to the initial parametrization choice. 888In this exercise, we did not estimate the full uncertainty due to the parametrization dependence. Obviously it is larger than the (already significant) differences between the fits that are explicitly presented. While the outcomes of these fits bear some similarity to those by NNPDF, the spread of the outcomes appears to be too wide to corroborate the existence of the deviations.
In more detail, some fits with the imposed constraints produce systematic deficits in theoretical cross sections at below 1.0, in a pattern that is similar to that observed by NNPDF. Since the largest discrepancies are observed in the fits to the data above , we focus on two representative fits with this value for the rest of the discussion. Fig. 24 compares the CT10 fit and two fits with to a subset of HERA data at small and . The theoretical predictions in this figure are shifted toward the data by the amounts found from the correlation matrix for experimental systematic errors. All three fits agree well with the data at large and , but downward deviations of the fits emerge at , corresponding to the lowest values in the upper four bins in Fig. 24.
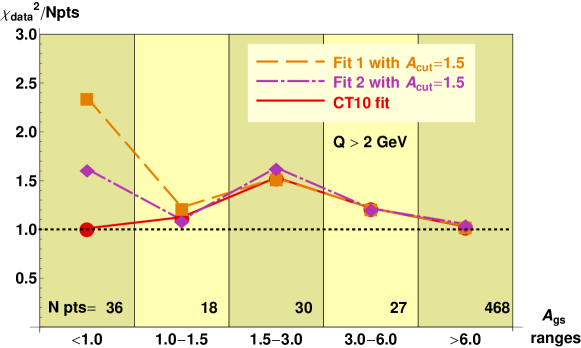
Fig. 25 shows the breakdown of contributions from the data points, given by the first term (without ) in Eq. (4), by various ranges of . In the fitted region , the fits result in that is the same or slightly better (by no more than 10-15 units) than the total observed in the CT10 fit, for 525 data points and 114 systematic error parameters. In the interval , the fits agree closely with the data, as well as with the CT10 fit. At , the CT10 fit results in an essentially ideal value of , while the deficit in the predictions of the fits increases their considerably. The magnitude of the deficits varies by large amounts between the fits, with their taking any values between 1 and 2.5 in the region. Similar distributions of vs. are obtained if only the data that “causally connected” by the DGLAP evolution Caola et al. (2010a) are included; see the equivalent of Fig. 25 for this case on the CT10 website ct (1).
It is interesting to compare the breakdown of our values in Fig. 25 with that in two NNPDF2.0 fits without and with the cut, taken from Fig. 8 in Ref. Caola et al. (2010b). Note again that the cuts assumed by CT10 and NNPDF2.0 (and the data samples included) are slightly different. The quality of the fits obtained by the two groups is comparable, with (1.14) for the combined HERA-1 data in the CT10 fit (NNPDF2.0 fit Ball et al. (2010)). In the CT10 fit, both the small- and large- ranges, and , are fitted very well (), while somewhat higher-than-ideal is observed at . In the NNPDF2.0 fit, the region has a lower than in the CT10 fit, but the quality of the fit progressively deteriorates, as decreases, and gets worse than that in the CT10 fit at . With the cut placed at 1.5, the NNPDF fit significantly disagrees with the data in the whole excluded region , with ; some deterioration of is also observed in the borderline region of the fitted data, . In our analysis, the CT10 fit and fits are very close for all above 1.0, with more pronounced differences showing up only at .
Taken together, the results of the two groups suggest instability of the outcomes of the fits outside of the fitted region of the DIS data. Indeed, all examined fits, without or with the cuts, produce close results when describing the fitted data; but their small differences in the fitted region cause significant differences outside of it.
Several features of the fits may contribute to the instability. Backward DGLAP evolution from a high scale to lower scales requires to know accurately the and derivatives of the PDFs, given that very distinct shapes of the PDFs at the low scale may correspond to close shapes of the PDFs at the high scale. With the data at the smallest and excluded, the fit loses sensitivity to the derivatives in the region where the PDFs are varying rapidly. Extrapolation from the fitted region, with only a limited lever arm in and available for it, may be inaccurate at the smallest values considered.
The fits do not fully evaluate the experimental systematic parameters , some of which affect mostly small and values and are excluded from the fit by the condition. While wrong estimation of experimental systematics may not explain all observed discrepancies, the systematic effects shift the data (or theory) predictions at small in approximately the same way as the fits do and, hence, require careful consideration.
References
- Alekhin et al. (2010) S. Alekhin, J. Blumlein, S. Klein, and S. Moch, Phys. Rev. D81, 014032 (2010).
- Ball et al. (2010) R. D. Ball et al. (Neural Network PDF Collaboration), Nucl. Phys. B838, 136 (2010).
- Pumplin et al. (2009) J. Pumplin et al., Phys. Rev. D80, 014019 (2009).
- Aaron et al. (2010) F. D. Aaron et al. (H1 Collaboration), JHEP 01, 109 (2010).
- Martin et al. (2009) A. D. Martin, W. J. Stirling, R. S. Thorne, and G. Watt, Eur. Phys. J. C63, 189 (2009).
- Nadolsky et al. (2008) P. M. Nadolsky et al., Phys. Rev. D78, 013004 (2008).
- Aaltonen et al. (2008) T. Aaltonen et al. (CDF Collaboration), Phys. Rev. D78, 052006 (2008).
- Abazov et al. (2008a) V. M. Abazov et al. (DØ Collaboration), Phys. Rev. Lett. 101, 062001 (2008a).
- Affolder et al. (2001) A. A. Affolder et al. (CDF Collaboration), Phys. Rev. D64, 032001 (2001).
- Abbott et al. (2001) B. Abbott et al. (DØ Collaboration), Phys. Rev. D64, 032003 (2001).
- Aaltonen et al. (2010) T. A. Aaltonen et al. (CDF Collaboration) (2010), eprint 0908.3914.
- Abazov et al. (2007) V. M. Abazov et al. (DØ Collaboration), Phys. Rev. D76, 012003 (2007).
- Acosta et al. (2005) D. Acosta et al. (CDF Collaboration), Phys. Rev. D71, 051104 (2005).
- Abazov et al. (2008b) V. M. Abazov et al. (DØ Collaboration), Phys. Rev. Lett. 101, 211801 (2008b).
- Abazov et al. (2008c) V. M. Abazov et al. (DØ Collaboration), Phys. Rev. D77, 011106 (2008c).
- Pumplin (2010) J. Pumplin, Phys. Rev. D81, 074010 (2010).
- Collins and Pumplin (2001) J. C. Collins and J. Pumplin (2001), eprint hep-ph/0105207.
- Pumplin (2009) J. Pumplin, Phys. Rev. D80, 034002 (2009).
- Stump et al. (2001) D. Stump et al., Phys. Rev. D65, 014012 (2001).
- Pumplin et al. (2002) J. Pumplin et al., JHEP 07, 012 (2002).
- James and Roos (1975) F. James and M. Roos, Comput. Phys. Commun. 10, 343 (1975).
- Gribov and Lipatov (1972) V. N. Gribov and L. N. Lipatov, Yad. Fiz. 15, 781 (1972), [Sov. J. Nucl. Phys. 15 438 (1972)].
- Altarelli and Parisi (1977) G. Altarelli and G. Parisi, Nucl. Phys. B126, 298 (1977).
- Dokshitzer (1977) Y. L. Dokshitzer, Sov. Phys. JETP 46, 641 (1977).
- Pumplin et al. (2001) J. Pumplin et al., Phys. Rev. D65, 014013 (2001).
- Salam and Rojo (2009) G. P. Salam and J. Rojo, Comput. Phys. Commun. 180, 120 (2009).
- ct (1) http://hep.pa.msu.edu/cteq/public/ct10.html.
- Lai et al. (2010) H.-L. Lai et al. (2010), eprint arXiv:1004.4624.
- Abe et al. (1995) F. Abe et al. (CDF), Phys. Rev. Lett. 74, 850 (1995).
- (30) https://www.desy.de/h1zeus/combined_results/.
- Nadolsky and Sullivan (2001) P. M. Nadolsky and Z. Sullivan (2001), eprint hep-ph/0110378.
- Berger et al. (1989) E. L. Berger, F. Halzen, C. S. Kim, and S. Willenbrock, Phys. Rev. D40, 83 (1989).
- Martin et al. (1989) A. D. Martin, R. G. Roberts, and W. J. Stirling, Mod. Phys. Lett. A4, 1135 (1989).
- Benvenuti et al. (1989) A. C. Benvenuti et al. (BCDMS Collaboration), Phys. Lett. B223, 485 (1989).
- Benvenuti et al. (1990) A. C. Benvenuti et al. (BCDMS Collaboration), Phys. Lett. B237, 592 (1990).
- Aubert et al. (1987) J. J. Aubert et al. (European Muon Collaboration), Nucl. Phys. B293, 740 (1987).
- Whitlow (1990) L. W. Whitlow, Ph.D. thesis, Stanford University (1990), report SLAC-0357, and references therein.
- Amaudruz et al. (1992) P. Amaudruz et al. (New Muon Collaboration), Phys. Lett. B295, 159 (1992).
- Badelek and Kwiecinski (1992) B. M. Badelek and J. Kwiecinski, Nucl. Phys. B370, 278 (1992).
- Virchaux and Milsztajn (1992) M. Virchaux and A. Milsztajn, Phys. Lett. B274, 221 (1992).
- Bazizi and Wimpenny (1991) K. Bazizi and S. J. Wimpenny (1991), preprint UCR-DIS-91-02.
- Milsztajn et al. (1991) A. Milsztajn, A. Staude, K. M. Teichert, M. Virchaux, and R. Voss, Z. Phys. C49, 527 (1991).
- Martin et al. (1994) A. D. Martin, W. J. Stirling, and R. G. Roberts, Phys. Rev. D50, 6734 (1994).
- Lai et al. (1995) H.-L. Lai et al., Phys. Rev. D51, 4763 (1995).
- Catani et al. (2010) S. Catani, G. Ferrera, and M. Grazzini, JHEP 05, 006 (2010).
- Accardi et al. (2010) A. Accardi et al., Phys. Rev. D81, 034016 (2010).
- Thorne et al. (2010) R. S. Thorne, A. D. Martin, W. J. Stirling, and G. Watt (2010), eprint arXiv:1006.2753.
- Balazs et al. (1995) C. Balazs, J. Qiu, and C.-P. Yuan, Phys. Lett. B355, 548 (1995).
- Balazs and Yuan (1997) C. Balazs and C.-P. Yuan, Phys. Rev. D56, 5558 (1997).
- Landry et al. (2003) F. Landry, R. Brock, P. M. Nadolsky, and C.-P. Yuan, Phys. Rev. D67, 073016 (2003).
- Lai et al. (1997) H.-L. Lai et al., Phys. Rev. D55, 1280 (1997).
- Arneodo et al. (1995) M. Arneodo et al. (New Muon Collaboration), Phys. Lett. B364, 107 (1995).
- Lewis (1988) T. Lewis, Austral. J. Statist. 30A, 160 (1988).
- Fisher (1925) R. A. Fisher, Statistical methods for research workers (Oliver and Boyd, Edinburgh, 1925), chap. 4, an Internet version of the 1st edition at http://psychclassics.yorku.ca/Fisher/Methods/.
- Abazov et al. (2010) V. M. Abazov et al. (DØ Collaboration) (2010), eprint arXiv:1002.4594.
- Spira (1995) M. Spira (1995), eprint hep-ph/9510347.
- Arnold et al. (2009) K. Arnold et al., Comput. Phys. Commun. 180, 1661 (2009).
- Kluge et al. (2006) T. Kluge, K. Rabbertz, and M. Wobisch (2006), eprint hep-ph/0609285.
- Stump et al. (2003) D. Stump et al., JHEP 10, 046 (2003).
- (60) http://projects.hepforge.org/lhapdf/.
- Stasto et al. (2001) A. M. Stasto, K. J. Golec-Biernat, and J. Kwiecinski, Phys. Rev. Lett. 86, 596 (2001).
- Caola and Forte (2008) F. Caola and S. Forte, Phys. Rev. Lett. 101, 022001 (2008).
- Caola et al. (2010a) F. Caola, S. Forte, and J. Rojo, Phys. Lett. B686, 127 (2010a).
- Caola et al. (2010b) F. Caola, S. Forte, and J. Rojo (2010b), eprint arXiv:1007.5405.