Ionization of 1D and 3D oriented asymmetric top molecules by intense circularly polarized femtosecond laser pulses
Abstract
We present a combined experimental and theoretical study on strong-field ionization of a three-dimensionally oriented asymmetric top molecule, benzonitrile (C7H5N), by circularly polarized, nonresonant femtosecond laser pulses. Prior to the interaction with the strong field, the molecules are quantum-state selected using a deflector, and 3-dimensionally (3D) aligned and oriented adiabatically using an elliptically polarized laser pulse in combination with a static electric field. A characteristic splitting in the molecular frame photoelectron momentum distribution reveals the position of the nodal planes of the molecular orbitals from which ionization occurs. The experimental results are supported by a theoretical tunneling model that includes and quantifies the splitting in the momentum distribution. The focus of the present article is to understand strong- eld ionization from 3D-oriented asymmetric top molecules, in particular the suppression of electron emission in nodal planes of molecular orbitals. In the preceding article [Dimitrovski et al., Phys. Rev. A 83, 023405 (2011)] the focus is to understand the strong- eld ionization of one-dimensionally-oriented polar molecules, in particular asymmetries in the emission direction of the photoelectrons.
pacs:
33.80.Rv, 33.80.Eh, 42.50.Hz, 37.20.+j, 37.10.VzI Introduction
Photoelectron spectroscopy has been and remains a ubiquitous and useful method to obtain information about the electronic structure of molecules. In the most traditional form absorption of a single photon frees a single electron from the molecule and the kinetic energy is recorded. The classical use of photoelectron spectroscopy is the determination of binding energies of molecular orbitals and possibly of the vibrational substructure Reid (2003). Over the past 10-15 years such spectroscopy in combination with femtosecond pump-probe methods has been demonstrated to be also a powerful technique for obtaining time-resolved insight into the coupled electronic and vibrational dynamics occurring after photoabsorption in polyatomic molecules A. Stolow et al. (2004); Stolow and Underwood (2008).
In addition to the kinetic energy, the emission direction of the electron is a highly useful experimental observable provided it is detected for defined vibrational and rotational states of the cation formed Hockett et al. (2009) or if it is measured with respect to the molecular frame Reid (2003); Suzuki (2006). One experimental approach to obtaining molecular frame photoelectron angular distributions (MFPADs) is to determine the molecular frame after the ionization event. This is possible if ionization leads to fragmentation of the molecule and the electrons can be measured in coincidence with fragment ions recoiling in directions that directly reflect the molecular orientation at the moment of ionization, a condition often referred to as the axial recoil limit. Such coincidence methods have been applied successfully, predominantly to small molecules where synchrotron radiation removes an inner shell electron Shigemasa et al. (1995); D. Akoury et al. (2007); M. S. Schöffler et al. (2008); Yamazaki et al. (2009), but also to situations where valence electrons are removed by UV radiation Davies et al. (2000); Rijs et al. (2004); Gessner et al. (2006).
The other experimental approach to MFPADs is to fix the orientation prior to the ionization event, which offers the obvious advantage that no fragmentation of the molecule is needed. Using resonant photoexcitation mild 1D alignment can be created for molecules in excited states Suzuki (2006); Tang et al. (2010). Alternatively, alignment methods, based on the application of moderately intense, nonresonant laser pulses, can confine the principal axes of polarizability of molecules sharply along space-fixed axes Stapelfeldt and Seideman (2003) and, thereby, provide the desired fixed-in-space targets for photoionization of molecules possessing an inversion center. The first experiments showing MFPADs measurement from aligned, inversion symmetric (unpolar) linear molecules were reported 2008-2009 Meckel et al. (2008); Kumarappan et al. (2008); Bisgaard et al. (2009). Targets of molecules lacking an inversion center (i.e., polar molecules) must, in addition to having their axes confined, possess a directional order of their dipole moment, i. e., the molecules must be oriented as well as aligned Stapelfeldt and Seideman (2003). One approach to efficient orientation and alignment is through the combined action of a laser pulse and a weak static electric field Friedrich and Herschbach (1999); Sakai et al. (2003); Ghafur et al. (2009); Holmegaard et al. (2009).
In the present work we study single ionization of 1D and 3D aligned and oriented samples of the prototypical asymmetric top molecule benzonitrile by intense, circularly polarized femtosecond laser pulses, extending our first results reported recently Holmegaard et al. (2010). For 1D aligned and oriented molecules pronounced up-down asymmetries of the electron emission are observed resulting from a higher probability for ionization when the circularly polarized field points along the permament dipole moment of benzonitrile compared to the opposite direction. These results are similar to those obtained for the linear OCS molecules reported in the accompanying paper Dimitrovski et al. (2010). For 3D aligned and oriented molecules striking suppression of electron emission in the polarization plane of the ionizing laser is observed. Our theoretical analysis, relying on a modified tunnel ionization theory, identifies the suppression as resulting from nodal planes in the orbitals from which electrons are removed. Note that effects of nodal plane structure and orbitals below the highest occupied molecular orbital on strong field ionization of in symmetric molecules was discussed theoretically some time ago Kjeldsen et al. (2003, 2005).
The paper is organized as follows. In Sec. II, the experimental setup is discussed. The experimental results are presented in Sec. III, including a discussion of the method of deflection, alignment and orientation of the benzonitrile molecules, and the MFPADs from strong-field single ionization of benzonitrile by a circularly polarized femtosecond laser field. Section IV contains the theory including a discussion of the characteristic off-nodal-plane emission pattern. In Sec. V, the theoretical MFPADs are compared with the experimental ones. Section VI concludes and gives a brief outlook. The molecular properties of benzonitrile, used in the theoretical model, are summarized in Appendix A.
II Experimental setup
II.1 Molecular beam apparatus
An exploded schematic of the molecular beam apparatus, used in these studies, is shown in Fig. 1.
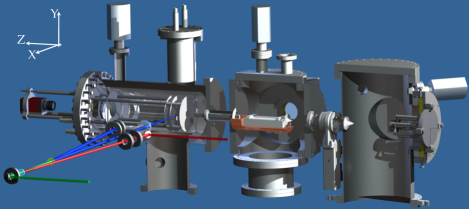
It consists of three vacuum chambers: the source chamber, pumped by a 2000 l/s turbomolecular pump, followed by the deflector and the target chamber which are both pumped by 500 l/s turbomolecular pumps. The molecular beam is formed by expanding a mixture of carrier gas (typically 90 bar of Helium) and the molecular gas (5 mbar of benzonitrile) into the source chamber through a high-pressure Even Lavie valve U. Even et al. (2000); M. Hillenkamp et al. (2003) heated to 40 ∘C. Operating the valve at high stagnation pressure and fine tuning the valve opening time ensures formation of a cold molecular beam without cluster formation. We estimate the rotational temperature of the molecular gas with two independent techniques. One relies on comparing experimentally observed degrees of alignment with theoretical calculations for a temperature averaged sample of molecules Kumarappan et al. (2006), whereas in the other method vertical molecular beam profiles of electrostatically deflected molecules are measured and compared with simulations Filsinger et al. (2009). We find that the typical rotational temperature is 1 K. The experiments are performed at 20 Hz limited by the repetition rate of the alignment laser. The molecular beam is skimmed twice, 14 and 38 cm downstream from the nozzle of the Even-Lavie valve, respectively, to collimate the expansion. The first skimmer, positioned at the exit of the source chamber, has a 3-mm diameter (Beam Dynamics model 50.8). In the deflector chamber the molecular beam passes through the second skimmer (1-mm diameter Beam Dynamics model 2) just before entering the 15-cm-long electrostatic deflector.
II.2 Electrostatic deflector
The deflector consists of a trough-shaped electrode with a 3.2-mm-inner-radius of curvature kept at ground potential and a polished rod with a radius of 3.0 mm to which high voltage (up to 10 kV) can be applied Filsinger et al. (2009). The rod is kept floating above the trough by two pieces of macor, providing a minimum distance of 0.9 mm between the electrodes and 1.4-mm-separation at the molecular beam axis. This electrode geometry creates a two wire field, that is strongly inhomogeneous along the (vertical) Y-axis while it is almost homogeneous in the X direction Ramsey (1956). Therefore, polar molecules traversing the deflector experience a force in the vertical direction with molecules in high-field seeking states being deflected upwards. The extent of deflection for a molecule depends on the effective dipole moment of the particular molecular quantum state. As the molecules exit the deflector, they enter a parallel plate capacitor consisting of two 17-cm-long polished stainless steel plates separated by 2.7 mm. The plates are oriented parallel to the deflection direction. The capacitor creates a constant dc electric field on the order of 2 kV/cm along the path of the molecules moving from the deflector to the laser interaction zone. This finite field prohibits population transfer between quantum states due to Majorana transitions between -levels of individual rotational states at zero field, and it mitigates transfer due to diabatic traversal of avoided crossings induced by rotations or inhomogeneities of the electric field, which occur frequently at small field strengths Wohlfart et al. (2008a); Kirste et al. (2009); Wall et al. (2010)
II.3 Velocity map imaging spectrometer and laser beams
The target chamber houses a velocity map imaging (VMI) spectrometer consisting of an open three-electrode electrostatic lens A. T. J. B. Eppink and D. H. Parker (1997). Between the first two electrodes (repeller and extractor) the molecular beam is crossed by two (or more) pulsed laser beams as indicated with the red and blue (and green) cylinders in Fig. 1. Applying positive (negative) voltages to the electrostatic lens ions (electrons) in the interaction region are accelerated towards a 50-mm-diameter microchannel plate (MCP) backed by a similar size phosphor screen. The ion (or electron) images are recorded by a CCD camera monitoring the fluorescent phosphor screen, and on-line software analysis determines and saves the coordinates of each individual particle hit. When imaging ions the MCP detector can be gated by applying a fast high-voltage pulse to its front thereby obtaining images for a selected range of mass-to-charge ratios. The spectrometer is caged in a single concentric mu-metal cylinder to minimize the influence of external magnetic fields on the trajectories of the electrons.
The laser systems, as well as the spatial and temporal overlap of different laser beams with the molecular beam is similar to that reported before Kumarappan et al. (2006) so the description here is brief. The fundamental output (1064 nm) from a 20 Hz, Nd:YAG laser is used to adiabatically align the molecules. The pulse duration is 10 ns. Part of the output from a 1 kHz amplified Ti:sapphire laser (800 nm) is compressed to 30 fs and used to either Coulomb explode the molecules subsection III.2, for detecting their spatial orientation or to singly ionize the molecules for creating photoelectrons (subsection III.3) or for characterizing the molecular beam profile (subsection III.1). The alignment beam (hereafter termed the YAG beam or the YAG pulse) and the fs beam (hereafter termed the probe beam or the probe pulse) are collinearly overlapped using a zero-degree mirror (high reflectivity at 1064 nm and high transmission at 800 nm) and focused onto the molecular beam by a 50 mm-diameter 30 cm-focal-length spherical lens. The probe pulse is electronically synchronized to the peak of the YAG pulse.
Using telescopes in each laser beam the spotsizes are adjusted so that the probe beam is more tightly focused than the YAG beam (m and m, measured by scanning a 10 m pinhole). The intensity of the probe pulse is adjusted by inserting thin neutral density filters in the beam, the intensity of the YAG pulse by rotating a half wave plate placed between two thin-film polarizers, upstream, and one thin film polarizer downstream. The polarization state of either beam is controlled by a half-wave and a quarter-wave plate inserted in each beam just before the final 0 degree overlap mirror.
III Experimental results
III.1 Deflection of benzonitrile
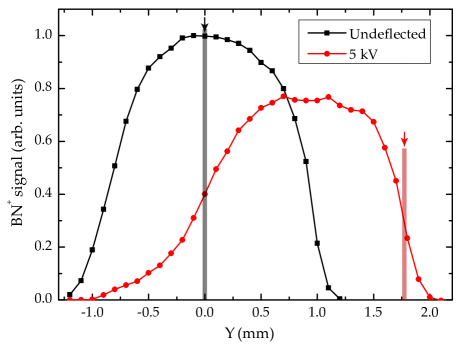
The effect of the deflector on the molecular beam is illustrated by the vertical intensity profiles in Fig. 2. These profiles are obtained by recording the BN+ signal [BN = benzonitrile (C7H5N)] from photoionization due to the femtosecond probe laser ( W/cm2) as a function of the vertical position of the laser focus. When the deflector is turned off, the molecular beam extends over mm, mainly determined by the diameter of the skimmer before the deflector and the end-aperture of the deflector. When the deflector is turned on, the molecular beam profile broadens and shifts upwards (positive Y values). Molecules in the lowest rotational quantum states have the largest Stark shifts and are, therefore, deflected the most Holmegaard et al. (2009); Filsinger et al. (2009). In the measurements described below, experiments were conducted on these quantum-state selected molecules simply by positioning the laser foci close to the upper cut-off region in the 5 kV profile (Y = 1.55 mm), as indicated by the red arrow in Fig. 2.
III.2 Alignment and orientation
The molecules studied here are asymmetric tops. Their alignment and orientation is controlled by the combination of the YAG pulse and the weak static electric field in the VMI spectrometer. Based on previous experiments and theory a linearly polarized YAG pulse is used to induce 1D alignment and orientation whereas 3D alignment and orientation is created by applying an elliptically polarized YAG pulse Larsen et al. (1999, 2000); Stapelfeldt and Seideman (2003); Tanji et al. (2005); Holmegaard et al. (2009); Nevo et al. (2009). Here 1D alignment refers to confinement of a single molecular axis along the YAG polarization axis. Due to the nature of the polarizability interaction between the molecule and the linearly polarized alignment field it is the most polarizable axis that is aligned Stapelfeldt and Seideman (2003). For benzonitrile, discussed here, this is the C2-axis (i. e., the C-N axis). Similarly, 3D alignment refers to confinement of three perpendicular molecular axes Stapelfeldt and Seideman (2003). In practice, the elliptically polarized alignment field confines the most polarizable axis along the major polarization axis, the second most polarizable axis (for BN the axis in the molecular plane perpendicular to the C2-axis) along the minor polarization axis and, consequently, the least polarizable axis (for BN the axis perpendicular to the molecular plane) perpendicular to the polarization plane. Finally, orientation refers to whether the dipole moment of the molecules point in a particular direction with respect to a laboratory-fixed reference direction, which here is the weak static electric field in the VMI spectrometer.
To test that alignment and orientation of BN occurs, the molecules are Coulomb exploded by the intense fs probe pulse ( W/cm2) and recoiling ionic fragments are recorded by the 2D ion detector, a method used previously for many other molecules in our laboratory. For a planar molecule of C symmetry, like BN, our standard procedure is to first establish that the C2-axis is aligned. This is accomplished by recording CN+ ions because they primarily recoil along the C2-axis.
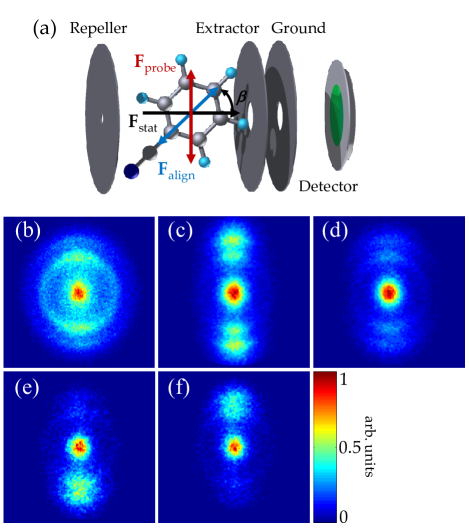
Fig. 3(b) shows a CN+ image recorded with the probe pulse only, linearly polarized in the detector plane. A mild confinement of the ions is observed reflecting the enhanced ionization probability for molecules that initially have their C2-axis pointing along the probe pulse polarization. The confinement is quantified by = 0.63, where is the angle between the projection of the CN+ recoil velocity on the detector plane and the YAG polarization Kumarappan et al. (2006). When the YAG pulse is included, linearly polarized vertically, corresponding to ( denoting the angle between the YAG polarization and the static electric field), the angular confinement sharpens markedly [Fig. 3(c)] and increases to 0.89. This shows that the BN molecules are 1D aligned with their C2-axis along the YAG polarization. The value is quite a bit smaller than that observed for 1D alignment of iodobenzene () Holmegaard et al. (2009) under similar conditions of initial rotational cooling, quantum-state selection and alignment pulse intensity. This may seem surprising since the components of the polarizability tensor for BN are similar to those of iodobenzene and thus the two molecules should exhibit approximately the same degree of 1D adiabatic alignment. The reason for the lower value for BN is most likely that CN+ ions are not ideal observables for deducing the spatial orientation of the C2-axis because, unlike I+ ions used in the iodobenzene characterization, it overlaps with other fragment ions in the time of flight spectrum of C7H5N. Hence, the ion images of Fig. 3 also contain contributions from hydrocarbon fragments from the benzene ring of equal (or nearly equal) mass-to-charge-ratio (e.g. C2H). These “contaminant” ions are not expected to recoil along the C-CN axis. In the alignment measurements we try to minimize the contribution from the contaminant ions by only analyzing the CN+ ions with the highest kinetic energy corresponding to the outermost ring foo seen in the images of Fig. 3. However, just a small contributions from the contaminant ions ejected in directions away from the YAG polarization is enough to significantly lower the observed value.
For reasons discussed in Sec. III.3 alignment was also measured for conditions of higher rotational temperature and no rotational state selection. In practice, this is achieved by lowering the He stagnation pressure from 85 to 15 bar Kumarappan et al. (2006) and, in addition, turning off the deflector voltages. The pronounced decrease in the degree of alignment is clear by comparing Fig. 3(d) (15 bar He, deflector turned off) with Fig. 3 (c) (90 bar He, selection of lowest rotational quantum states). Quantitatively, is 0.76 and 0.89 in Figs. 3 (d) and (c), respectively.
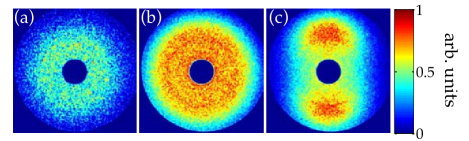
To achieve 3D alignment the polarization of the YAG pulse is changed from linear to elliptical. When an ellipticity of 3:1 is chosen, the value referring to the ratio of the intensities measured along the major and the minor polarization axis, the CN+ ion image (not shown) recorded with the major polarization axis in the plane of the detector (vertical) is very similar to the image in Fig. 3 (c), showing an equally strong degree of 1D alignment of the C2-axis. To additionally confirm confinement of the molecular plane H+ ions were recorded, see Fig. 4, following an approach employed in previous studies Viftrup et al. (2007); Nevo et al. (2009) of 3D alignment. When the probe laser only is used the image is circularly symmetric [Fig. 4 (a)]. Including the linearly polarized YAG pulse, polarized perpendicular to the detector plane, does not change the circular symmetry [Fig. 4 (b)]. This is consistent with the C2-axis being aligned along the YAG polarization vector and the molecular plane free to rotate around the arrested axis. When the 3:1 elliptically polarized YAG pulse, its major polarizability axis perpendicular to the detector, is used, the circular symmetry is broken and, instead, the H+ ions localize around the vertical axis corresponding to the minor axis of the polarization ellipse. Similar to previous studies Viftrup et al. (2007); Nevo et al. (2009) we interpret this as confinement of the molecular plane with the second most polarizable axis (perpendicular to the C2-axis but still in the molecular plane) aligned along the minor axis of the ellipse.
To show orientation of BN the polarization of the linearly polarized YAG pulse is rotated to meaning that the C2-axis of the molecules is positioned at 45 (-45) with respect to the static electric field, , of the VMI spectrometer [see Fig. 3(a)]. The resulting CN+ images are displayed in Figs. 3(e) and (f). The appearance of more CN+ ions on the lower (upper) part of the detector for 45 (-45) shows that the molecules are oriented with the CN-end preferentially pointing towards the repeller electrode. Hence, the permanent dipole moment of BN is pointing in the direction from the repeller to the extractor as expected. The up-down asymmetry remains unchanged when an elliptically rather than a linearly polarized YAG pulse is employed to align the molecules. These findings of alignment and orientation are fully consistent with recent studies on iodobenzene Holmegaard et al. (2009); Filsinger et al. (2009) and 2,6-difluoroiodobenzene Nevo et al. (2009).
The degree of orientation is characterized by the ratio of ions detected on the upper part to the total number of ions detected. For it is 27 % and for it is 71 %. For several reasons these numbers underestimate the degree of orientation utilized in the photoelectron experiments described below. The presence of contaminant ions with the same mass-to-charge ratio as CN+ will reduce the up-down asymmetry. In addition, the ion images are recorded at F=286 V/cm which is significantly lower than the electrostatic extraction field in the photoelectron angular distribution (PAD) measurements presented in subsection III.3 (F V/cm). In fact, the increase of the static field will be even larger because the ion measurements are recorded at , i. e., the effective value of F is reduced by . By contrast for the PAD measurements the alignment field is polarized parallel to F. As a consequence, we estimate that the orientation in the PAD geometry corresponds to at least 80 % of the molecules have their CN-end facing the extractor electrode.
III.3 PADs from single ionization of benzonitrile
For the PAD experiments the same experimental setup as for the ion detection described in subsection III.2 is used, but some essential parameters are changed. The polarization state of the 30 fs probe pulses is changed from linear to circular and the intensity is lowered to W/cm2 corresponding to a regime where the BN molecules only undergo single ionization with essentially no fragmentation. Also, the polarization of the alignment pulse is changed such that the major axis is parallel to the static field axis. Furthermore, to extract electrons instead of ions in the PAD measurements the polarity of the velocity map imaging spectrometer is inverted. Hereby, the BN molecules are confined along the static field axis with the CN-end facing the extractor electrode.
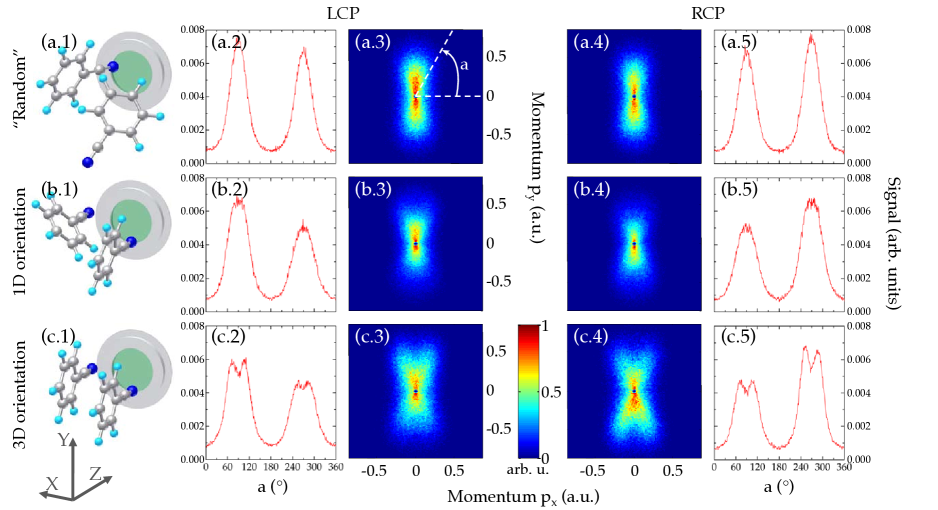
The photoelectron images are shown in Fig. 5. Applying only the probe pulse [Figs. 5(a.3) and (a.4)] the electrons emerge in a stripe parallel to the polarization plane (Y,Z) of the probe pulse for both left and right circularly polarized (LCP and RCP) pulses. A weak up-down asymmetry is observed, that reverses as the helicity of the probe pulse is flipped. The asymmetry is more easily seen in the angular distributions [Figs. 5(a.2) and (a.5)], obtained by radially integrating the respective images from momentum 0.02 to 0.8 a.u. When the YAG pulse, linearly polarized along F, is included to induce strong 1D alignment and orientation, schematically illustrated in Fig. 5(b.1), the up-down asymmetry increases [Figs. 5(b.3) and (b.4)]. For LCP (RCP) probe pulses the number of electrons detected in the upper part compared to the total number in the image is 55% (44%). The enhanced asymmetry is also clearly visible in the angular distributions [Figs. 5(b.2) and (b.3)]. As explained in Sec. IV the up-down asymmetry results from the orientational dependence of the ionization yield and the force on the electrons, by the probe laser field, following their detachment from the molecule. In particular, we show that ionization of molecules, 1D aligned and oriented with their dipole moment along the direction of F, leads to electrons with an upward (downward) momentum for LCP (RCP) probe pulses in agreement with the observations. The observation of an asymmetry without the YAG pulse results from mild orientation due to the interaction between the permanent dipole moment and the weak static field and/or state selection by the deflector Nevo et al. (2009).
When the BN molecules are 3D aligned and oriented, obtained by using an elliptically rather than a linearly polarized YAG pulse (see Sec. III.2), striking substructures appear in the PADs [Figs. 5(c.3) and (c.4)]. Notably, the electron emission is suppressed along the vertical direction, clearly seen as a dip in the corresponding angular distributions [Figs. 5(c.2) and (c.5)] at and , where is the angle measured counterclockwise with respect to the X direction [see Fig. 5(a.3)]. The angular distributions also show that the maximum in the electron emission occurs at an angle
| (1) |
away from vertical. As explained in Sec. IV the local minimum of electrons along the vertical direction results from suppression of electron emission in the nodal plane of the highest-occupied molecular orbital (HOMO) [and the first orbital below HOMO in energy, HOMO-1] which, for the 3D aligned and oriented molecules, corresponds to the (Y,Z) plane. Regarding the up-down asymmetry of the electron distributions [panels (c.2) and (c.5)] it is essentially the same as for the electron distributions obtained for the 1D aligned and oriented molecules [Figs. (b.2) and (b.5)]. This is in accordance with expectations since the degree of 1D alignment and orientation should be essentially the same for the linearly and the elliptically polarized YAG pulse (verified experimentally).
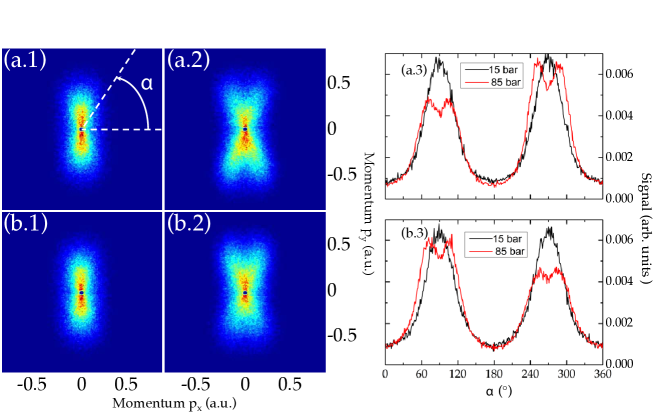
To test that the observed structures in the PADs are not due to perturbation from the YAG pulse on the ionization process by the fs probe pulse, experiments were carried out on molecules with a much lower degree of alignment but identical YAG pulse intensity. This is achieved by employing molecules with higher rotational temperature, achieved as explained in Sec. III.2. Figure 6 shows the photoelectron images obtained for LCP and RCP when the molecules are 3D aligned and oriented. Images similar to those in Fig. 5 are kept as a reference [Figs. 6(a.2) and (b.2)]. Both the up-down asymmetry and the lobe-like structures are completely absent in Figs. 6(a.1) and (b.1), thereby showing the importance of a tightly aligned and oriented target for observation of the effects in the PADs. The difference between the experiments on strongly versus weakly aligned and oriented molecules is also obvious from the angular distribution displayed in Figs. 6(a.3) and (b.3).
IV Theory
IV.1 Stark-shift corrected tunneling theory
To describe the response of molecules with large polarizabilities and dipole moments to strong, near infrared laser pulses requires the Stark shifts of the energy levels be included, see Ref. Dimitrovski et al., 2010 and the Supplementary Information in Ref. Holmegaard et al., 2010. In Ref. Dimitrovski et al., 2010, we modified the tunneling model to include the Stark shifts of the molecule and its cation at the instantaneous value of the external field. We briefly summarize the model here for completeness.
When the Stark shifts are taken into account, the field-free ionization potential is modified and reads (up to second order in the field strength )
| (2) |
where
| (3) |
is the permanent dipole moment, is the polarizability tensor, and the superscripts and are referring to the molecule and the unrelaxed cation, respectively. We use the unrelaxed cation, since the nuclei have no time to move to the new equlibrium position during the tunneling process. At the field strengths of concern the shifts induced by the hyperpolarizability and higher-order terms are negligible compared to the linear and quadratic terms accounted for in Eq. (2). We note that the dipole moment and polarizability differences in Eq. (3) are exactly the dipole and polarizability of the orbital actively involved in the tunneling process, e.g., the HOMO and HOMO-1 in the present case. Hence the discussion could equivalently be performed referring to the orbital dipole moment and polarizability. Such an approach is natural in the case of calculations with the time-dependent Schrödinger equation within the single-active electron approximation Abu-samha and Madsen (2010).
In the tunneling regime, i. e., when the Keldysh parameter Keldysh (1965) is smaller than unity, the static Stark shift should be accounted for and the standard tunneling model of Ref. Ammosov et al. (1986) modified accordingly by using the shifted ionization potential of Eq. (2). These changes are crucial in order to reproduce the experimental asymmetry in the photoelectron momentum distribution Holmegaard et al. (2010). First, for simplicity we restrict for simplicity our consideration to the case were the target molecule can be modeled by an s-orbital. We include a factor to account for the saturation of ionization at high intensities Tong and Lin (2005), and the Stark-corrected tunnel ionization rate (up to a multiplicative constant) becomes
| (4) |
where
| (5) |
We note from Eqs. (2) and (5) that is a function of the strength and the orientation of the field with respect to the molecular frame.
The Keldysh parameter for the current experiment involving benzonitrile amounts to 1.17. It has been shown that for increasing molecular size the ionization becomes tunnel-like at larger Keldysh parameters deWitt and Levis (1998) ; therefore we use the tunneling model here. In benzonitrile the tunnel exit is far from the centre of mass, so in circularly polarized laser fields, where no rescattering occurs, the influence of the molecular potential on the escaping electron can be neglected. Accordingly, after the initial ionization step, the subsequent propagation of the electron can be estimated accurately by solving the classical equations of motion in the laser field only Corkum (1993). We consider a left circularly polarized (LCP) probe pulse, containing more than 10 cycles, which is switched off adiabatically at large times. These assumptions allow us to consider a field with constant amplitude
| (6) |
Here is the peak field strength and the angular frequency. The final photoelectron momentum at the 2D detector screen can now be straightforwardly related to the vector potential at the instant of ionization , that is
| (7) |
where is the angle between the Z-axis and the field vector at the instant of ionization. Using Eqs. (4) and (7), for each field orientation, i.e., , the final momenta in the (Y,Z) plane and the associated tunneling probability can be calculated.
IV.2 Modeling the off–the-nodal plane photoelectron emission by tunneling theory
The structure of the molecular orbitals of benzonitrile with the lowest binding energies, combined with the particular 3D orientation in the present experimental setup, result in the unique X-shaped pattern in the electron momentum distribution shown in Fig. 5, and the off-the-nodal plane emission angle reported in Eq. (1). To explain such a pattern requires a more advanced treatment than the one presented in Ref. Holmegaard et al., 2010. The HOMO and HOMO-1 of benzonitrile are shown in Fig. 7. The most important feature for the present development is that the relevant experimental orientation of the molecule is such that the nodal planes of both the HOMO and HOMO-1 coincide with the molecular plane which in turn coincides with the polarization plane of the laser pulse. In other words, neither HOMO nor HOMO-1 have electron density in the polarization plane of the pulse (6). This geometry poses a theoretical challenge in tunneling models, since conventional tunneling and molecular tunneling theory is inapplicable. The simple reason for their failure is that the standard assumption, that tunneling of the negatively charged electron happens in a very narrow cone around the direction opposite to the field Perelomov et al. (1966); Ammosov et al. (1986); Tong et al. (2002); Bisgaard and Madsen (2004), is no longer valid. In that direction there is no bound state wave function to overlap with the continuum emerging from the outer turning point, and no ionization will occur due to the nodal plane. In short, in the nodal plane there is no population which can tunnel, and consequently emission occur off-the-nodal plane. The simplest cases where this is evident is tunnel emission from a hydrogenic 2py or 2px orbital when the field is aligned along the Z-axis. These states are linear combinations of the states and . According to tunneling theory, the contributions from states with and should be added incoherently. Then, following Ref. Delone and Krainov (1991), the transverse momentum distribution is proportional to
| (8) |
and therefore from such a state one would observe a peak at in the momentum distributions recorded on the detector screen in this experiment. However, as is evident from the present experiment, the emission occurs off-the-nodal plane. Inclusion of off-the-nodal plane emission in the tunneling model is nontrivial, since the dominant photoelectron momenta under tunneling emission (momentum distribution of tunneled electron at its birth) should now depend on the particular initial state. For example, 2py or 2px orbitals would have different transverse momentum distributions. Concerning the derivation of the tunneling rate, we can, in this situation, no longer separate the azimuthal angle around and thus cannot add the individual components incoherently. We note here that even when static Stark shifts are included, the information about the nodal plane of the initial state survives and cannot be washed out by the polarization effects.
Motivated by earlier work on tunneling theory for large systems Brabec et al. (2005), and by the fact that the saddle-point formulation of the length-gauge strong-field approximation (SFA) Keldysh (1965) in the limit of small Keldysh parameter agrees very well with the tunneling theory Gribakin and Kuchiev (1997) (at least for a zero-range potential), we modify the transverse momentum distribution of Eq. (8) by multiplying it by the squared Fourier transform of the initial wavefunction. More precisely, for the 2px orbital that means multiplication of the transverse momentum distribution (8) by the factor , i. e.,
| (9) |
where and are the 2-dimensional polar coordinates in the (X,Y) plane. In Eq. (9) is the dominating factor relating to the angular behavior of the squared Fourier transform of 2px at , and a factor has been neglected. Finally, in the above equation for the transverse momentum distribution, we have used the field-free ionization potential (appearing as a square root in the exponential) since, as we have checked, adding Stark shifts to this part of the distribution does not change the results much.
Using the distribution (9) the expectation value of the X-component of the transversal momentum (we assume the field is oriented along the Z-axis), in the interval can be calculated analytically as
| (10) |
where . We note that the expectation value of for the tunneled electron at birth is and that the probability of emission with is zero, i. e., there is no emission in the nodal plane of the initial state although the field is along the Z-axis. The final momenta of the tunneled electron along the Y- and Z-axis are defined by Eq. (7) and it follows that the maximal final electron momentum along the Y-direction is . We can define an angle as a measure for the off-the-nodal plane emission. With the above expressions, this angle can be calculated analytically and the results reads
| (11) |
where is the Keldysh parameter Keldysh (1965). The above expression is, to our knowledge, the first quantification of the angle of off-the-nodal plane emission as a function of the field intensity and frequency and the binding energy of the atomic/molecular system. It has the intuitively correct behavior with respect to increase of the field intensity and the binding energy: the angle decreases. Since both peak field and appear as square roots in the expression, in the limit of large intensities, where also the tunnel model is more valid, the angle is inversely proportional to the fourth root of intensity, i. e., its dependence on intensity is very weak.
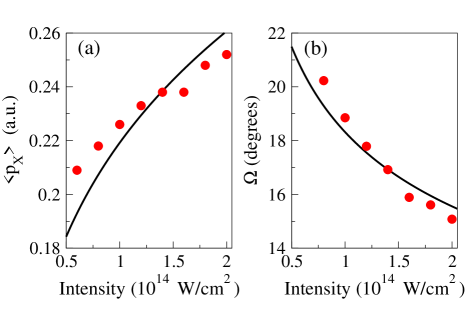
To test our model, we imagine a fictitious experiment where we have an ’oriented’ atom in a px orbital and the field-free ionization potential a.u.. We assume that, identically to the experiment involving benzonitrile, ionization is induced by a LCP field in the (Y,Z) plane and that the momentum distribution is recorded on a detector coinciding with the (X,Y) plane. The final momentum distribution recorded on the screen can be calculated for this case using the above off-the-nodal-plane tunnel emission model. We have compared the results from our model to the calculations within the strong-field approximation Keldysh (1965) assuming a 10 cycle circularly polarized laser pulse with a sine-square envelope, defined in terms of the vector potential interacting with the same 2px state. The comparison between the predictions of and by the two methods is given in Fig. 8. It can be seen that for large intensities, the tunneling model and the SFA calculations largely agree for both quantities. As the intensity of the field decreases, or equivalently, the Keldysh parameter increases, the discrepancy between the SFA and the tunneling model results increases, reflecting the gradual departure from the tunneling regime.
V Strong-field ionization of 3D-oriented benzonitrile
Armed with our generalized tunneling model including both the static Stark shifts and the off-the-nodal-plane emission, we now address the experimental results for benzonitrile.
As illustrated in Fig. 5, two sets of experiments have been performed involving pre-oriented benzonitrile molecules: one with 1D-oriented molecules and the other with 3D-oriented molecules. The results obtained with 1D and 3D orientation show almost the same degree of up-down asymmetry (Fig. 5). The asymmetry can be ascribed to the dependence of the ionization potential on the static Stark shifts of the energy levels (see Sec.IV.1), i.e., the small difference between the dipole moment of benzonitrile and its cation (Appendix A). The case of 1D-oriented benzonitrile can be treated theoretically by the same method as introduced in Ref. Holmegaard et al., 2010 for the description of the linear OCS molecule. In the 1D oriented case, the molecules are allowed to rotate freely around its molecular axis and the effect of off-the-nodal-plane emission is washed out. In the experiment on 3D aligned and oriented benzonitrile, on the other hand, the polarization plane of the circularly polarized laser lies entirely in the nodal plane of both HOMO and HOMO-1. Indeed, in this case, off-the-nodal-plane emission occurs and manifests itself as an X-like pattern in the photoelectron momentum distribution on the detector screen, and
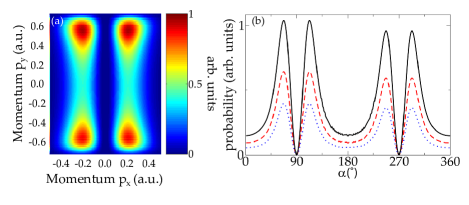
here we focus on the 3D-oriented benzonitrile. To describe the experiment, we use the theory for off-the-nodal plane emission, developed in the previous section. The polarizability of benzonitrile is very large (see Apendix A), so we expect that the initial orbital would be modified by the polarization response of the system, and we assume that any structure of the orbital off the nodal plane will be washed out. Thus, when the Stark shift is not included, the total probability of tunnel emission will not depend on the (finite) angle of the electric field vector with respect to the Z-axis. Therefore, we model all orbitals of benzonitrile that have their nodal plane coinciding with the polarization plane with the simplest possible orbital having such a nodal plane: the px orbital. All theoretical results presented here assume perfect 3D orientation of the molecule. Using Eqs. (4), (7) and (9), the momentum distributions at a particular intensity can be calculated. We perform focal volume integration by including intensities ranging from W/cm2 to W/cm2 with a step of . The resulting momentum distributions from HOMO, HOMO-1 and the combined response of HOMO and HOMO-1 are shown in Fig. 9.
As seen by comparison of Fig. 5 and Fig. 9, at larger radial final momenta , there is good agreement between the experimental and theoretical differential momentum distributions. Also, the agreement between theory and experiment for the angle off-the-nodal-plane emission is good: the experiment yields degrees (Fig. 5, [Eq. (1)]) and the theory degrees [Eq. (11)]. In agreement with the calculation the suppression of electron emission occurs at = 90 and 270 degrees. The degree of suppression seen experimentally is, however, much less pronounced that the complete suppression, i.e. no electron emission with , predicted theoretically. One factor contributing to this disagreement is the lack of perfect alignment of the molecular plane in the experiment. Another source that can produce a signal at is emission from the HOMO-2 that is bound with additional 0.1 a.u. compared to the HOMO. The HOMO-2 has population in the polarization plane of the field so that its contribution can still be significant (see Fig. 4 in the Supplementary Information of Ref. Holmegaard et al. (2010)).
The present theory is capable of describing the small up/total asymmetry observed in the experiment by attributing it to the Stark shift of the ionization potential due to the dipole and polarizability of the HOMO orbital, i.e., the difference of the permanent dipole moment of the molecule with respect to the permanent dipole moment of the unrelaxed cation. The calculated up/total asymmetry for the case of 3D-oriented molecule at W/ is 0.52 in fair agreement with the experimental results.
VI Conclusions
We have studied molecular frame photoelectron distributions (MFPADs) following strong field single ionization, with circularly polarized, nonresonant fs pulses, of benzonitrile molecules aligned and oriented in space by mixed laser and static electric fields. The most striking experimental observation is suppression of electron emission in directions that correspond to nodal planes of the orbitals from which ionization occurs. The experimental findings are explained using a modified tunneling theory. Our theoretical analysis shows that the circularly polarized ionizing field drives the photoelectrons away from the cation, minimizing effects of post-ionization interaction, and leads to a clear signature of the orbital structure of the molecule at the time of ionization. In particular, we have shown here that nodal structures can be mapped out, a possibility recently examined further theoretically Martiny et al. (2010).
An important future challenge is to extend the present work to the study of time-dependent phenomena. This may be realized, for instance, by a pump-probe scheme where the probe pulse promotes molecules from the electronic ground state to an electronically excited state. One class of such photoinduced reactions that could be well suited for the strong field probing, introduced here, concerns large amplitude vibrational motion in the excited state. This occurs for, instance, in axially chiral systems such as biphenyl or phenyl-pyrrole Okuyama et al. (1998) where the dynamics in the excited states corresponds to torsional motion of two aromatic rings. Alignment as well as orientation of such systems is feasible Madsen et al. (2009a, b) and the present probe method could map out the changing valence electronic structure during torsional motion occurs. More generally, strong field ionization in combination with MFPADs may provide an informative probe of charge migration and charge transfer on time scales down to a few femtoseconds Kuleff and Cederbaum (2007).
VII Acknowledgement
The work was supported by the Danish National Research Foundation, the Lundbeck Foundation, the Carlsberg Foundation, the Danish Council for Independent Research (Natural Sciences) and the European Marie Curie Initial Training Network Grant No. CA-ITN-214962-FASTQUAST.
APPENDIX A
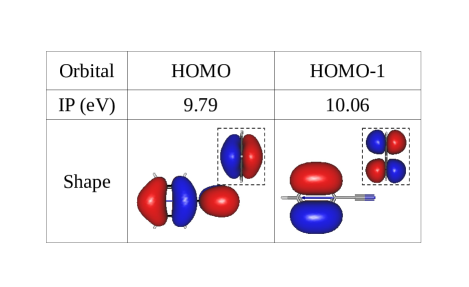
The molecular structure, population analysis, and orbital energies of benzonitrile were obtained from Hartree-Fock calculations M. W. Schmidt et al. (1993) (the molecule is oriented in the () plane and the CN-end pointing in the positive Z axis, see Fig. 5). The HOMO and HOMO-1 of benzonitrile are shown in Fig. 7. The orbital energies, given in Fig. 7, agree well with the experimental ionization potentials, reported in Ref. Kobayashi and Nakagura (1974), and are very close in energy [: 9.79 eV ( a.u) for HOMO; 10.06 eV ( a.u) for HOMO-1]. Population analysis shows that while the HOMO-1 is localized on the aromatic ring, about 30% of the HOMO electron density is on the CN-end, see Fig. 7. The experimental 3D orientation of the molecule is such that the nodal planes of both HOMO and HOMO-1 orbitals, coincide with the molecular plane, i.e., they have no electron density in the molecular plane.
For the purpose of our Stark-shift tunneling model we require the permanent dipole moment and the polarizabilities of benzonitrile and its cation. The nonzero elements of the polarizability tensor of benzonitrile are (in a.u.): , , , , , and , and the permanent dipole moment of benzonitrile is a.u. (in fair agreement with the experimental value Wohlfart et al. (2008b)) and a.u. for the cation, both pointing along from the detector to the repeller.
References
- Reid (2003) K. Reid, Annu. Rev. Phys. Chem. 54, 397 (2003).
- A. Stolow et al. (2004) A. Stolow, A. E. Bragg, and D. M. Neumark, Chem. Rev. 104, 1719 (2004).
- Stolow and Underwood (2008) A. Stolow and J. G. Underwood, Adv. Chem. Phys. 139, 497 (2008).
- Hockett et al. (2009) P. Hockett, M. Staniforth, K. L. Reid, and D. Townsend, Phys. Rev. Lett. 102, 253002 (2009).
- Suzuki (2006) T. Suzuki, Annu. Rev. Phys. Chem. 57, 555 (2006).
- Shigemasa et al. (1995) E. Shigemasa, J. Adachi, M. Oura, and A. Yagishita, Phys. Rev. Lett. 74, 359 (1995).
- D. Akoury et al. (2007) D. Akoury et al. , Science 318, 949 (2007).
- M. S. Schöffler et al. (2008) M. S. Schöffler et al., Science 329, 920 (2008).
- Yamazaki et al. (2009) M. Yamazaki, J. Adachi, T. Teramoto, A. Yagishita, M. Stener, and P. Decleva, J. Phys. B: At. Mol. Opt. Phys. 42, 052001 (2009).
- Davies et al. (2000) J. Davies, R. Continetti, D. Chandler, and C. Hayden, Phys. Rev. Lett. 84, 5983 (2000).
- Rijs et al. (2004) A. Rijs, M. Janssen, E. Chrysostom, and C. Hayden, Phys. Rev. Lett. 92, 123002 (2004).
- Gessner et al. (2006) O. Gessner, A. M. D. Lee, J. P. Shaffer, H. Reisler, S. V. Levchenko, A. I. Krylov, J. G. Underwood, H. Shi, A. L. L. East, D. M. Wardlaw, et al., Science 311, 219 (2006).
- Tang et al. (2010) Y. Tang, Y.-I. Suzuki, T. Horio, and T. Suzuki, Phys. Rev. Lett. 104, 073002 (2010).
- Stapelfeldt and Seideman (2003) H. Stapelfeldt and T. Seideman, Rev. Mod. Phys. 75, 543 (2003).
- Meckel et al. (2008) M. Meckel, D. Comtois, D. Zeidler, A. Staudte, D. Pavicic, H. C. Bandulet, H. Pepin, J. C. Kieffer, R. Dörner, D. M. Villeneuve, et al., Science 320, 1478 (2008).
- Kumarappan et al. (2008) V. Kumarappan, L. Holmegaard, C. Martiny, C. B. Madsen, T. K. Kjeldsen, S. S. Viftrup, L. B. Madsen, and H. Stapelfeldt, Phys. Rev. Lett. 100, 093006 (2008).
- Bisgaard et al. (2009) C. Z. Bisgaard, O. J. Clarkin, G. Wu, A. M. D. Lee, O. Gessner, C. C. Hayden, and A. Stolow, Science 323, 1464 (2009).
- Friedrich and Herschbach (1999) B. Friedrich and D. Herschbach, J. Chem. Phys. 111, 6157 (1999).
- Sakai et al. (2003) H. Sakai, S. Minemoto, H. Nanjo, H. Tanji, and T. Suzuki, Phys. Rev. Lett. 90, 083001 (2003).
- Ghafur et al. (2009) O. Ghafur, A. Rouzee, A. Gijsbertsen, W. K. Siu, S. Stolte, and M. J. J. Vrakking, Nat. Phys 5, 289 (2009).
- Holmegaard et al. (2009) L. Holmegaard, J. H. Nielsen, I. Nevo, H. Stapelfeldt, F. Filsinger, J. Küpper, and G. Meijer, Phys. Rev. Lett. 102, 023001 (2009).
- Holmegaard et al. (2010) L. Holmegaard, J. L. Hansen, L. Kalhøj, S. L. Kragh, H. Stapelfeldt, F. Filsinger, J. Küpper, G. Meijer, D. Dimitrovski, M. Abu-samha, et al., Nature Physics 6, 428 (2010).
- Dimitrovski et al. (2010) D. Dimitrovski, M. Abu-samha, L. B. Madsen, F. Filsinger, G. Meijer, J. Küpper, L. Holmegaard, L. Kalhøj, J. H. Nielsen, and H. Stapelfeldt, submitted to Phys. Rev. A (2010).
- Kjeldsen et al. (2003) T. K. Kjeldsen, C. Z. Bisgaard, L. B. Madsen, and H. Stapelfeldt, Phys. Rev. A 68, 063407 (2003).
- Kjeldsen et al. (2005) T. K. Kjeldsen, C. Z. Bisgaard, L. B. Madsen, and H. Stapelfeldt, 71, 013418 (2005).
- U. Even et al. (2000) U. Even, J. Jortner, D. Noy, N. Lavie, and C. Cossart-Magos, J. Chem. Phys. 112, 8068 (2000).
- M. Hillenkamp et al. (2003) M. Hillenkamp, S. Keinan, and U. Even, J. Chem. Phys. 118, 8699 (2003).
- Kumarappan et al. (2006) V. Kumarappan, C. Z. Bisgaard, S. S. Viftrup, L. Holmegaard, and H. Stapelfeldt, J. Chem. Phys. 125, 194309 (2006).
- Filsinger et al. (2009) F. Filsinger, J. Küpper, G. Meijer, L. Holmegaard, J. H. Nielsen, I. Nevo, J. L. Hansen, and H. Stapelfeldt, J. Chem. Phys. 131, 064309 (2009).
- Ramsey (1956) N. F. Ramsey, Molecular Beams (Oxford University Press, 1956).
- Wohlfart et al. (2008a) K. Wohlfart, F. Filsinger, F. Grätz, J. Küpper, and G. Meijer, Phys. Rev. A 78, 033421 (2008a).
- Kirste et al. (2009) M. Kirste, B. G. Sartakov, M. Schnell, and G. Meijer, Phys. Rev. A 79, 051401 (2009).
- Wall et al. (2010) T. E. Wall, S. K. Tokunaga, E. A. Hinds, and M. R. Tarbutt, Phys. Rev. A 81, 033414 (2010).
- A. T. J. B. Eppink and D. H. Parker (1997) A. T. J. B. Eppink and D. H. Parker, Rev. Sci. Instrum. 68, 3477 (1997).
- Larsen et al. (1999) J. J. Larsen, H. Sakai, C. P. Safvan, I. Wendt-Larsen, and H. Stapelfeldt, J. Chem. Phys. 111, 7774 (1999).
- Larsen et al. (2000) J. J. Larsen, K. Hald, N. Bjerre, H. Stapelfeldt, and T. Seideman, Phys. Rev. Lett. 85, 2470 (2000).
- Tanji et al. (2005) H. Tanji, S. Minemoto, and H. Sakai, Phys. Rev. A 72, 063401 (2005).
- Nevo et al. (2009) I. Nevo, L. Holmegaard, J. H. Nielsen, J. L. Hansen, H. Stapelfeldt, F. Filsinger, G. Meijer, and J. Küpper, Phys. Chem. Chem. Phys. 11, 9912 (2009).
- (39) The highest kinetic CN+ ions appear as two sets of angularly confined rings. In accordance with similar observations for Coulomb explosion of iodobenzene Larsen et al. (1999) and difluoroiodobenzene Viftrup et al. (2007) we interpret the innermost ring as resulting from CN+ ions when BN is doubly ionized by the probe pulse and fragments into an CN+ + C6H5+ ion pair, whereas the outermost ring results from CN+ ions formed from triple ionization and fragmentation into an CN+ + C6H52+ ion pair. The value of is determined in the radial range corresponding to the outermost ring.
- Viftrup et al. (2007) S. Viftrup, V. Kumarappan, S. Trippel, H. Stapelfeldt, E. Hamilton, and T. Seideman, Phys. Rev. Lett. 99, 143602 (2007).
- Abu-samha and Madsen (2010) M. Abu-samha and L. B. Madsen, Submitted to Phys. Rev. A (2010).
- Keldysh (1965) L. V. Keldysh, Sov. Phys. JETP 20, 1307 (1965).
- Ammosov et al. (1986) M. V. Ammosov, N. B. Delone, and V. P. Krainov, Sov. Phys. JETP 64, 1191 (1986).
- Tong and Lin (2005) X. M. Tong and C. D. Lin, J. Phys. B: At. Mol. Opt. Phys. 38, 2593 (2005).
- deWitt and Levis (1998) M. J. deWitt, R. J. Levis, Phys. Rev. Lett. 81, 5101 (1998).
- Corkum (1993) P. B. Corkum, Phys. Rev. Lett. 71, 1994 (1993).
- M. W. Schmidt et al. (1993) M. W. Schmidt, K. K. Baldridge, J. A. Boatz, S. T. Elbert, M. S. Gordon, J. H. Jensen, S. Koseki, N. Matsunaga, K. A. Nguyen, S. Su, et al., J. Comput. Chem. 14, 1347 (1993).
- Perelomov et al. (1966) A. M. Perelomov, V. S. Popov, and M. V. Terentev, Sov. Phys. JETP 23, 924 (1966).
- Tong et al. (2002) X. M. Tong, Z. X. Zhao, and C. D. Lin, Phys. Rev. A 66, 033402 (2002).
- Bisgaard and Madsen (2004) C. Z. Bisgaard and L. B. Madsen, Am. J. Phys. 72, 249 (2004).
- Delone and Krainov (1991) N. B. Delone and V. P. Krainov, J. Opt. Soc. Am. B 8, 1207 (1991).
- Brabec et al. (2005) T. Brabec, M. Côté, P. Boulanger, and L. Ramunno, Phys. Rev. Lett. 95, 073001 (2005).
- Gribakin and Kuchiev (1997) G. F. Gribakin and M. Y. Kuchiev, Phys. Rev. A 55, 3760 (1997).
- Martiny et al. (2010) C. P. J. Martiny, M. Abu-samha, and L. B. Madsen, Phys. Rev. A 81, 063418 (2010).
- Okuyama et al. (1998) K. Okuyama, Y. Numata, S. Odawara, and I. Suzuka, J. Chem. Phys. 109, 7185 (1998).
- Madsen et al. (2009a) C. B. Madsen, L. B. Madsen, S. S. Viftrup, M. P. Johansson, T. B. Poulsen, L. Holmegaard, V. Kumarappan, K. A. Jørgensen, and H. Stapelfeldt, Phys. Rev. Lett. 102, 073007 (2009a).
- Madsen et al. (2009b) C. B. Madsen, L. B. Madsen, S. S. Viftrup, M. P. Johansson, T. B. Poulsen, L. Holmegaard, V. Kumarappan, K. A. Jørgensen, and H. Stapelfeldt, J. Chem. Phys. 130, 234310 (2009b).
- Kuleff and Cederbaum (2007) A. I. Kuleff and L. S. Cederbaum, Chem. Phys. 338, 320 (2007).
- Kobayashi and Nakagura (1974) T. Kobayashi and S. Nakagura, Bullet. Chem. Soc. Jap. 47, 2563 (1974).
- Wohlfart et al. (2008b) K. Wohlfart, M. Schnell, J. Grabow, and J. Küpper, J. Mol. Spec. 247, 119 (2008b).