Melting of Lennard-Jones rare gas clusters doped with a single impurity atom
Abstract
Single impurity effect on the melting process of magic number Lennard-Jones, rare gas, clusters of up to 309 atoms is studied on the basis of Parallel Tempering Monte Carlo simulations in the canonical ensemble. A decrease on the melting temperature range is prevalent, although such effect is dependent on the size of the impurity atom relative to the cluster size. Additionally, the difference between the atomic sizes of the impurity and the main component of the cluster should be considered. We demonstrate that solid-solid transitions due to migrations of the impurity become apparent and are clearly differentiated from the melting up to cluster sizes of 147 atoms.
pacs:
36.40.Ei, 61.46.+wI Introduction
Alloying effects in atomic nanoclusters cover a domain of property behavior
wider and more complex than those corresponding to individual atoms and bulk
matter, with strong particle size specificities which combine with composition
and finite-size effects.
Even for pure substances the structure of their atomic nanoclusters is very
dependent upon the number of atoms per particle. There are “magic” numbers,
corresponding to cluster structures characterized by their conspicuous
energetic stabilities relative to size, but for a given finite cluster
structure, stability results from a trade-off between packing and surface
effects. General non-monotonic property trends as a function of size
characterize finite clusters, so complex structural transitions may occur
during the growth from finite sizes to the bulk. The addition of dopant atoms
to a pure atomic cluster can alter its structure and growth patterns depending
upon the nature of both the impurity and the cluster, the cluster size, and
the concentration of dopant atoms. The possibility to manipulate nanoparticle
structures and so, tune their physico-chemical properties (e.g.
catalytic, electronic, thermodynamic) has motivated a lot of recent research
on alloy nanoclusters Ferrando et al. (2008); Baletto and Ferrando (2005).
Regarding the phase changes, the melting process of pure and alloy clusters
has attracted considerable attention in experimental as well as in theoretical
studies. A number of specific features have been recognized in the melting
mechanisms of finite particles such as solid-solid structure changes prior to
meltingDoye et al. (1998), premeltingBaletto and Ferrando (2005) effects of
surface loosening (formation of “liquid-like” surface layers
Calvo and Spiegelmann (2000); Chen and Johnston (2007)), coexistence of different atom-packing
schemesNoya and Doye (2006), oscillations between the liquid and solid phases
Duan et al. (2007), etc.
The melting temperature as a function of the cluster size has been studied on
the basis of several models which agree on predicting that the melting
temperature decreases linearly or quasi-linearly with the inverse of the
radius of the particleBaletto and Ferrando (2005); Wautelet (1991); Vallée et al. (2001). The pioneering work by Pawlow is summarized in the
formula:
in which and represent the melting temperatures of a
-sized spherical cluster and the bulk, respectively; and is a constant
(see Ref [Baletto and Ferrando, 2005] for a derivation of this law and further
correction terms). Pawlow’s law is consistent with several experimental
results and, although deviations occur for the smaller clusters, whose shapes
are far from spherical, the melting point of nanoclusters is usually
depressed. Nevertheless, there is experimental evidence of exceptions to this
trend for cases like the ionic tin clusters with 10-30 atoms, whose melting
points are at least 50K above that of the bulkShvartsburg and Jarrold (2000). In
addition to the size effects, the melting temperatures of alloy clusters can
be increasedMottet et al. (2005) or decreasedHock et al. (2008) with respect to
those of the pure components Ferrando et al. (2008). The amount and
direction of the shiftings of the melting point in finite doped atomic
clusters can be attributed to several factors: alterations of the cluster
structure, whether or not the impurity is soluble in the cluster, many-body
energetic effects, and/or other complex energetic-entropic effectsHock et al. (2008).
The phenomenology seen in the melting mechanisms of pure clusters is also
apparent for binary and multiple-component clusters, but having the
composition as an additional variable enormously increases the complexity of
structural behaviorsDoye and Meyer (2005); Calvo and Yurtsever (2004). Alloying effects in mixed atomic clusters depend upon
the differences between the atomic sizes, cluster surface energies, overall
structure strain, number and strength of the interactions between unlike
atoms. Calvo and Yurtsever (2004). Further contributing aspects may be
kinetic factors, specific electronic/magnetic effects, and environmental
conditions Ferrando et al. (2008). Alloying effects can be significant even
when a single impurity is introduced into a cluster of the order of a hundred
atoms.Mottet et al. (2005).
An efficient scheme to model the melting of doped atomic clusters has to
address the issues associated with the increased complexity of the energy
landscapes to explore during the simulations of mixed clusters, the
occurrence of homotop structures, as well as convergence difficulties related
to quasi-ergodicity that have been described elsewhere Topper et al. (2003); Frantsuzov and Mandelshtam (2005). Methods such as replica exchange Molecular Dynamics and
Parallel Tempering Monte Carlo (PTMC) have been developed to address the
quasi-ergodicity by improved sampling. PTMC is a powerful method to sample
rugged energy surfaces which takes advantage of the fact that replicas
running at high temperature are able to sample most of the relevant
configuration space. At the same time, through configuration exchange PTMC
connects high temperature replicas, which can visit most of the configuration
space, with replicas at low temperatures so that the latter do not get trapped in local
minima Earl and Deem (2005).
The paper has been written as follows: In section II we present the
methodology for optimal structure search, sampling and observable calculations
to monitor the cluster melting process. Then, in Section III we discuss the
features that differentiate the melting of doped clusters from that of the
pure ones, taking into account their composition and cluster size. Special
detail is given to the study of the low temperature solid-solid
transitions. Finally we present some general conclusions.
II METHODOLOGY
In this work we used the scaled Lennard-Jones (LJ) parameters and for the rare gas interactions reported in [Calvo and Yurtsever, 2004].
II.1 Optimal Structures
To obtain the (putative) global minima presented in Table 1 (excepting for the cases of the pure LJ clusters, the 13 atom clusters, Ar54Xe and ArXe54 which had already been reported in [Wales et al., ; Calvo and Yurtsever, 2004]) we perfomed three types of calculations:
-
1.
Local optimizations using the Fletcher-Reeves conjugate gradient algorithm (FRCGA) were performed starting from the structures of the global minima of each pure cluster, in which one atom of the pure cluster was substituted by the dopant atom. This way we obtained a set of icosahedral low energy structures.
-
2.
In a complementary, ampler search, we used the Basin-Hopping method(BH) Wales and Doye (1997). To sample the energy surfaces two types of random moves were perfomed: Moving all the atoms at the same time and swapping the dopant atom with an atom of the matrix. We performed at least 20000 steps (=swaps+moves) in which, after each move, we performed a local optimization using the FRCGA. For all the compositions the BH method arrived to the same result of the first procedure.
-
3.
Additionally, after the finite temperature simulations described in section II.2 we quenched samples saved at different temperatures for each composition. For the smallest clusters we performed around 25000 local minimizations, and for larger clusters about 55000 local optimizations.
The results were equivalent for all procedures in the above list. We note that
the first strategy was computationally much cheaper than the other two.
The minima in Table 1 were used to initialize the finite temperature
simulations.
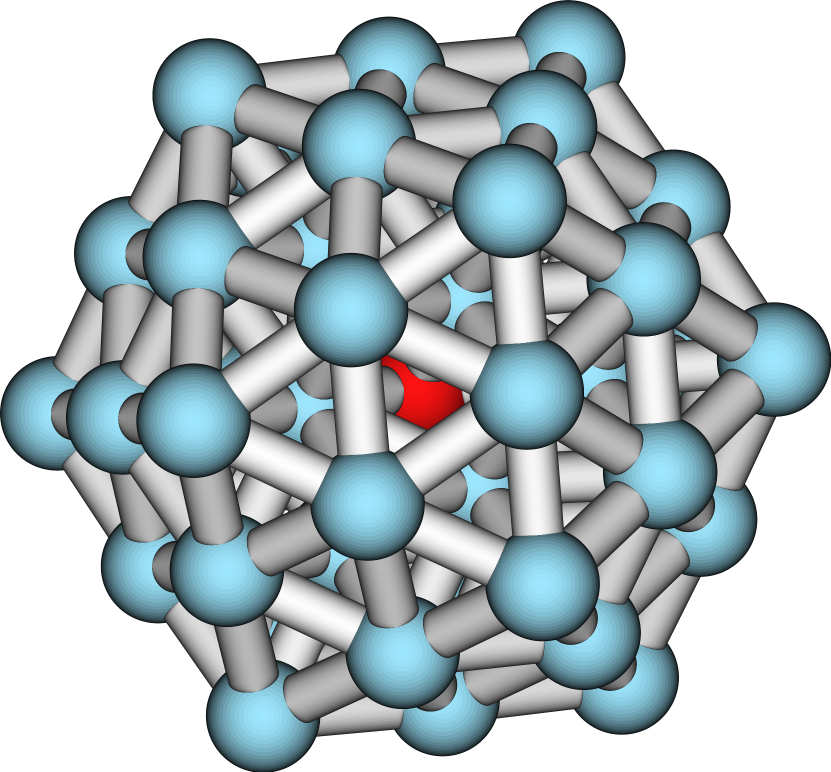
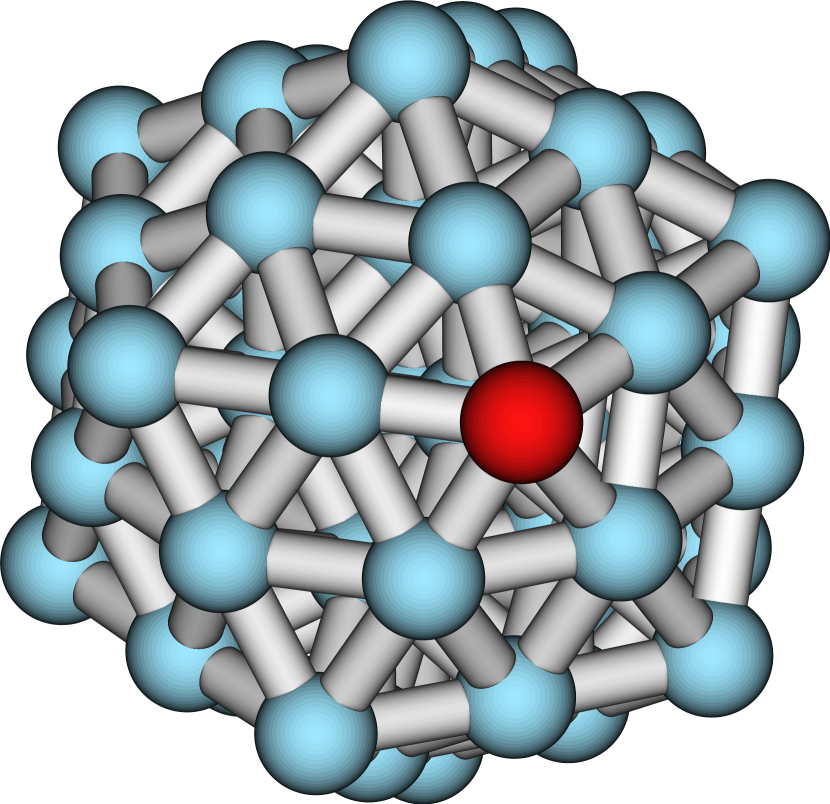
Considering the lowest energy structures the dopant atom takes the central
position of the cluster when the impurity is Ar or Kr, while it remains in
one of the two most external shells when the impurity is Xe.
| Cluster | Dopant | Point | |||
|---|---|---|---|---|---|
| Position | Group | ||||
| LJ13 | -44.3268 | -44.3268 | - | - | |
| Ar12Xe | -47.6981 | -47.6981 | 1/1 | 30.22 | |
| ArXe12 | -78.6977 | -42.4934 | 0/1 | 59.96 | |
| Kr12Xe | -62.5139 | -45.5132 | 1/1 | 41.51 | |
| KrXe12 | -81.0895 | -43.7848 | 0/1 | 62.74 | |
| LJ55 | -279.248 | -279.248 | - | - | |
| Ar54Xe | -284.276 | -284.276 | 2/2 | 31.25 | |
| ArXe54 | -516.170 | -278.709 | 0/2 | 63.78 | |
| Kr54Xe | -386.018 | -281.040 | 2/2 | 42.93 | |
| KrXe54 | -517.631 | -279.498 | 0/2 | 65.33 | |
| LJ147 | -876.461 | -876.461 | - | - | |
| Ar146Xe | -882.335 | -882.335 | 3/3 | 42.33 | |
| ArXe146 | -1625.44 | -877.667 | 0/3 | 79.86 | |
| Kr146Xe | -1206.77 | -878.584 | 3/3 | 58.14 | |
| KrXe146 | -1625.44 | -877.666 | 0/3 | 79.59 | |
| LJ309 | -2007.22 | -2007.22 | - | - | |
| Ar308Xe | -2013.39 | -2013.39 | 3/4 | 50.18 | |
| ArXe308 | -3722.59 | -2010.04 | 0/4 | 94.13 | |
| Kr308Xe | -2760.16 | -2009.53 | 3/4 | 68.92 | |
| KrXe308 | -3721.20 | -2009.28 | 0/4 | 93.06 |
II.2 Sampling Strategy
To sample the complex energy surfaces of our systems in the Canonical Ensemble we used the PTMC method Topper et al. (2003). For each replica we have used two types of moves. On the one hand, single particle moves (SPM) have been implemented using an adapstive step that assures that half of the time the new configuration will be accepted. On the other hand, since we have two different atomic species in each cluster we have also implemented particle exchange moves. This sampling strategy consists in exchanging the position of two different atoms in the clusters. The simulation temperatures were chosen according to the geometric progression . The number of temperatures for the simulations as well as their maximum and minimum values are summarized in Table 2.
For each system the number of equilibration steps was always equal to the
number of Monte Carlo steps (). To prevent the evaporation of the
clusters we implemented hard sphere constraining potentials for the constraining radii
listed in Table 2.
Finally, the swapping acceptance ratios between replicas in all the systems
simulated remained around 60-70% and never went below 35%.
| 13 | 31 | 0.01 | 0.4 | 2.5 | 4 108 | 100 |
| 55 | 71 | 0.01 | 0.4 | 3.5 | 8 108 | 100 |
| 147 | 71 | 0.01 & 0.2 | 0.4 & 0.5 | 4.5 | 1.6 109 | 250 |
| 309 | 71 | 0.2 | 0.5 | 5.5 | 2 109 | 500 |
II.3 Observables
We analyse the melting process by monitoring various observables. Firstly, the heat capacity , which is calculated according to the formula:
To interpolate the points obtained with the PTMC simulation and have a smooth dependence in the curve we used the multihistogram method Ferrenberg and Swendsen (1989); Labastie and Whetten (1990). Note that the formula given above depends on the volume in which the system is constrained to move. In figure 1 we compare the curves for two constraining volumes. Notice that although the second volume is twice the first () the main peak is not strongly affected and the features of the curve below the main peak basically do not change (As one expects from a “solid” phase).
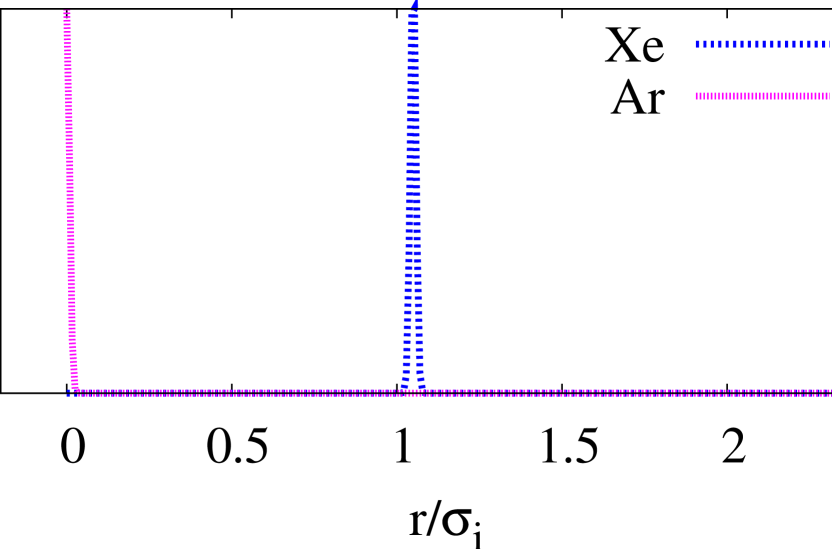
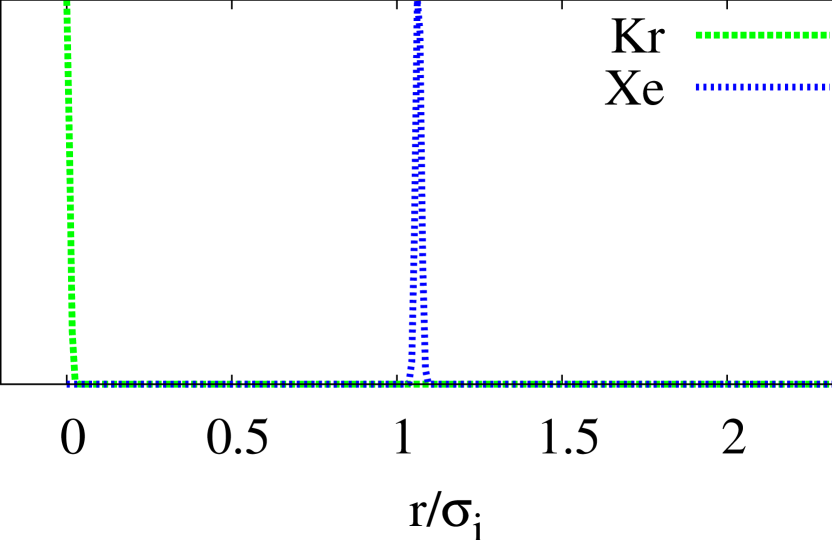
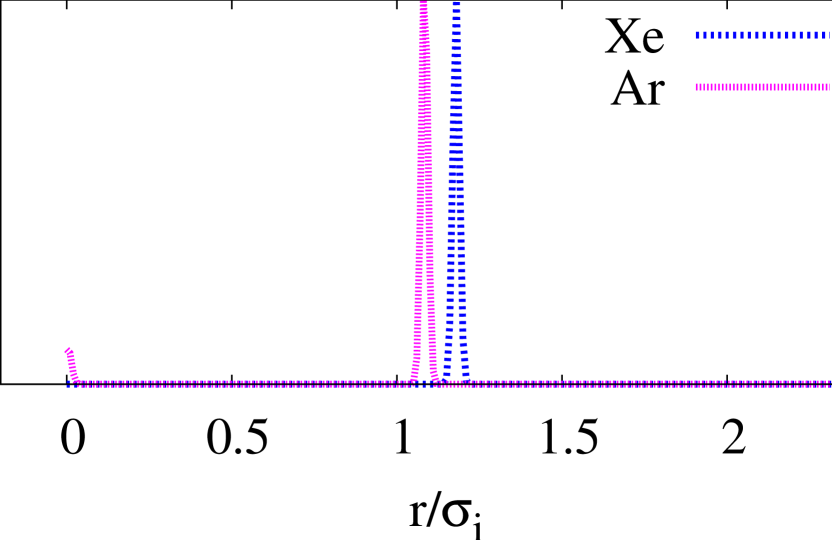
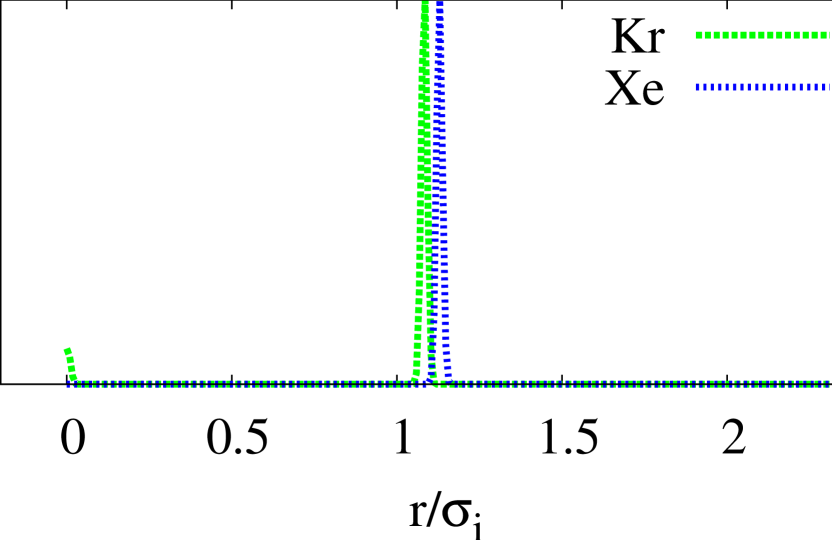
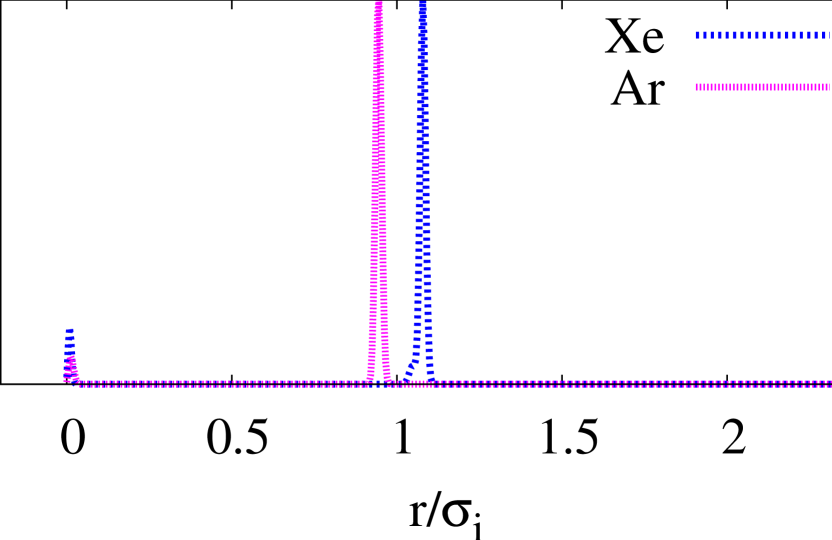
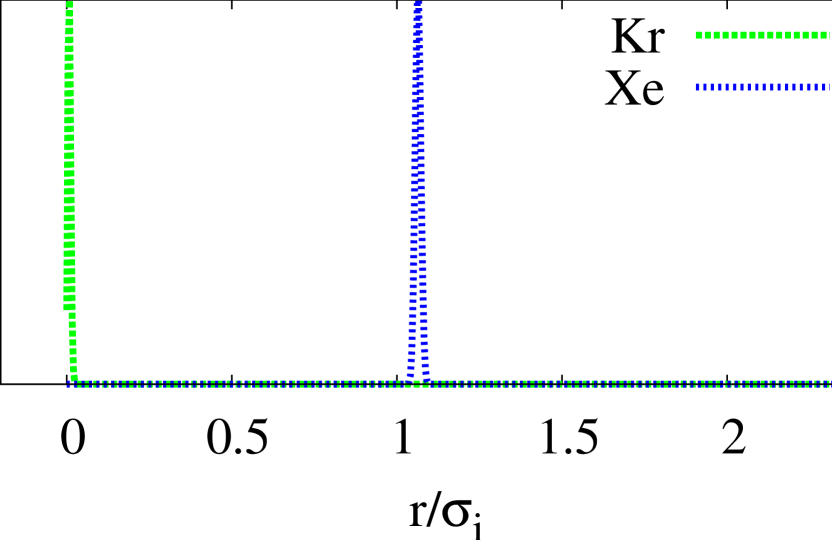
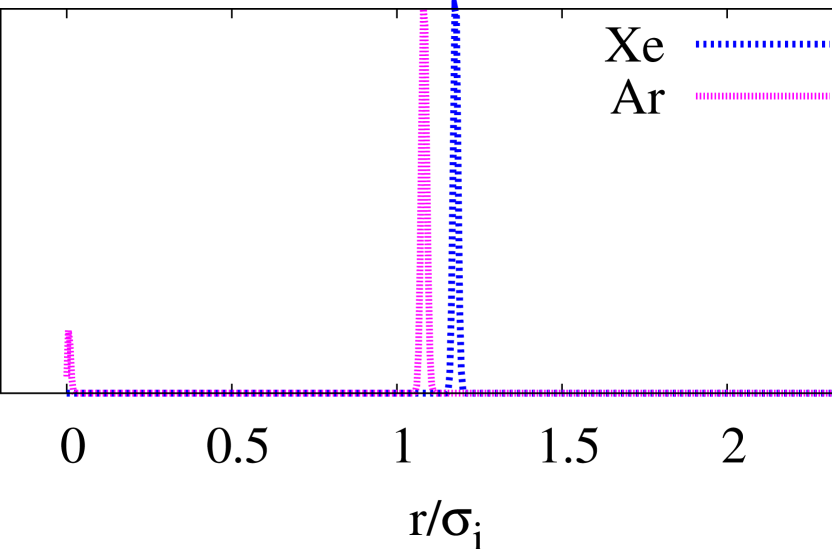
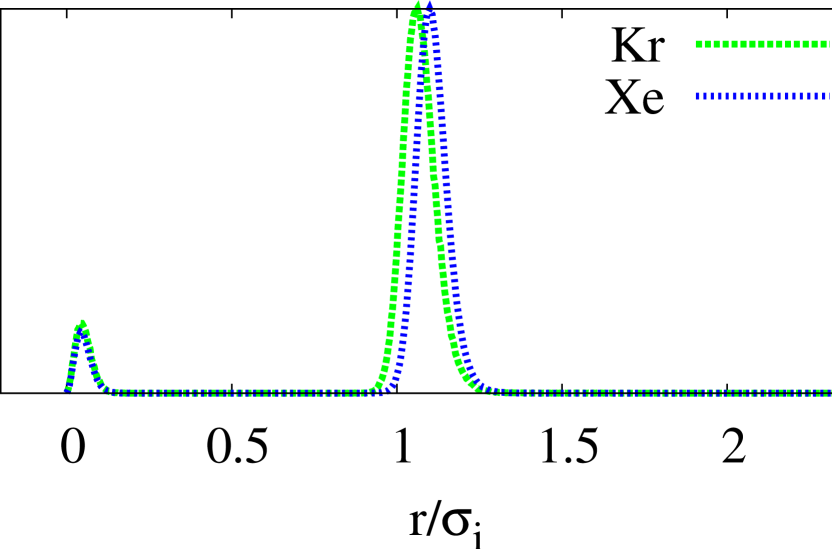
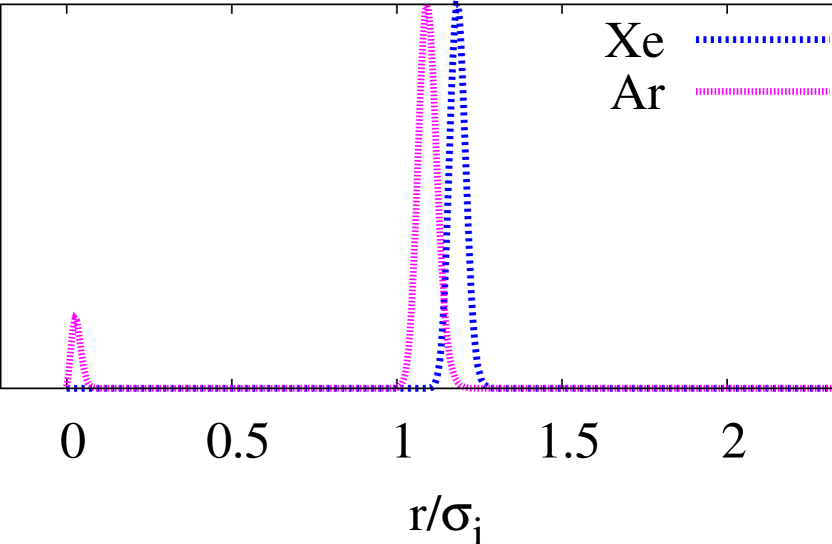
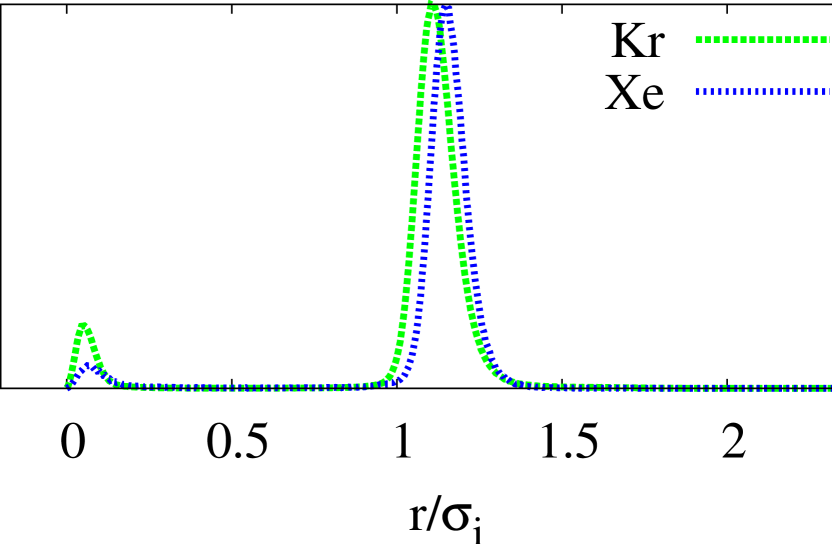
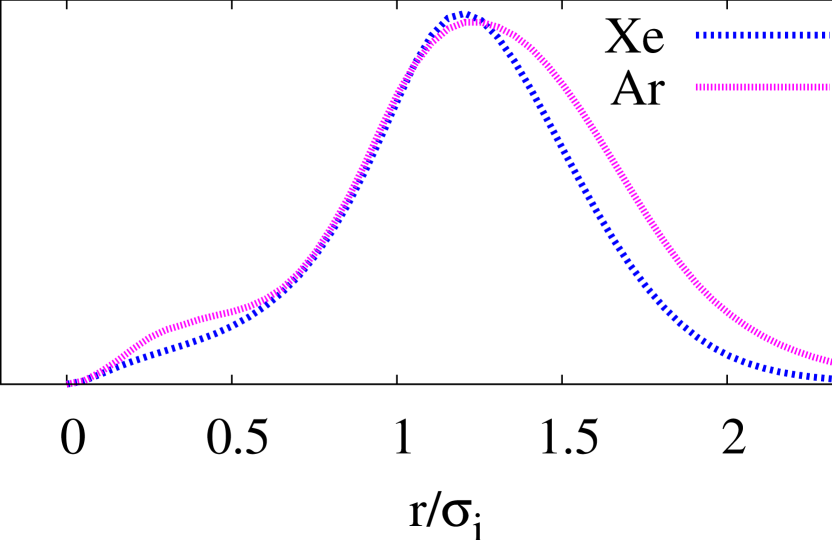
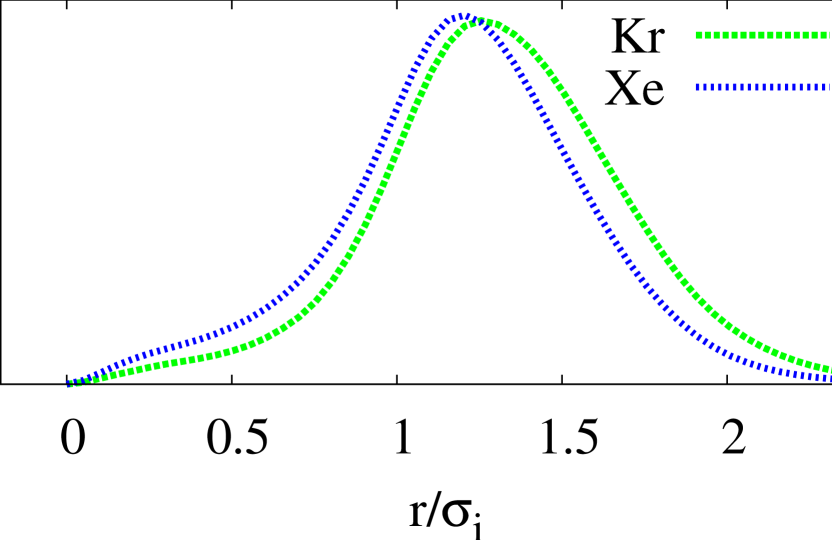
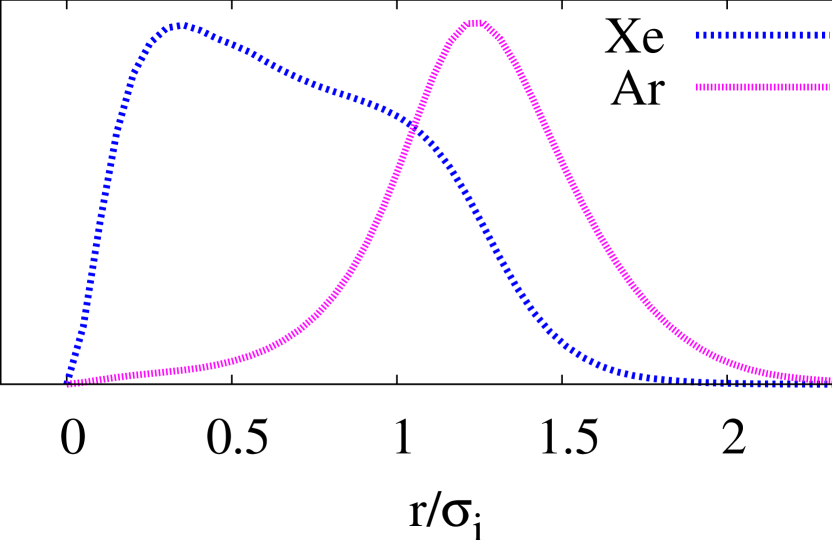
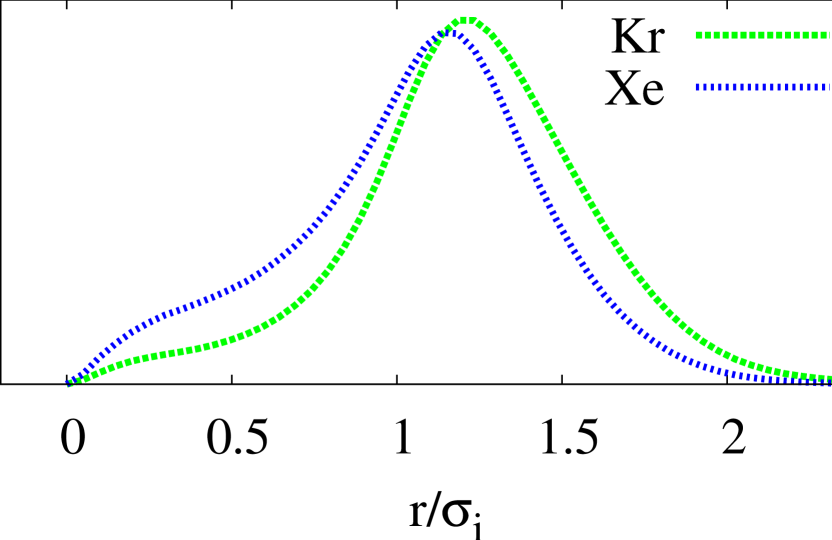
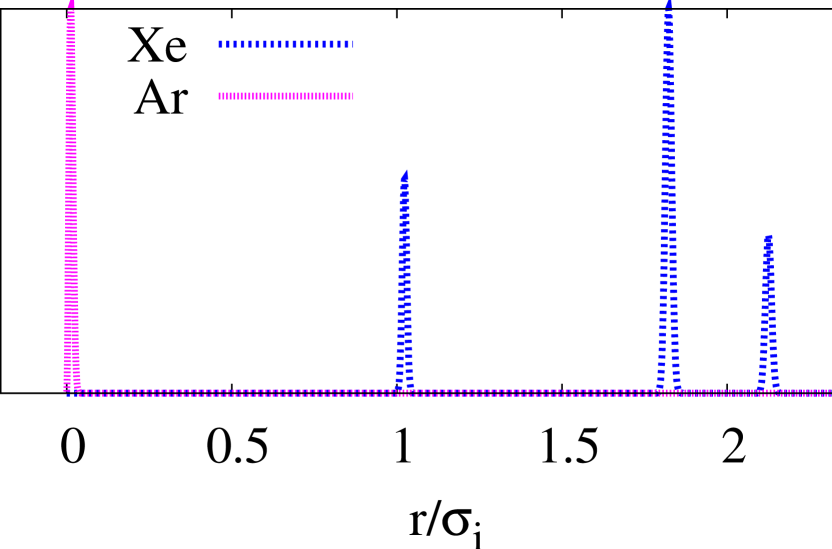
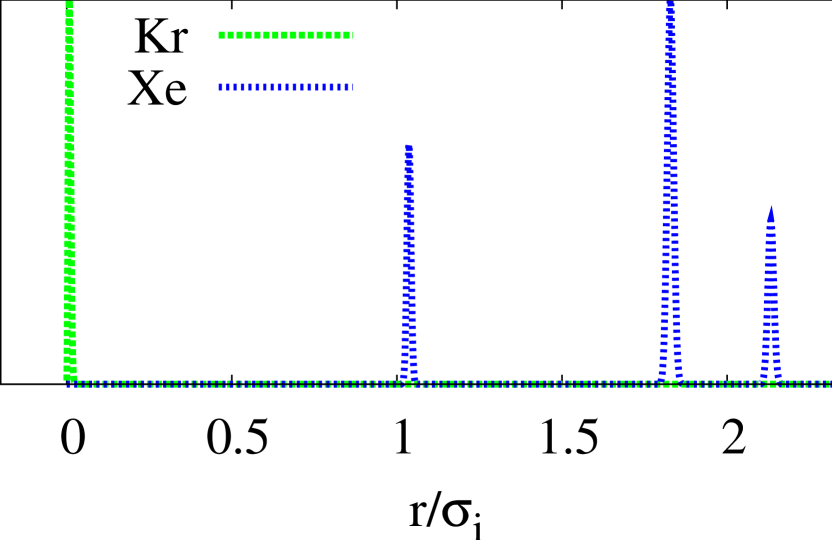
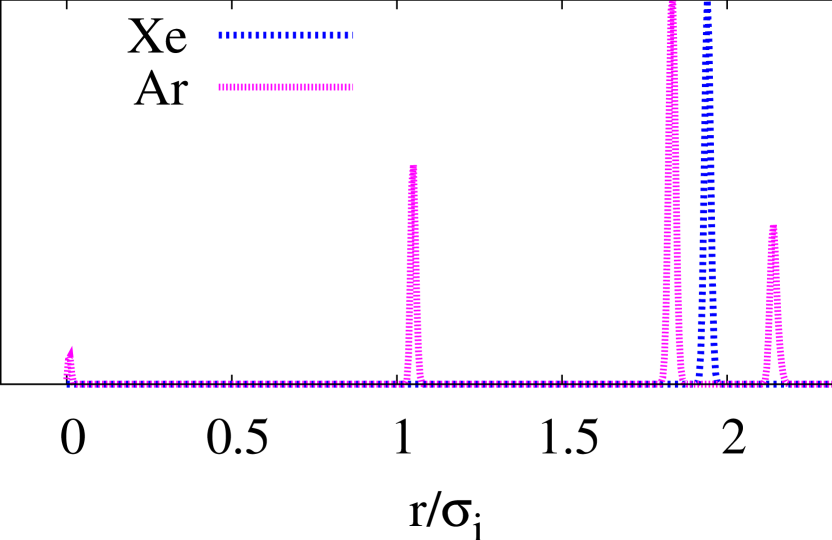
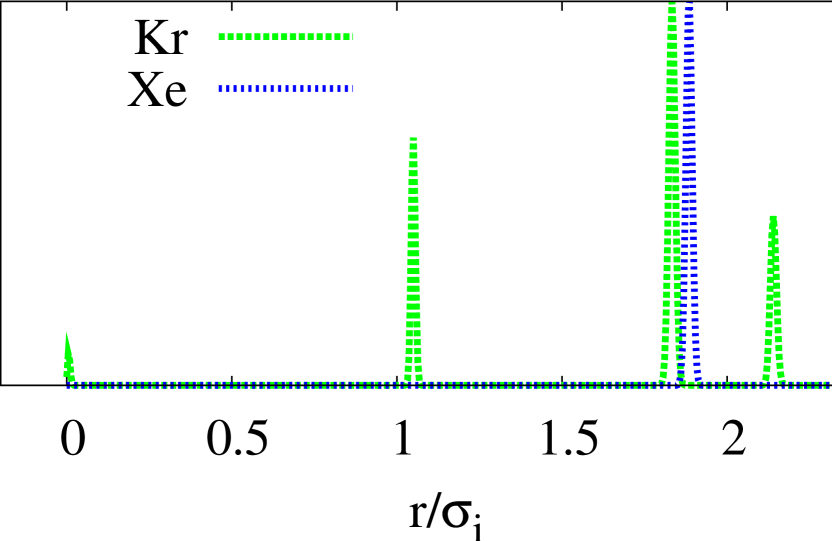
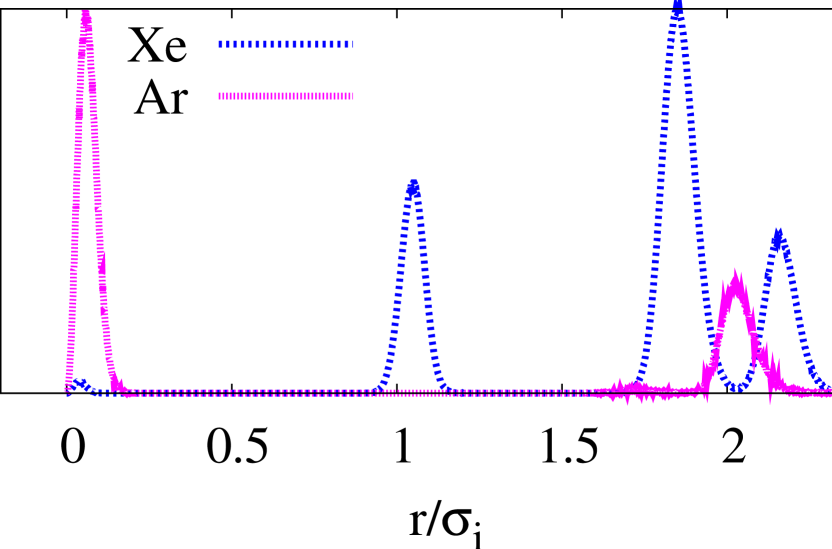
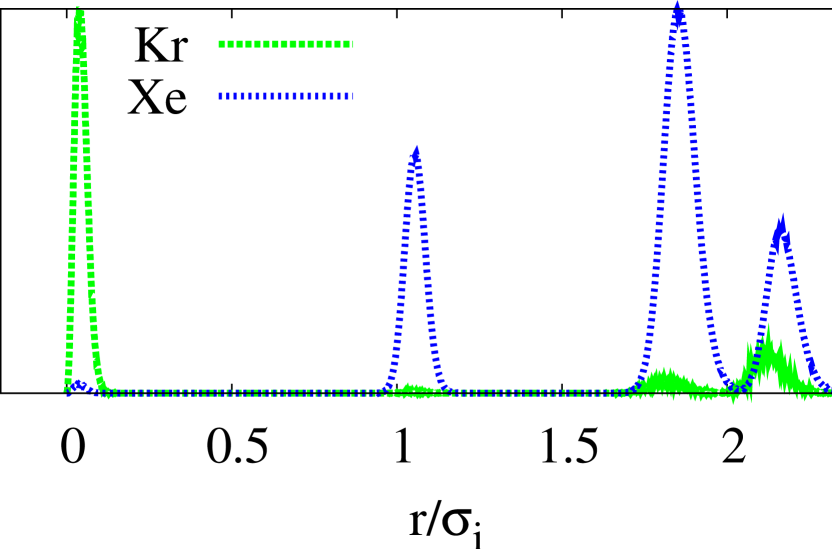
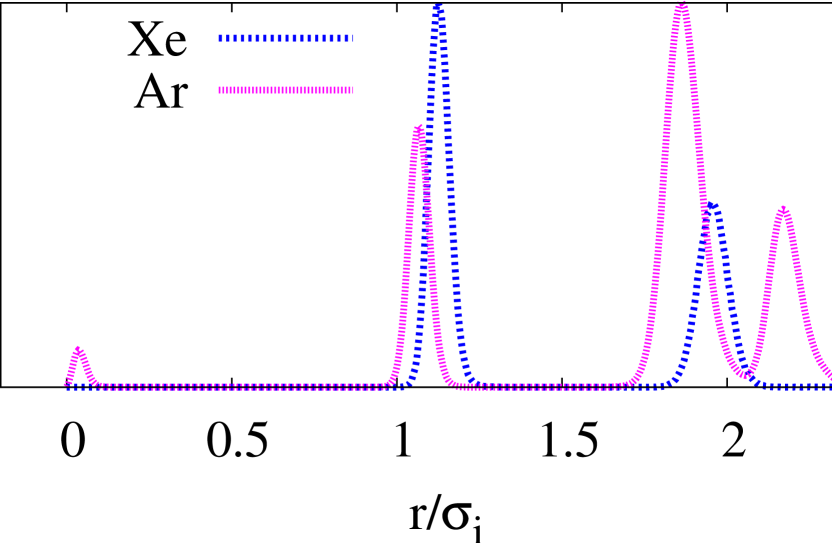
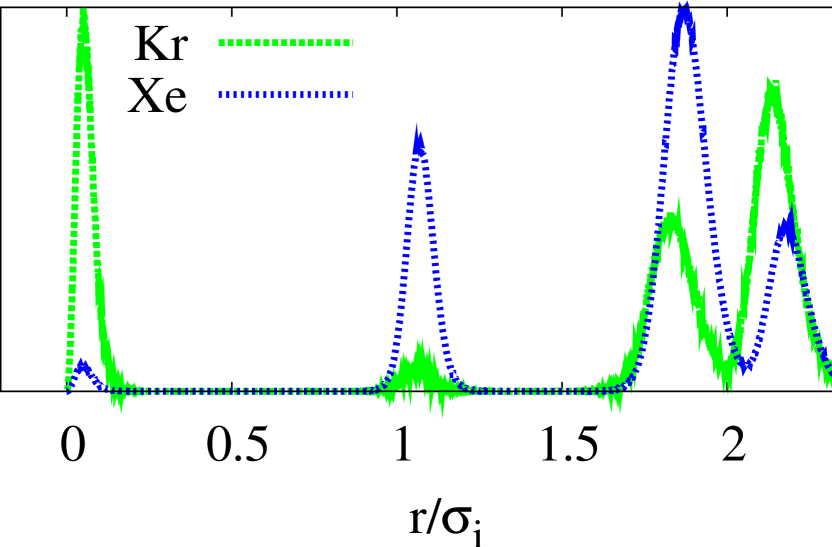
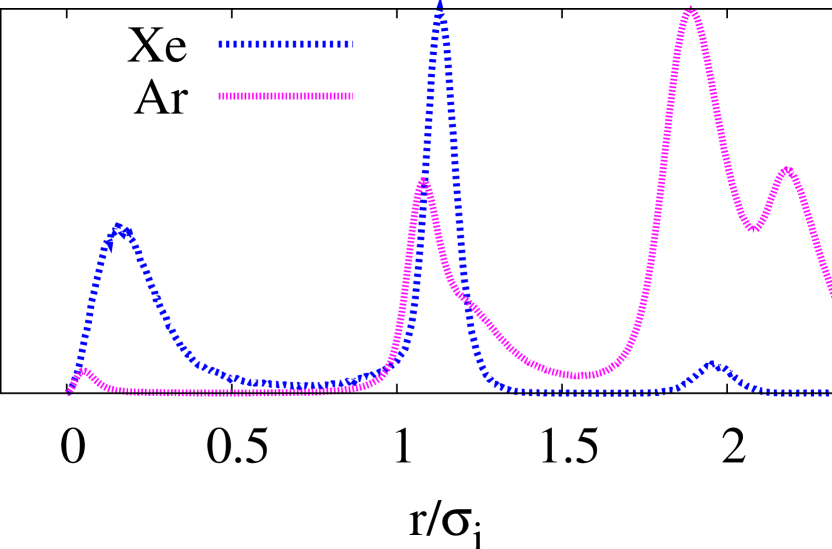
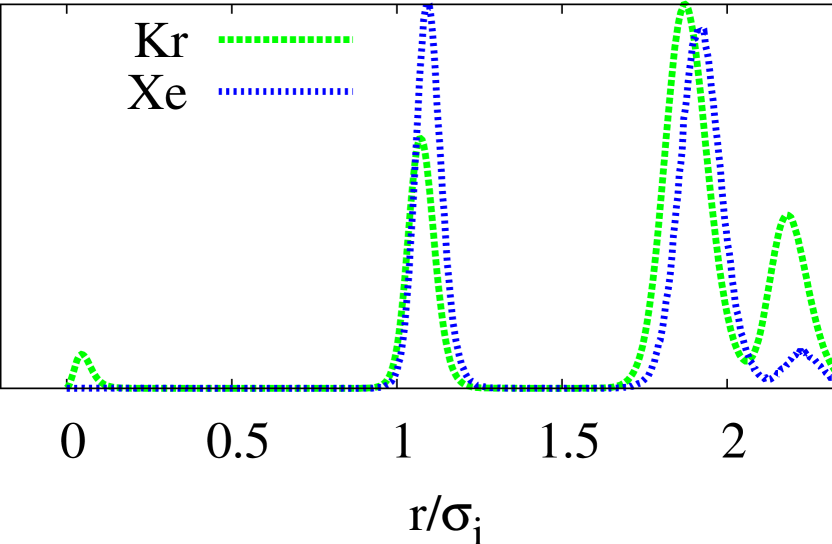
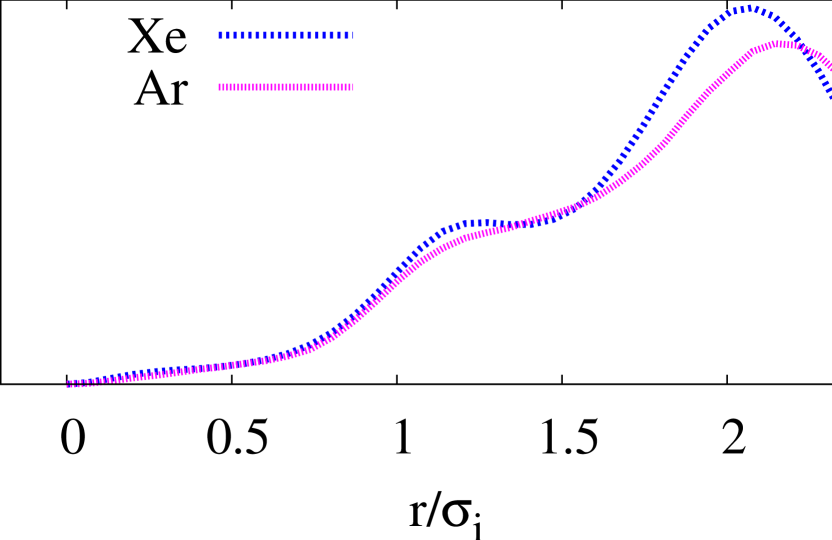
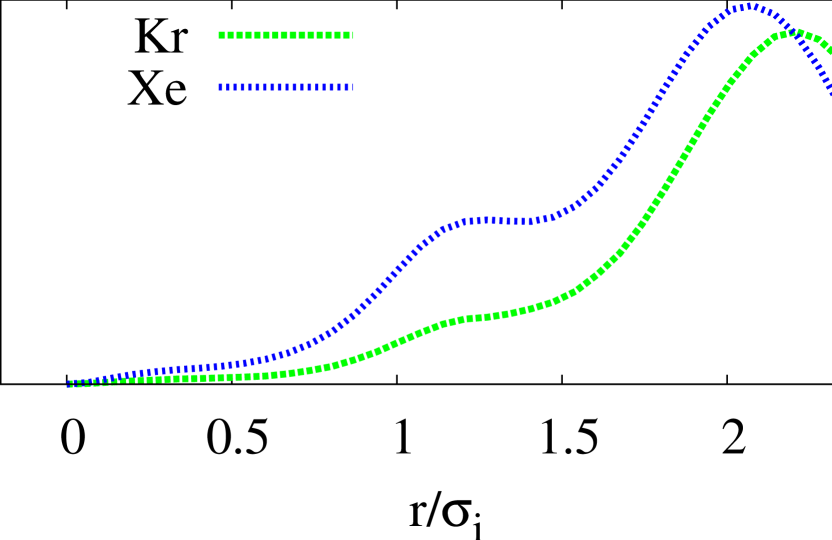
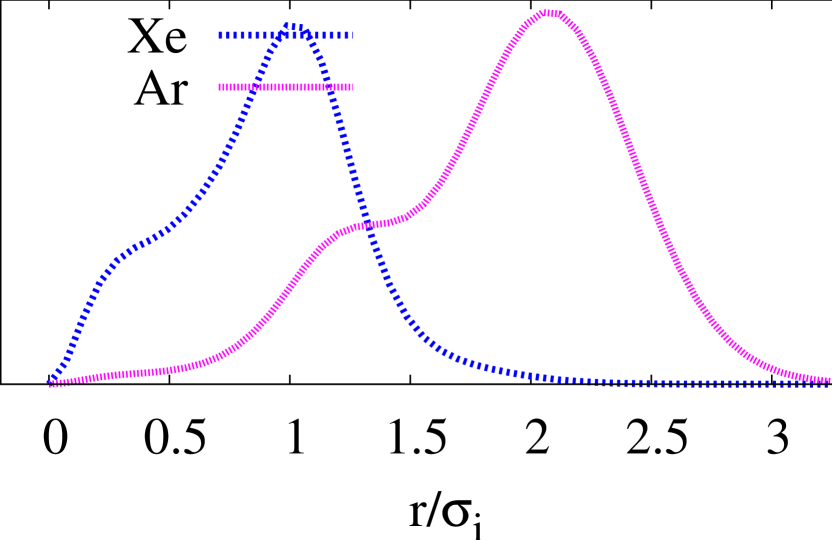
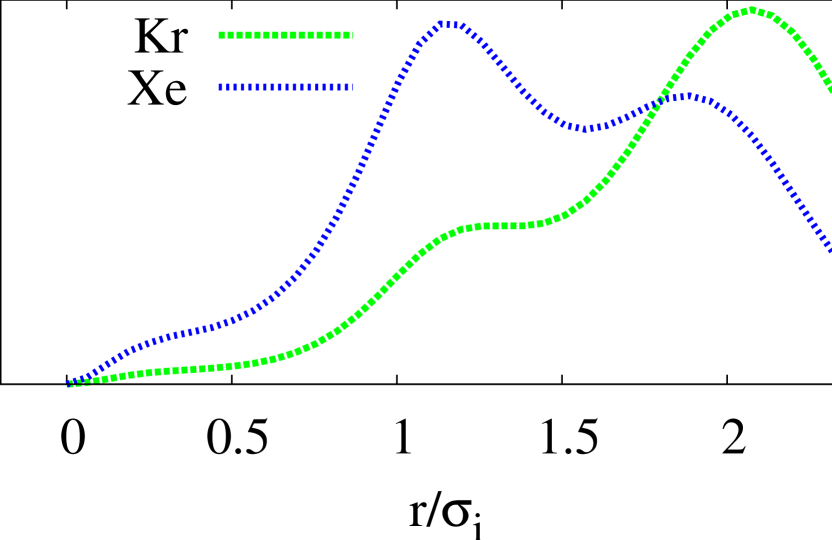
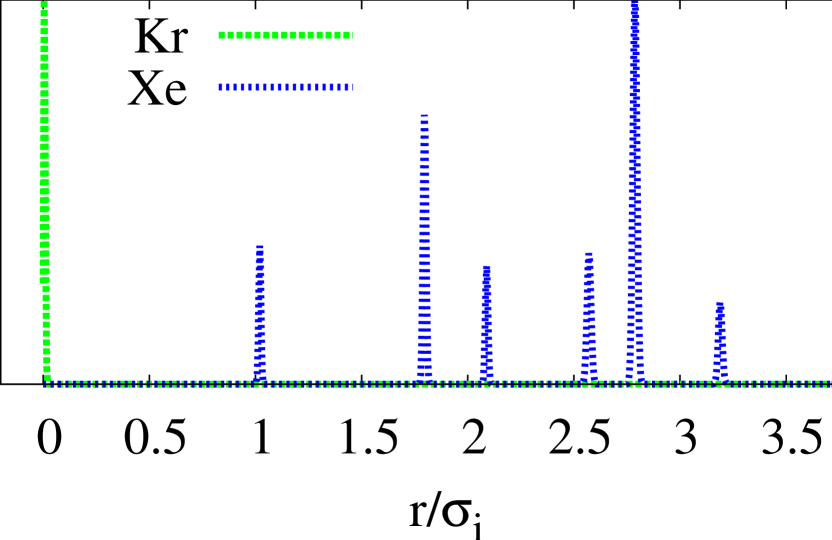
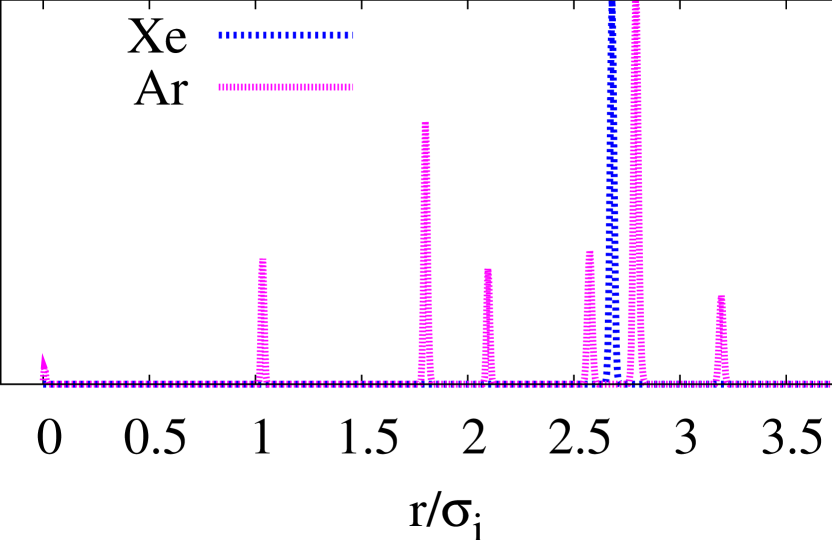
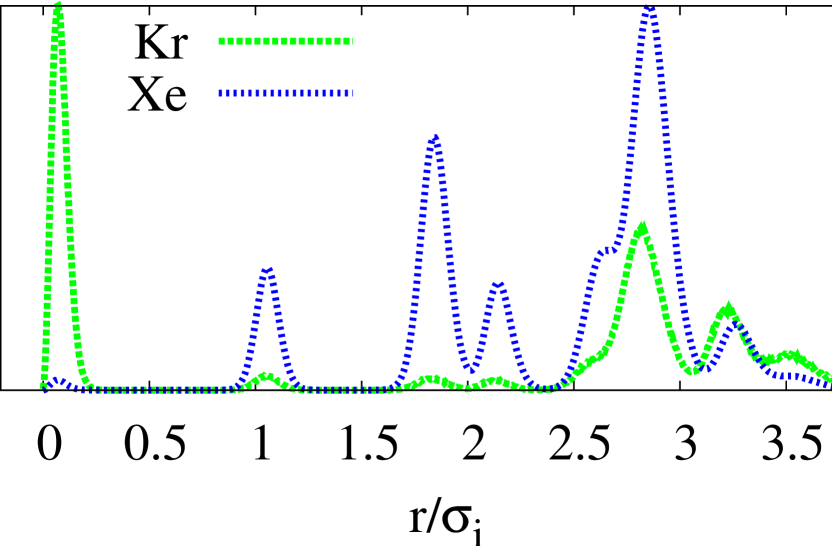
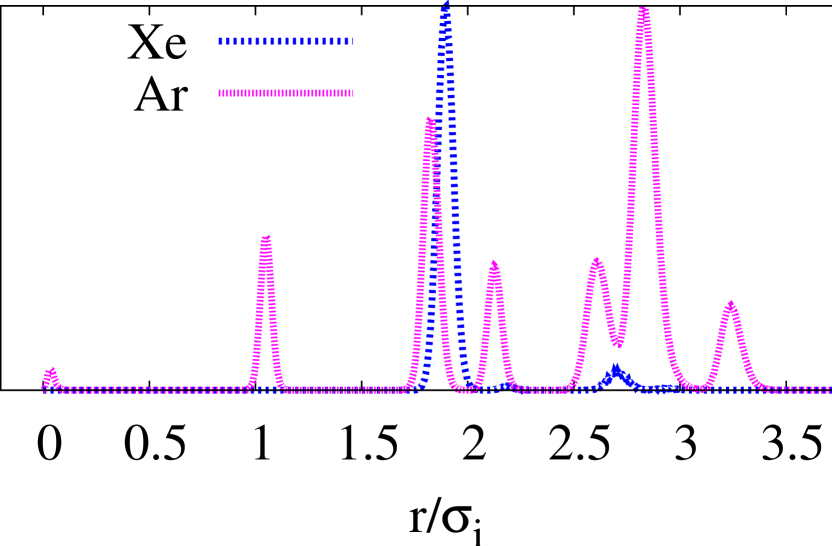
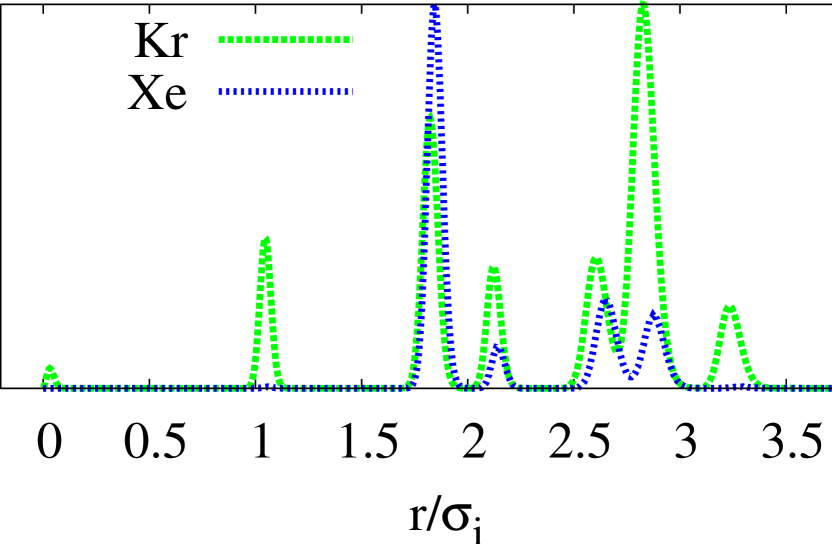
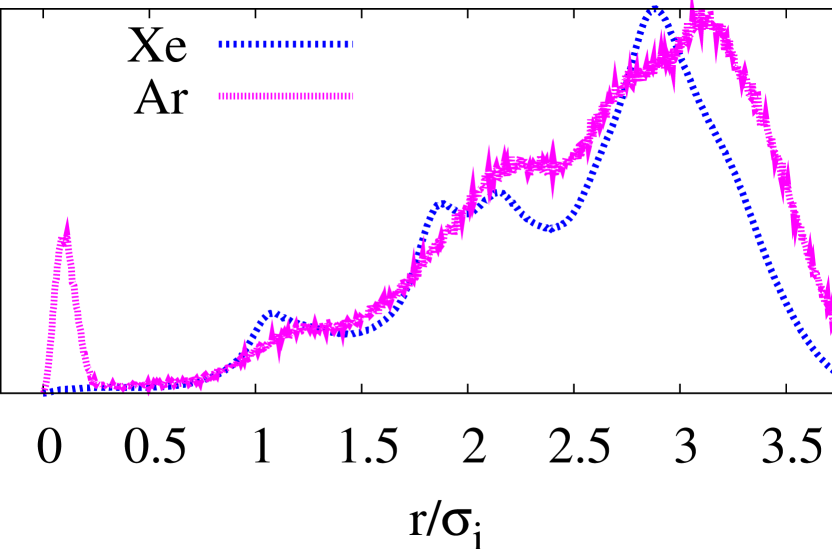
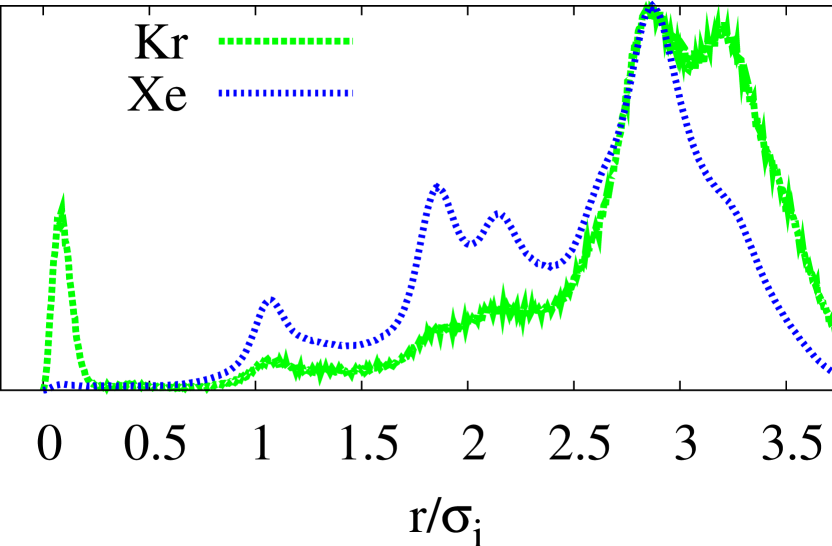
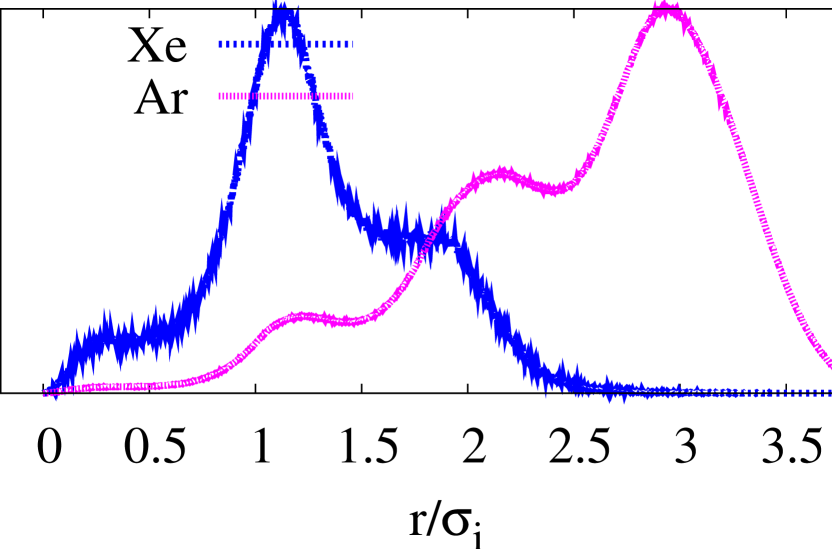
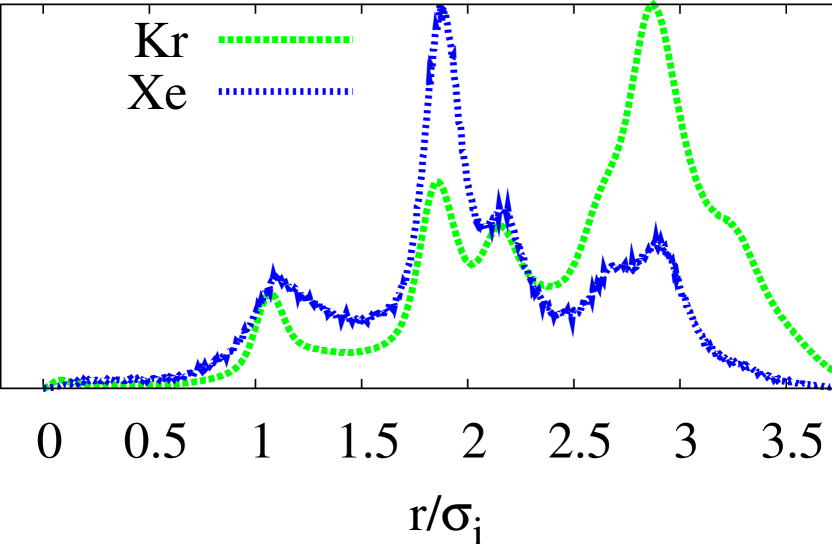
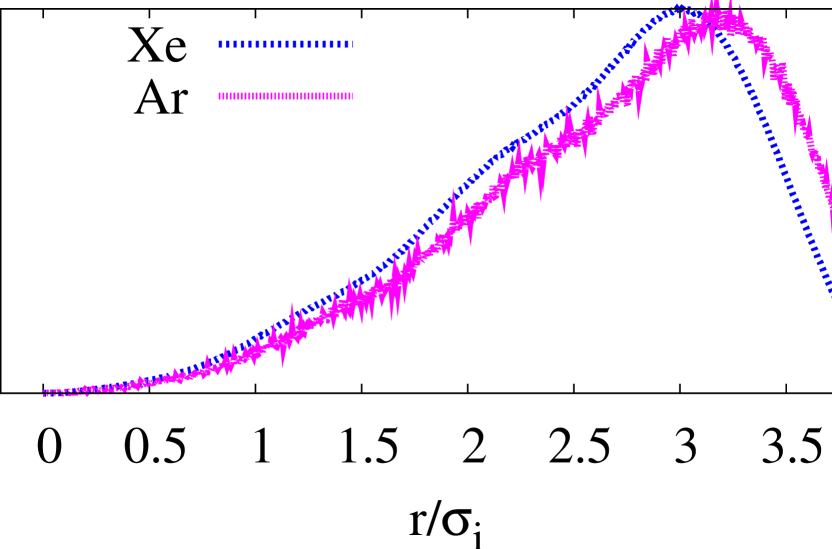
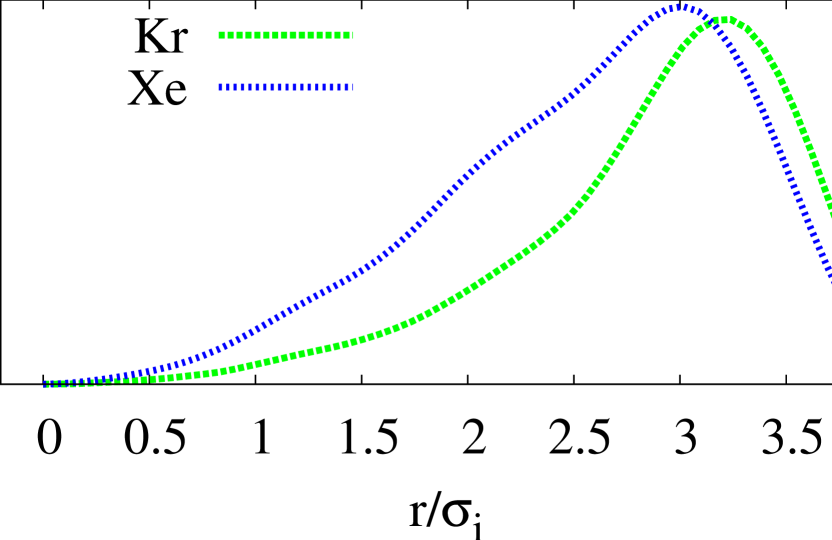
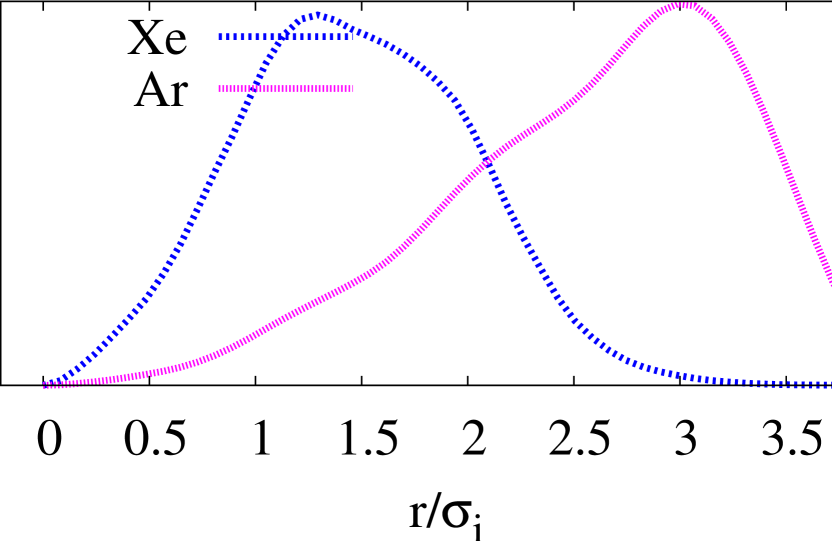
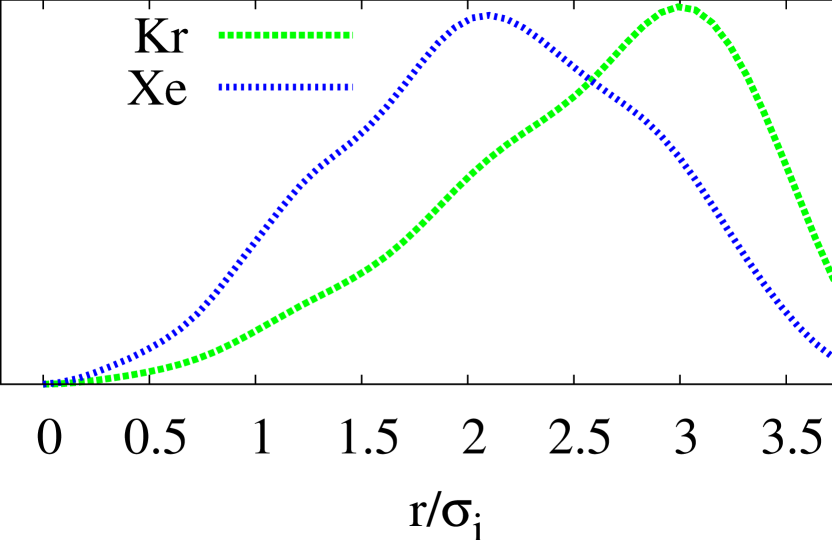
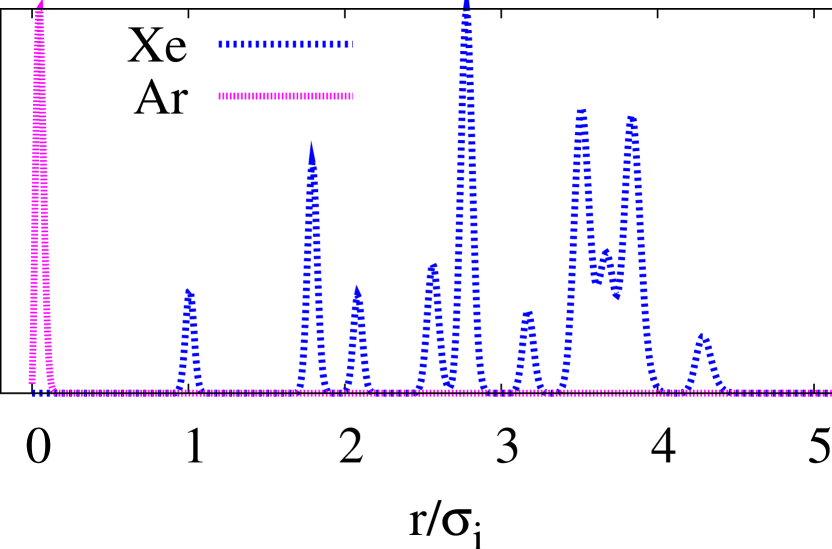
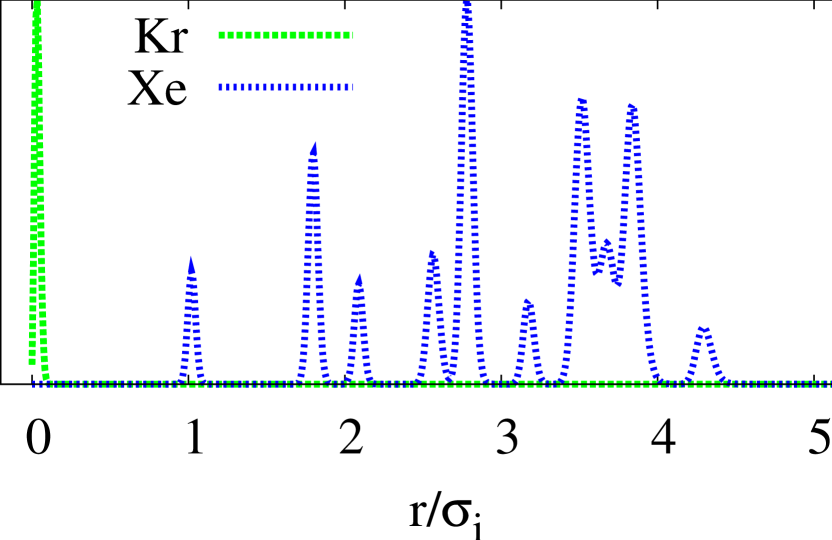
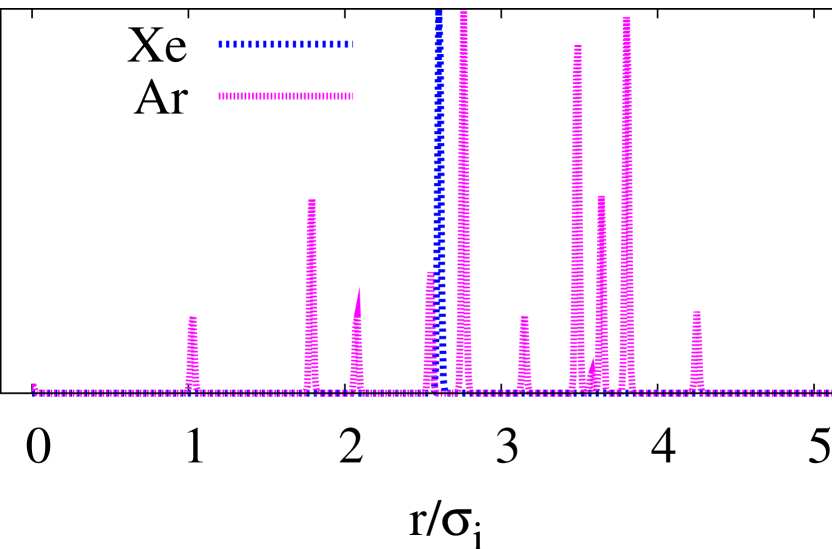
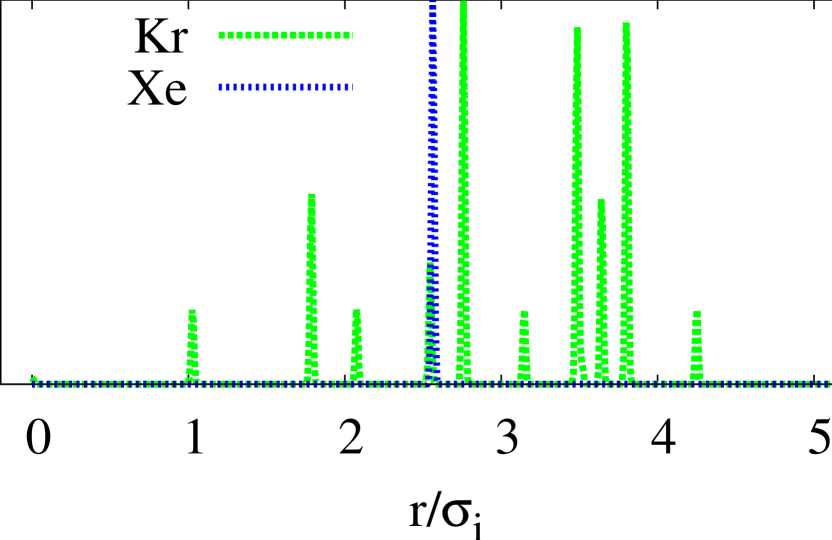
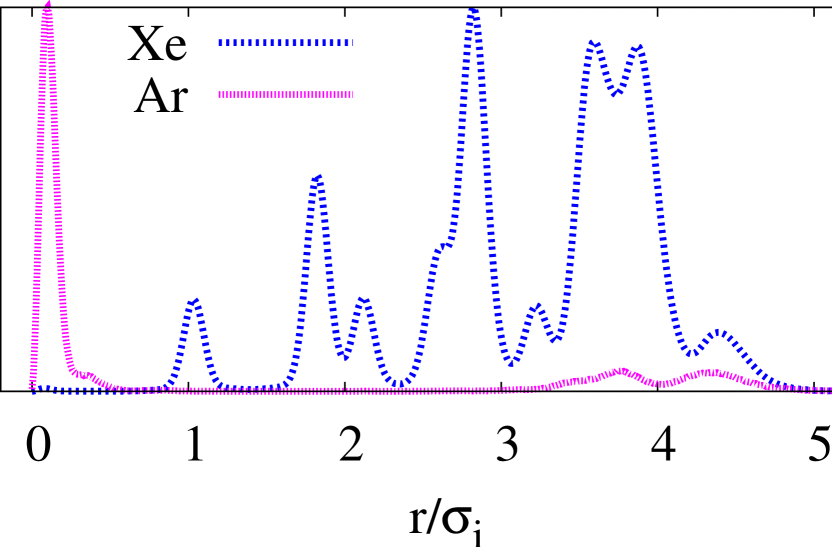
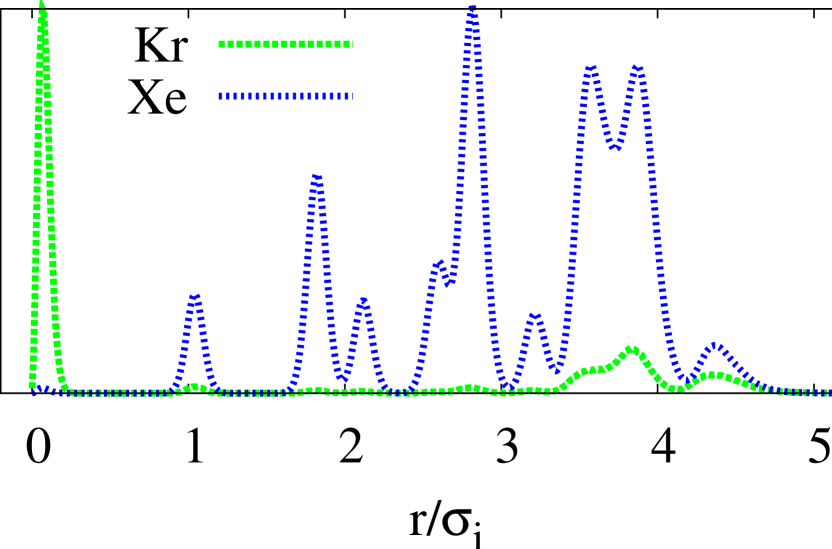
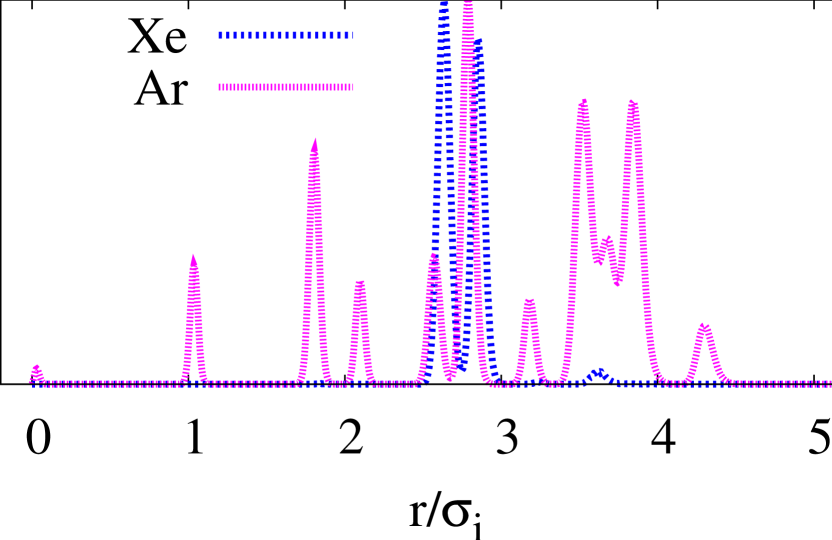
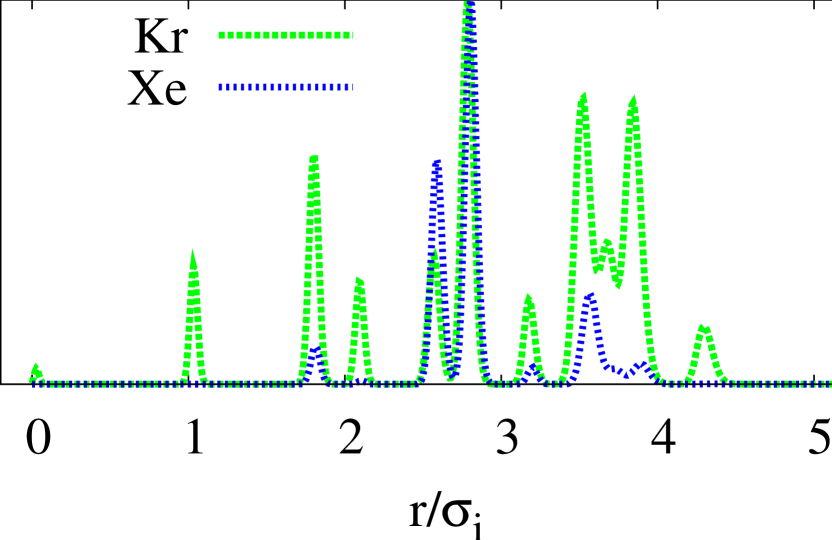
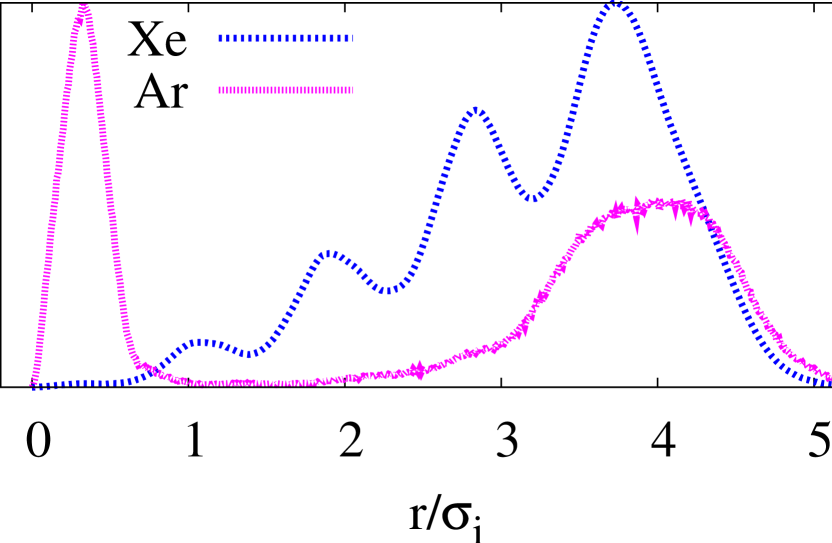
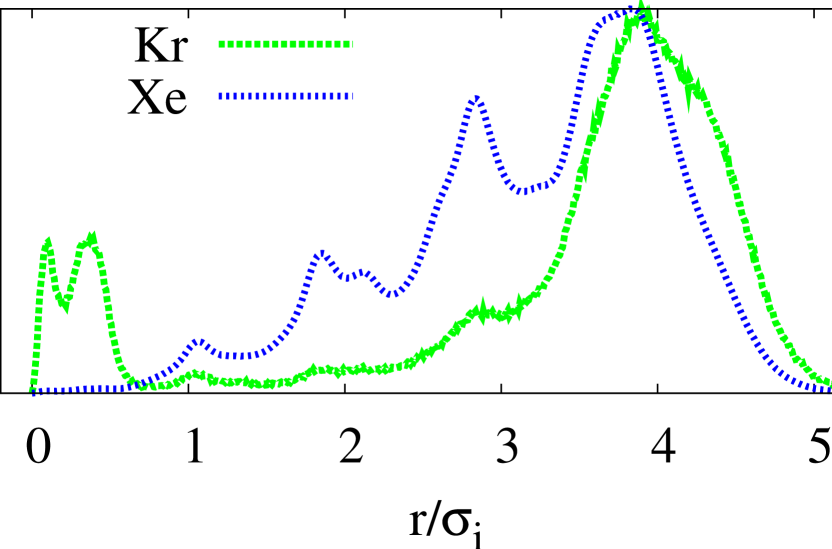
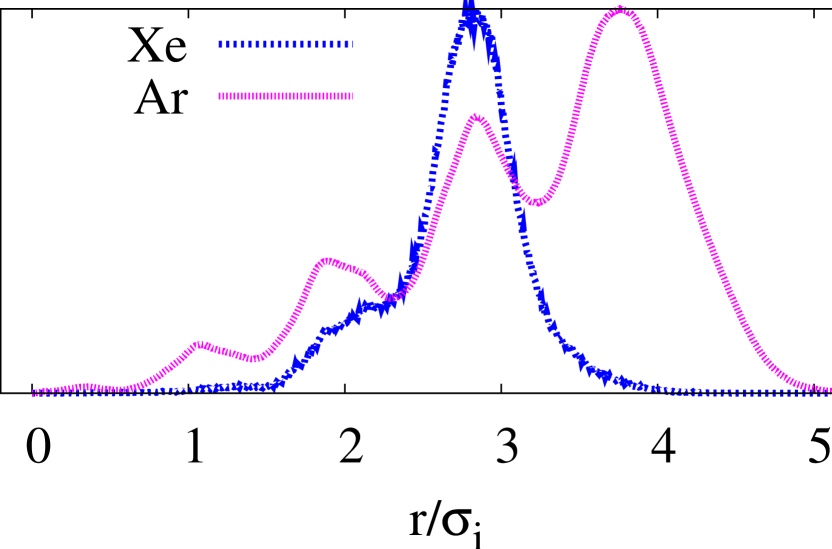
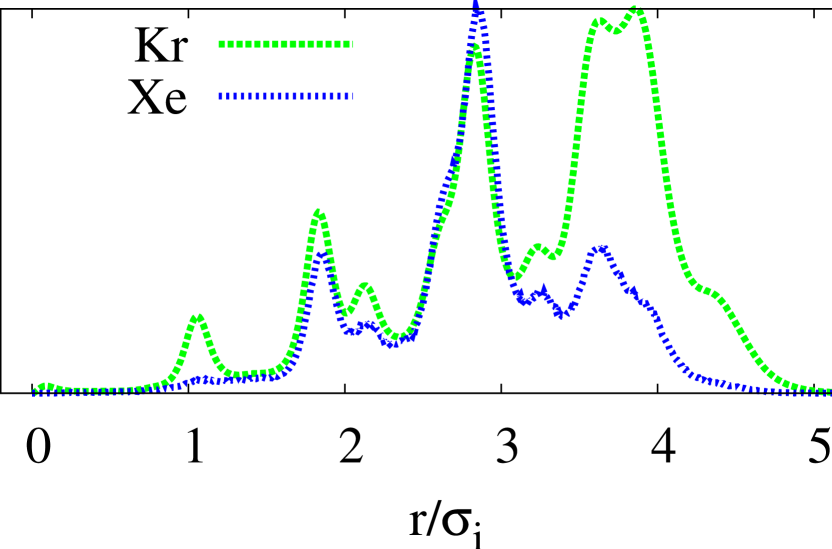
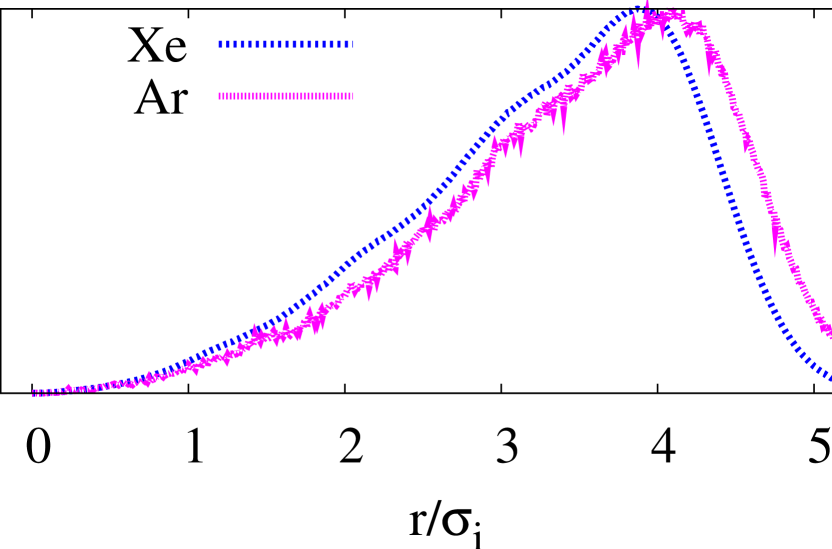
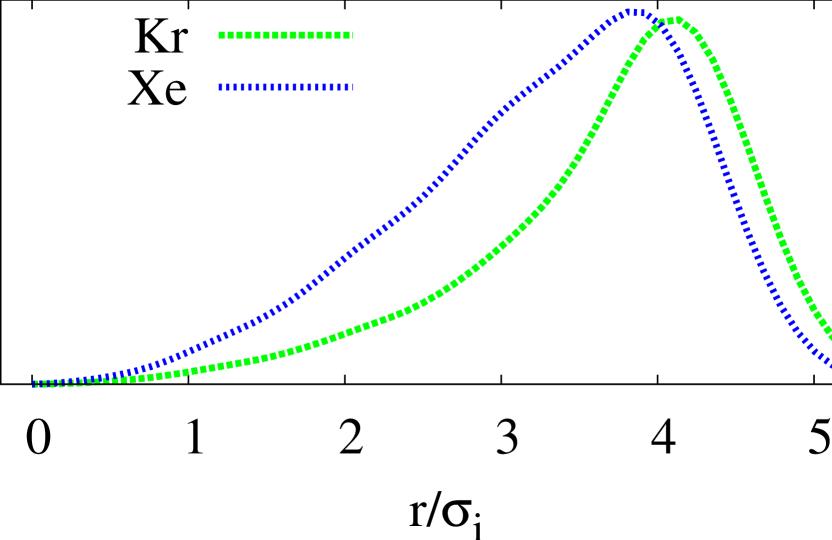
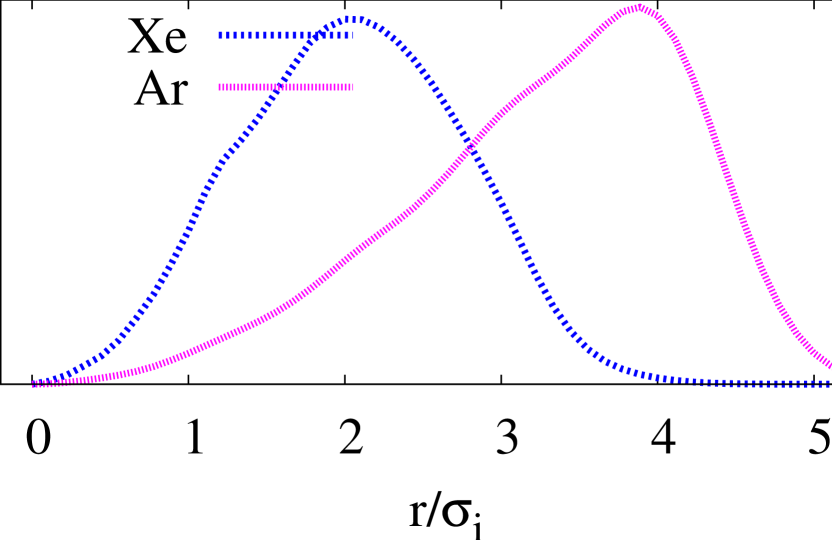
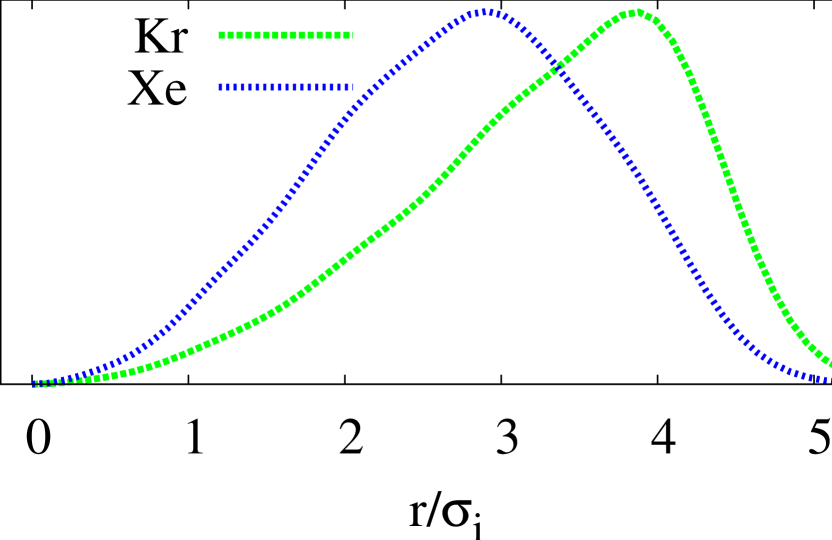
To monitor the effects of the dopant atom in each cluster we calculated
the radial distributions functions (RDF) of the dopant atom and of the rest of the atoms in the
matrix, for these calculations all the distances have been taken with respect to the
geometric center of the cluster , where
, represents the total number of atoms
in the cluster.
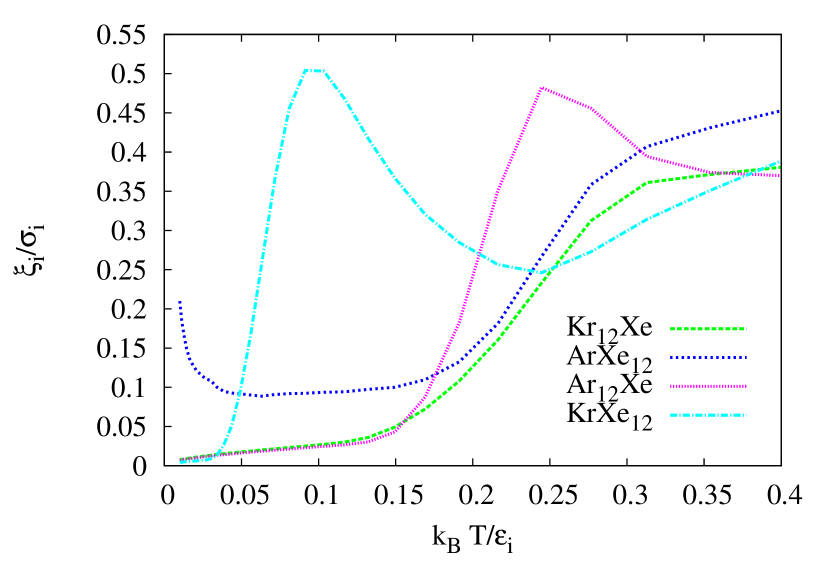
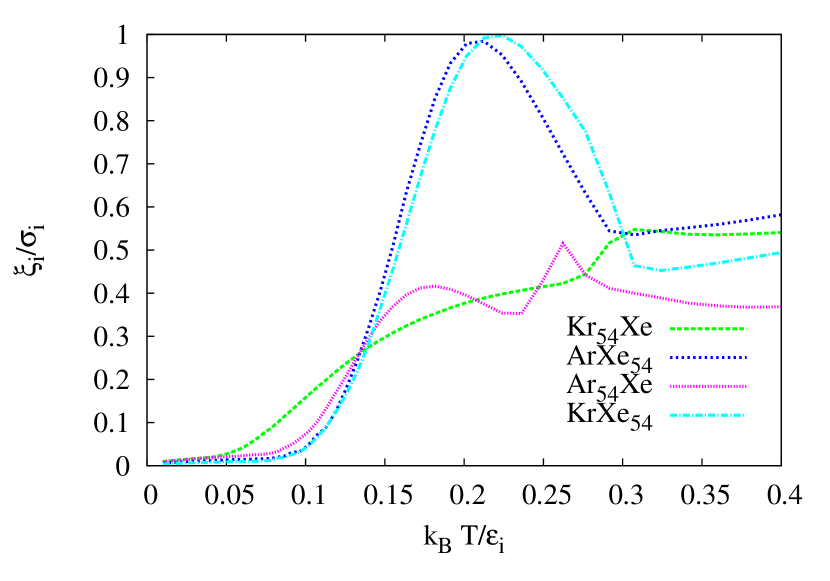
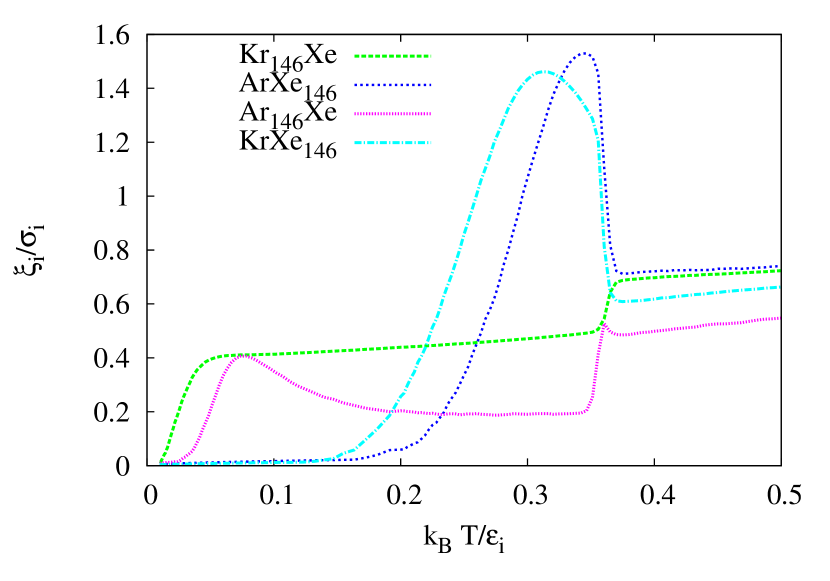
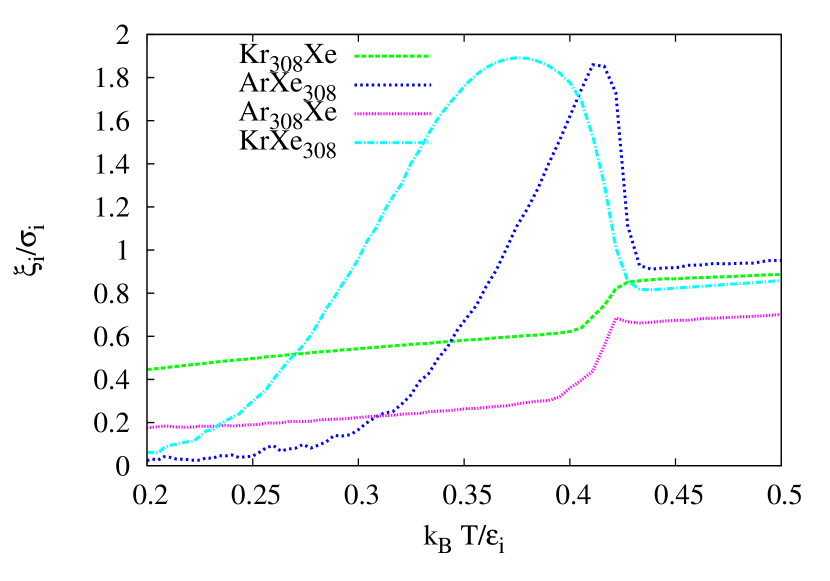
To further quantify the delocalization of the atom we calculated the standard
deviation of the RDF of the dopant atom () according to:
II.4 Harmonic Superposition Method
To understand the solid-solid transitions that occur in a doped cluster between homotops of the same stoichiometry we have used the Harmonic Superposition Method (HSM) Amar and Berry (1986); Doye and Calvo (2001).
This method assumes that there is a number of well defined states that make most of the contribution to the partition function in a certain range of temperatures. Then, one approximates the contribution of each state to the partition function () as the contribution of its harmonic part. Such partition function is obtained from the normal modes and frequencies by expanding the potential around the corresponding minimum in a power series up to quadratic order:
where , is the equilibrium position and is the Hessian Matrix of that minimum. To obtain the partition function (and the thermodynamics of the system) one adds the Simple Harmonic Oscillator partition functions of each state:
where , is the energy of each state, is its degeneracy due to symmetry (, the number of atoms, the number of impurities, and the order of the point group of the state ). is the geometric mean vibrational frequency of each state (which is proportional to geometric mean of the square roots of the eigenvalues of the matrix ) and is the number of atoms considered.
III RESULTS AND DISCUSSION
III.1 Size dependence of the melting temperature
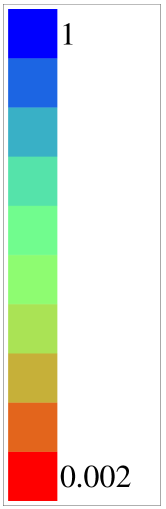
In figure 2 we present the results of our calculations
regarding the variation of the melting temperatures as a function of
. It is seen that as the size of the cluster is increased the
melting temperature of the clusters also increases, this behavior has been
verified for Ar and Xe clusters Pahl et al. (2008).
The case of is certainly out of any linear tendency for all the
compositions, yet, for other larger clusters where surface
effects are less marked the dependence of the melting temperature as a
function of can be well described by a line, and in all cases
increases with the size of the cluster. From figure 2 is
clearly seen that doping effects are very strong for small doped clusters
(), whose atoms have the highest differences between their LJ
parameters, and (In this case Argon and Xenon). It is also
seen that for the largest cluster sizes studied here their melting
temperatures are almost equal for the doped and pure clusters.
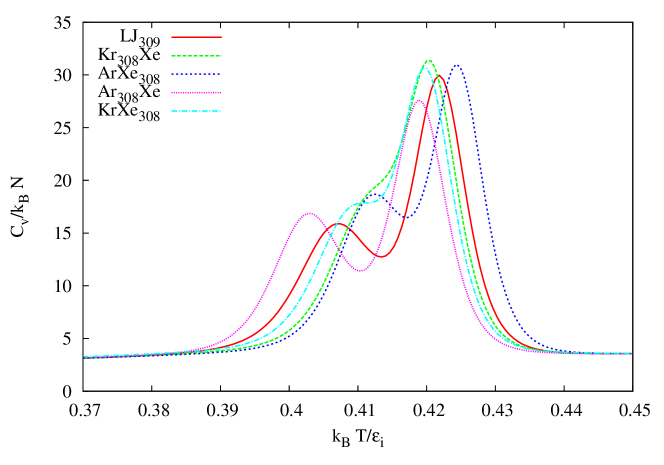
III.2 Doping effects: Composition and Size Dependence
So far we have discussed the doping effects solely in terms of the position,
on the temperature scale, of the peak associated with the melting of the
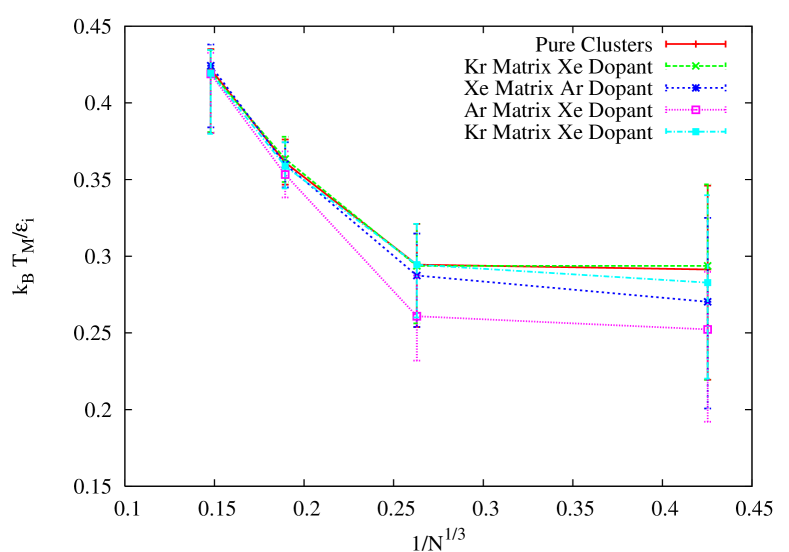
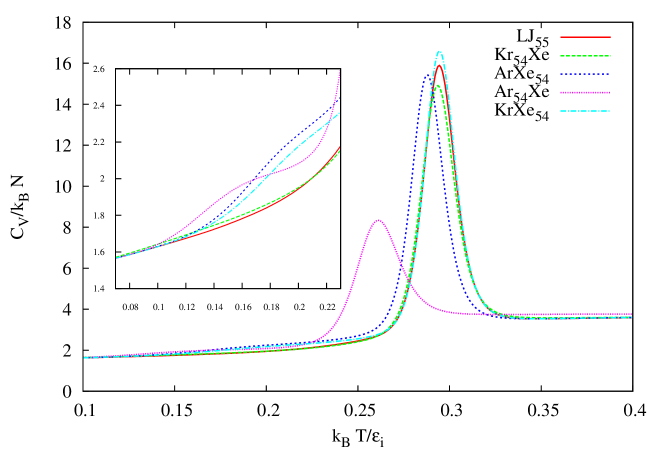
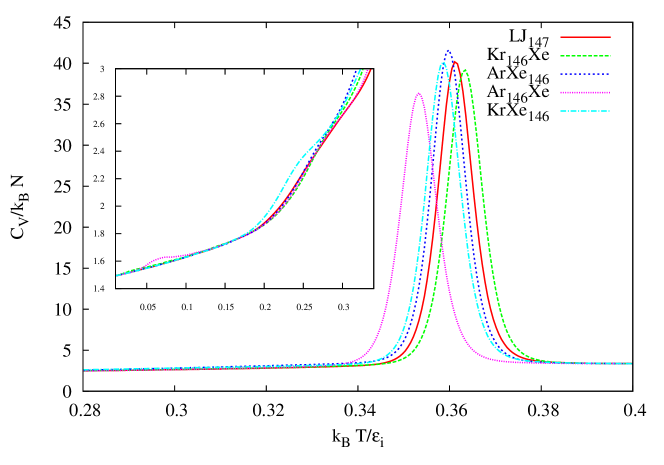
cluster. Yet as is seen in figures 3 and 4
the peak changes, not only its position but also its height and width, for some
compositions. For instance, for Ar146Xe, the change in height with respect
to Ar147 is noticeable although the displacement of the maximum is just
around 1%. Other characteristic of the that is modified by
the presence of the dopant atom is the occurence of a small peak or bump in
the low temperature region. As we will demonstrate in section III.3, for
the clusters with sizes (), this is due to a solid-solid
transition. Some general trends for compositions ArXeN-1 and KrXeN-1
() are: Regarding their lowest energy configurations,
each pure XeN cluster and the doped ArXeN-1 and KrXeN-1 clusters
have the same symmetry group (), and are also very close in
geometry. After a small temperature increase, the dopant atom in both
ArXeN-1 and KrXeN-1 behaves the same way. It starts to move from the
the center of the cluster in the lowest energy configuration, to the second
most energetically favorable position, in the outer shell of the cluster, as
seen in the first two rows of figures 5, 6,
7 and 8. A pictorical representation of the
process is given in figure 10. Nevertheless, excepting for the
smallest cluster size, , the dopant atom never relocalizes completely in
a stable configuration different from the global minimum, this occurs because
for larger structures there is more than one icosahedral stable
structure in which the dopant atom is located in the outer shell of the
clusters. To support this, see in figure 9 that, excepting for
the cases ArXe12 and KrXe12, the standard
deviation of the position of the dopant atom () is always an increasing function of the
temperature, until the cluster melts. The bottom rows in figures
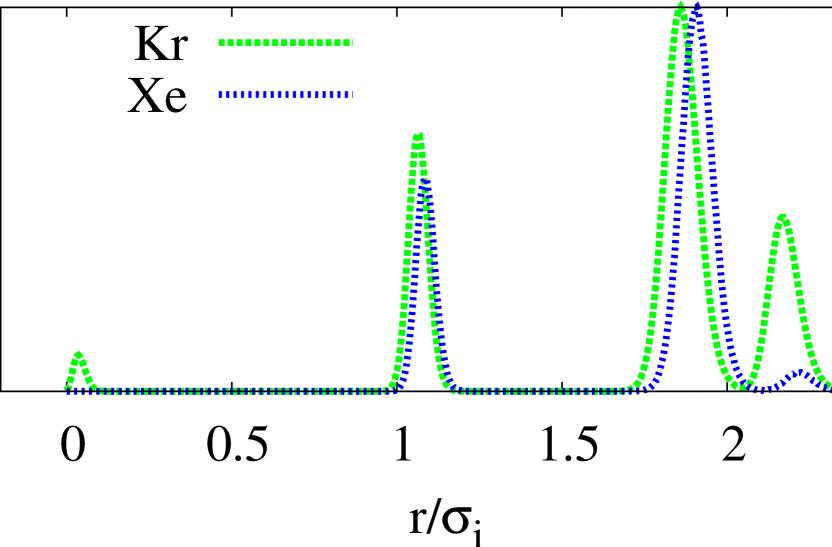
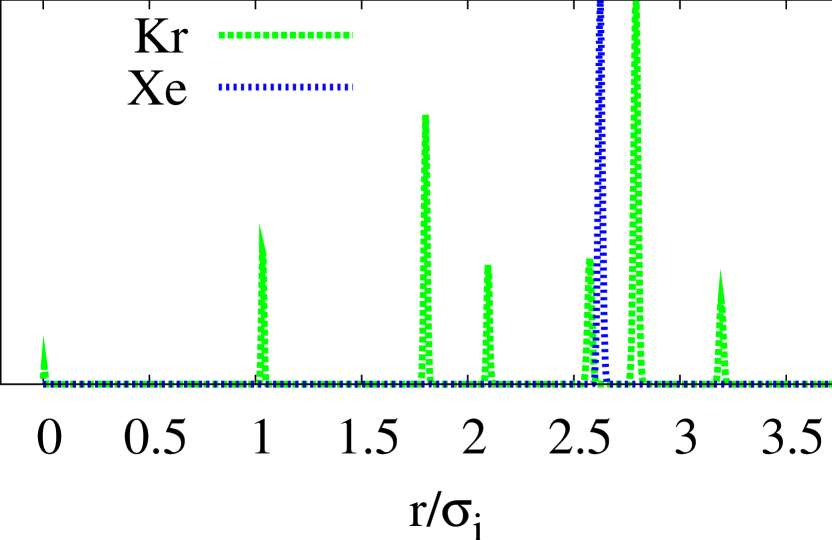
5, 6, 7 and 8 show that
upon melting, the RDFs of the matrix and the dopant
show the same structure. This indicates that, in the liquid phase, and for the
compositions studied, Ar and Kr are not segregated by the Xe matrix.
Finally, as one would expect based on the similarities of their LJ parameters,
the Xe-Kr doped clusters show more resemblance to the pure cluster in their
curves.
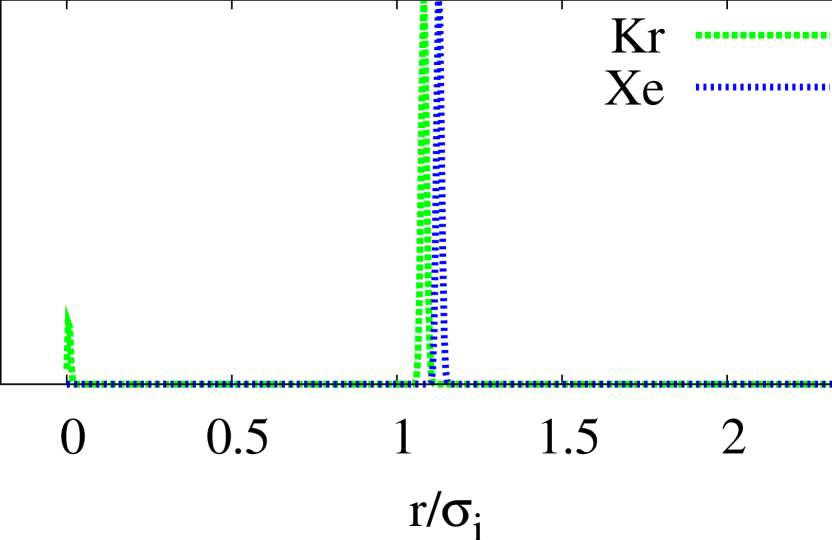
The clusters KrN-1Xe are the ones that show a more similar behavior to
the pure clusters LJN, considering their curves. For these
compositions the standard deviation of the position of the dopant atom
() is always an increasing function of the temperature (see figure
9). This implies that the Xe atom does not leave completely its
external shell location, as in the lowest energy configuration (see the fourth
column on Table 1). Such configuration plays a significant
role in the thermodynamics of the system until the phase change. This can be
seen on the RDFs of Xe in the KrN-1Xe clusters,
as plotted in the fourth column of figures 5, 6,
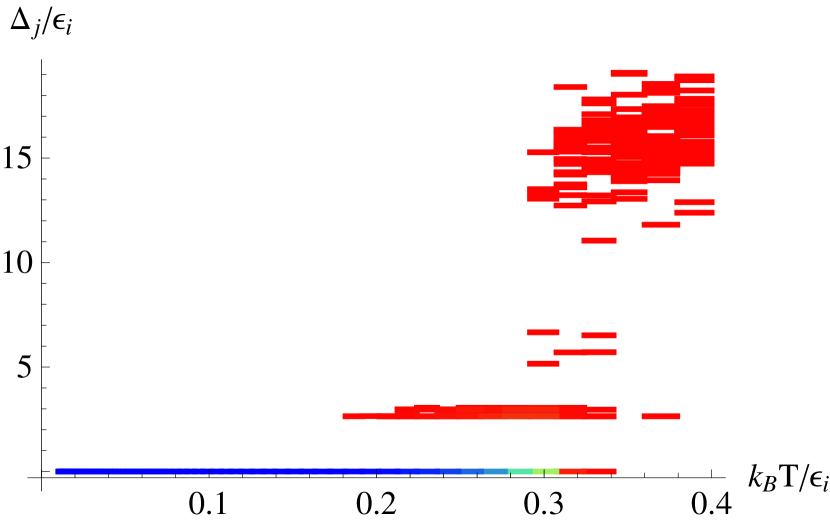
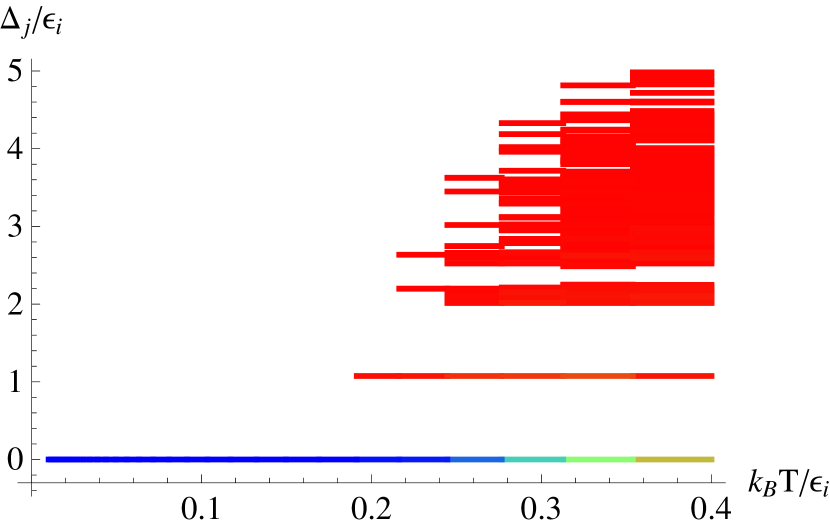
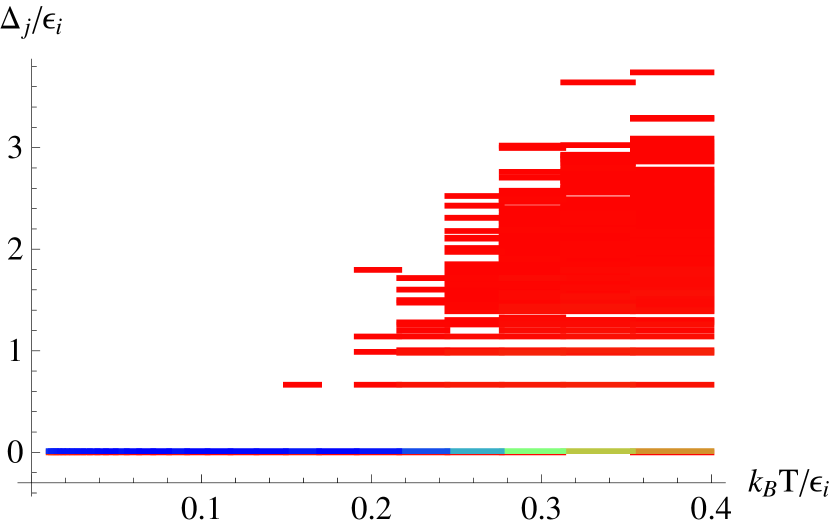
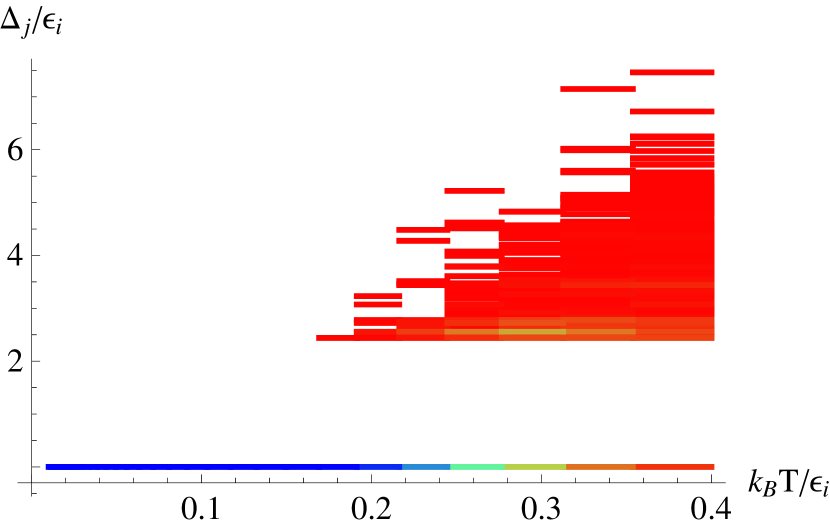
7 and 8. Also, on the spectra of quenched energies
of Kr12Xe and Kr54Xe, in figures 11 and
12. The shape of for KrN-1Xe is
qualitatively different depending on the cluster size , indicating that the
temperature ranges for the migration of the dopant atom and the melting of the
cluster overlap for the smaller sizes. For , simply increases
once the cluster starts to melt. For , the dopant atom starts to
delocalize smoothly between the second and first shells, until the migration
is met by the melting of the cluster (see the last column on figure
6). For the largest structures Kr146Xe and Kr308Xe the
dopant atom migrates to several positions in different shells of the
structure, as seen in the last column of figures 7 and
8. Upon melting, these compositions show the same behavior
observed in ArXeN-1 and KrXeN-1 , i.e. there is no
segregation between the Kr atoms and the Xe atom of the cluster. The
composition that shows more features during the heating process is
ArN-1Xe. The largest doping effect is seen in the cluster Ar12Xe.
For this cluster we see that the melting temperature (taken as the position of
the maximum in the curve) drops by around , which is around of the melting temperature of the
pure cluster.
A comparable change in the melting point occurs for Ar54Xe with respect
to Ar55. This is not the only feature that changes drastically when
replacing one atom, with respect to the melting of Ar55. From figure
3 it is also seen that the melting peak in the curve
for the doped cluster is smaller, by almost a factor of 2, as compared
with the pure cluster, in other words the latent heat associated with the melting
is smaller in the doped cluster.
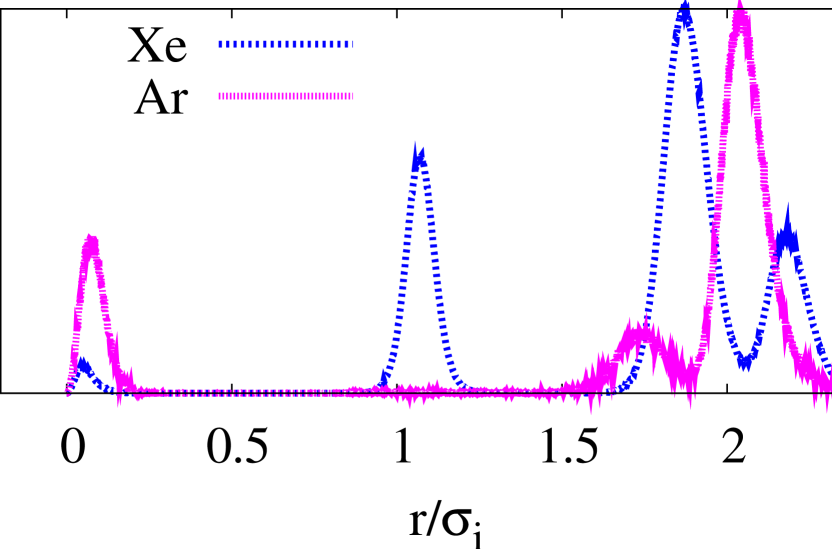
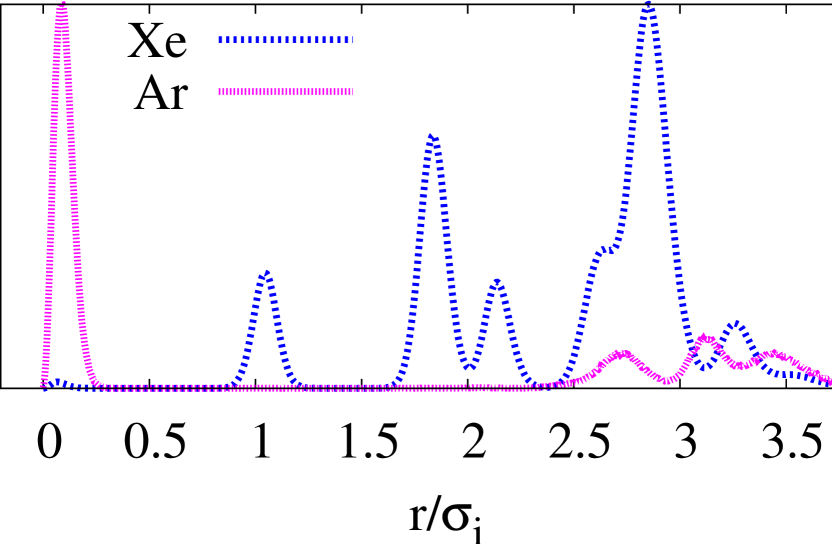
The reduction in the latent heat is a feature present in all the Argon clusters,
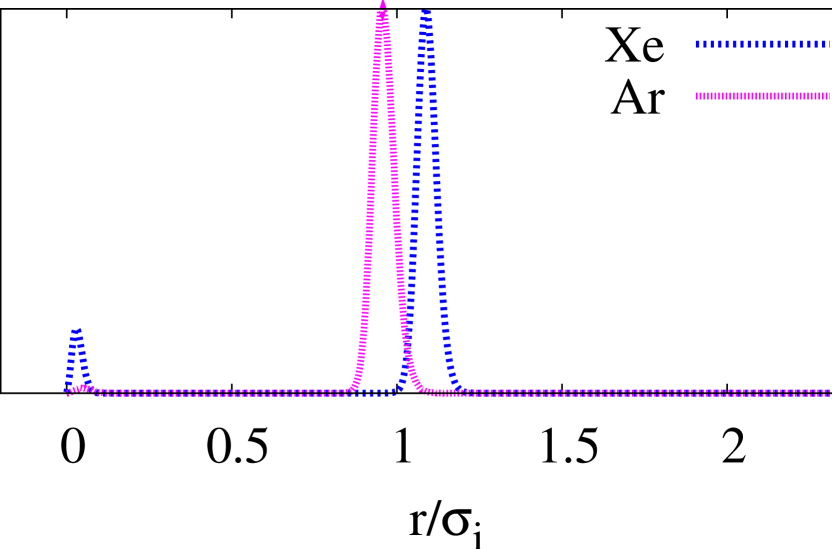
doped with Xenon. For the case of Ar54Xe two different transitions are
seen in the RDF, , of the dopant atom (see the
third column of figure 6). These transitions are seen in the
non-monotonous behavior of the standard deviation of the position of the Xe
atom in figure 9b. In the first transition the Xe atom
migrates
from the outer shell to the inner shell, and remains there. As it was mentioned in the last
section, this causes a small bump in the curve. Then, as the temperature is
further increased, the atom starts to migrate between the center of the cluster, the first
shell and the outer shell. This occurs near the temperature range for the
phase change. Finally, when the cluster reaches the liquid-like phase
an interesting effect occurs, namely the Xe atom is segregated from the Ar atoms. This is
clearly seen in the last row of figures 5, 6,
7 and 8. We note that, for all the cases studied, the segregation is related to a maximum size contrast
between the impurity and other atoms in the cluster.
| Cluster | P. Group | |||||
|---|---|---|---|---|---|---|
| 2nd state | ||||||
| Kr12Xe | 2.02627 | 1.47523 | 11.622 | 9.8675 | 0.50598 | |
| ArXe12 | 0.04162 | 0.02247 | 12.777 | 11.826 | 0.00446 | |
| Ar12Xe | 3.46358 | 3.46358 | 11.349 | 6.4721 | 0.21580 | |
| KrXe12 | 0.87796 | 0.47406 | 13.136 | 12.208 | 0.09668 | |
| Kr54Xe | 0.63580 | 0.46289 | 13.032 | 12.844 | 0.15423 | |
| ArXe54 | 2.79753 | 1.51055 | 14.374 | 13.954 | 0.19544 | |
| Ar54Xe | 1.15348 | 1.15348 | 12.544 | 11.919 | 0.14918 | |
| KrXe54 | 2.53307 | 1.36775 | 14.307 | 14.019 | 0.21457 | |
| Ar146Xe | 0.36404 | 0.36404 | 13.519 | 13.381 | 0.08944 |
III.3 Low behavior
One of the most interesting features of the calculations presented in
figure 3 and 4 is the occurence of a second
small peak, not seen in the pure clusters, for some of the doped structures. The most
noticeable case being that of KrXe12. Such peak has been associated with
a solid-solid transition, and studied in detail for rare gas clusters of
6White et al. (2005) and 13
Frantz (1996, 1997); Sabo et al. (2004a, b); Munro et al. (2002) atoms. It has
been suggested
Frantz (1996, 1997); Sabo et al. (2004a, b); Munro et al. (2002); White et al. (2005) that this
bump is due to structural transitions between isomers of the same
composition. We reach the same conclusion via an analysis of around 1000
structures, which we sampled, for each replica and each composition in
clusters with up to 147 atoms. We later quenched those structures.
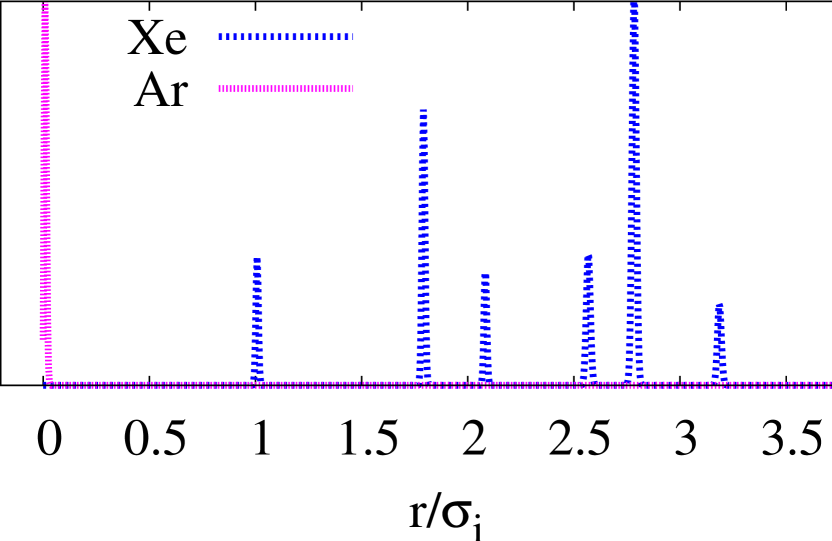
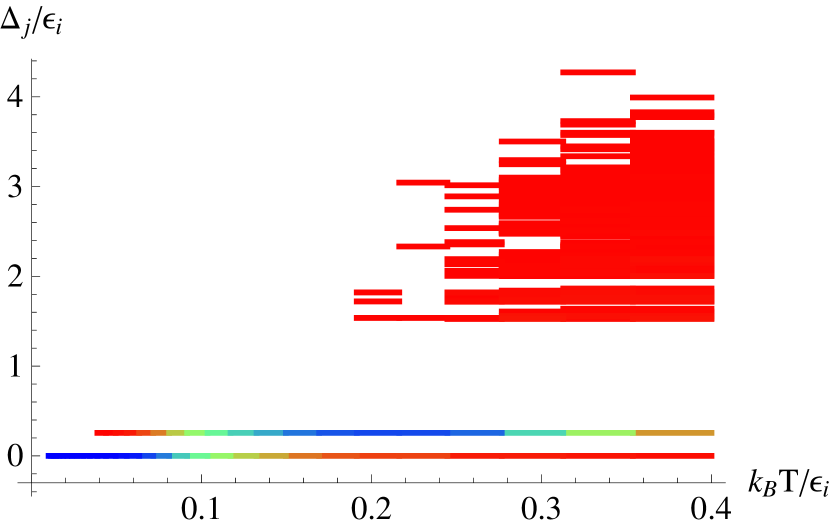
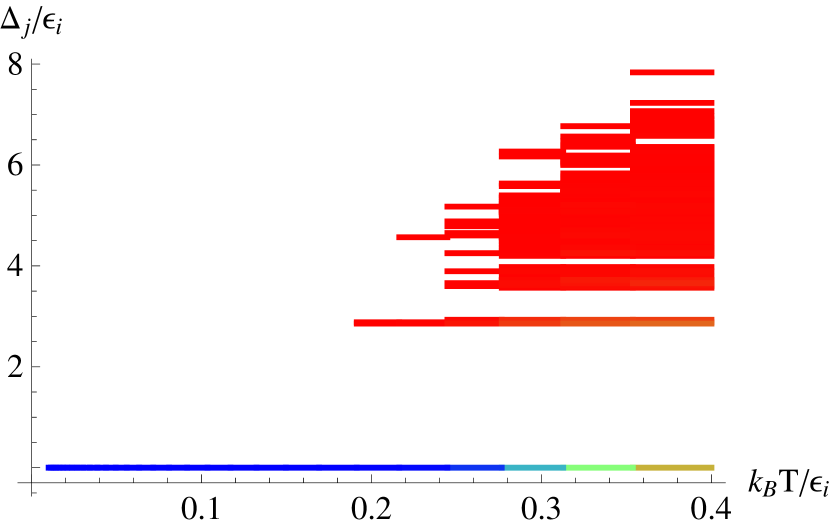
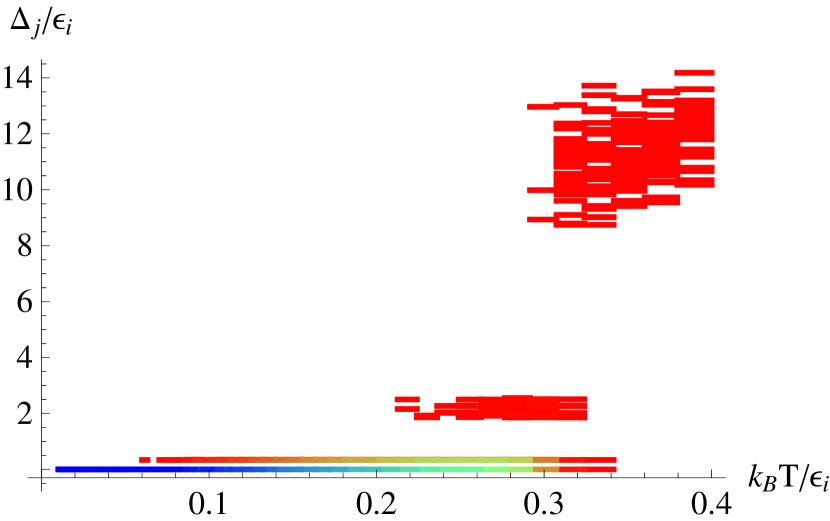
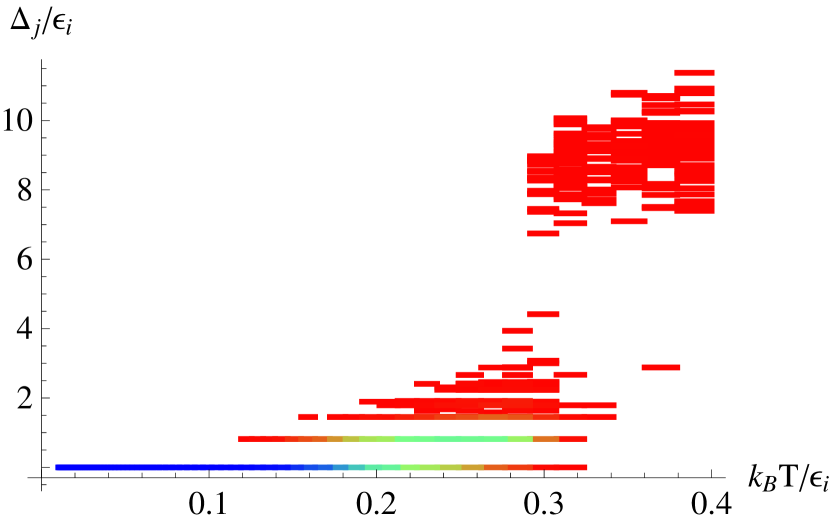
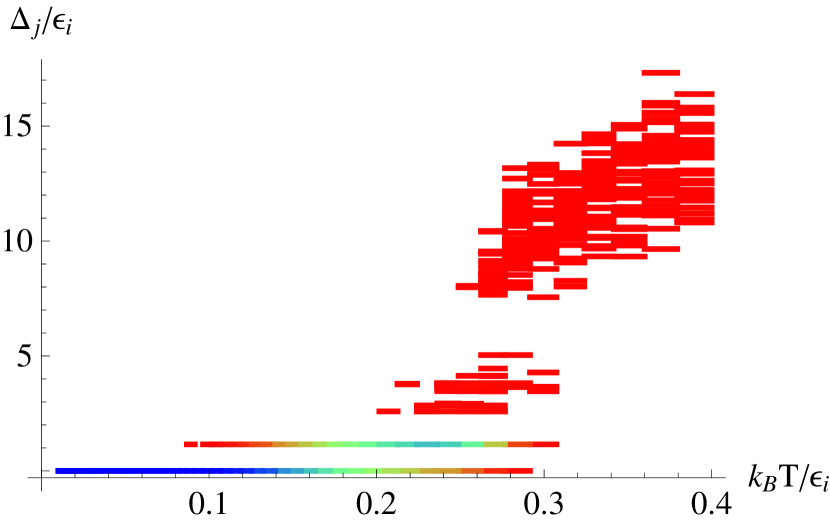
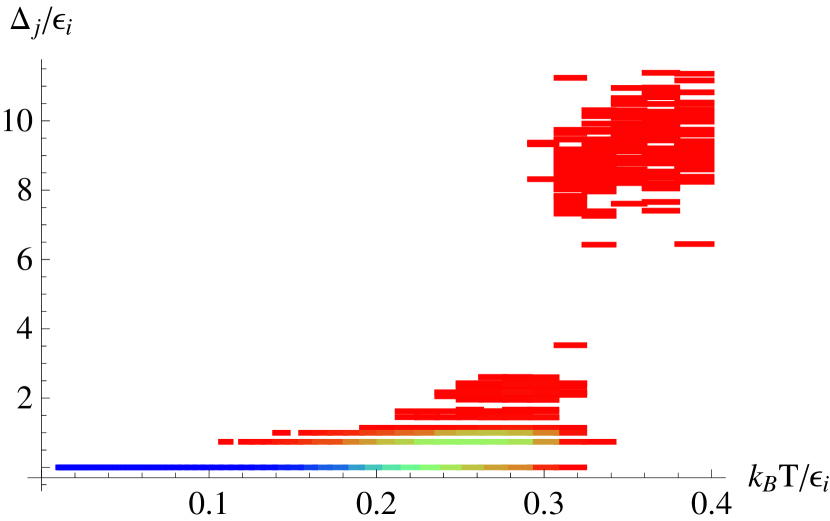
The energies and relative sampling frequencies of the set of minima obtained
for each composition are presented in figures 11 and
12. From these figures we note that the extra peak correlates
extremely well with the appearance of a second stable structure that becomes
increasingly important until the cluster melts. This second structure
corresponds to an icosahedron in which the dopant atom swaps positions with an
atom in a different shell.
To further support our conclusion we have performed Harmonic Superposition
Method (HSM) calculations for some compositions. The input values used in the
HSM calculations are shown in the first six columns of Table
3.
In the last column of the same table, we show the results (i.e. the
predicted temperature for the solid-solid change asociated with the transition
between the two minima ). The predicted temperatures agree well with those
obtained from the PTMC simulations in figures 3, and
4. The Table 3 also shows why the extra peak
is not present in all clusters. For Kr12Xe, Ar12Xe and Kr54Xe,
as can be seen in the insets of figure 3, the temperature of
the solid-solid transition is so close to the melting peak, that when the
structure can change to a different minima it has started to sample “liquid
like” configurations.
IV CONCLUSIONS
PTMC simulations for rare gases (LJ) doped clusters with up to 309 atoms showed that a single atom impurity can cause doping effects such as the depletion of the melting range (with respect to the pure cluster), and the occurence of a solid-solid transition in the low temperature range 111The curve of LJ309 shows considerably large peaks in the temperature range . These have been studied in detail by Noya and DoyeNoya and Doye (2006). They point out that prior to the melting there is complex structural transformation involving several processes such as surface roughening and the formation of structures with diverse symmetries.. The shifting of the melting range due to the presence of the single atom impurity decreases with increasing cluster size. In terms of absolute temperature it is noticeable for clusters with less than a 100 atoms, for instance for Ar54Xe it represents 3.4 K. Several criteria (i.e. curves, radial distribution functions, spectra of quenched energies, and HSM) have been used to support that a solid-solid transition peak may arise for doped clusters with up to 147 atoms.
Acknowledgements.
We thank Fundación para la Promoción de la Investigación y la Tecnología del Banco de la República and Universidad de Antioquia for Financial support, CRESCA-SIU for computational resources. We also thank F. Calvo for helpful discussions and for providing the multihistogram method computer code.References
- Ferrando et al. (2008) R. Ferrando, J. Jellinek, and R. L. Johnston, Chemi. Rev. 108, 845 (2008).
- Baletto and Ferrando (2005) F. Baletto and R. Ferrando, Rev. Mod. Phys. 77, 371 (2005).
- Doye et al. (1998) J. P. K. Doye, D. J. Wales, and M. A. Miller, J. Chem. Phys. 109, 8143 (1998).
- Calvo and Spiegelmann (2000) F. Calvo and F. Spiegelmann, J. Chem. Phys. 112, 2888 (2000).
- Chen and Johnston (2007) F. Chen and R. L. Johnston, ACS Nano 2, 165 (2007).
- Noya and Doye (2006) E. G. Noya and J. P. K. Doye, J. Chem. Phys. 124, 104503 (2006).
- Duan et al. (2007) H. Duan, F. Ding, A. Rosén, A. R. Harutyunyan, S. Curtarolo, and K. Bolton, Chemical Physics 333, 57 (2007).
- Wautelet (1991) M. Wautelet, J. Phys. D: Appl. Phys. 24, 343 (1991).
- Vallée et al. (2001) R. Vallée, M. Wautelet, J. P. Dauchot, and M. Hecq, Nanotechnology 12, 68 (2001).
- Shvartsburg and Jarrold (2000) A. A. Shvartsburg and M. F. Jarrold, Phys. Rev. Lett. 85, 2530 (2000).
- Mottet et al. (2005) C. Mottet, G. Rossi, F. Baletto, and R. Ferrando, Phys. Rev. Lett. 95, 035501 (2005).
- Hock et al. (2008) C. Hock, S. Straßburg, H. Haberland, B. v. Issendorff, A. Aguado, and M. Schmidt, Phys. Rev. Lett. 101, 023401 (2008).
- Doye and Meyer (2005) J. P. K. Doye and L. Meyer, Phys. Rev. Lett. 95, 063401 (2005).
- Calvo and Yurtsever (2004) F. Calvo and E. Yurtsever, Phys. Rev. B 70, 045423 (2004).
- Topper et al. (2003) R. Topper, D. Freeman, D. Bergin, and K. LaMarche, Rev. Comput. Chem. 19, 1 (2003).
- Frantsuzov and Mandelshtam (2005) P. A. Frantsuzov and V. A. Mandelshtam, Phys. Rev. E 72, 037102 (2005).
- Earl and Deem (2005) D. J. Earl and M. W. Deem, Phys. Chem. Chem. Phys. 7, 3910 (2005).
- (18) D. Wales, J. Doye, A. Dullweber, M. Hodges, F. Naumkin, F. Calvo, J. Hernández-Rojas, and T. Middleton, The cambridge cluster database, URL http://www-wales.ch.cam.ac.uk/CCD.html.
- Wales and Doye (1997) D. J. Wales and J. P. K. Doye, J. Phys. Chem. A 101, 5111 (1997).
- Ferrenberg and Swendsen (1989) A. M. Ferrenberg and R. H. Swendsen, Phys. Rev. Lett. 63, 1195 (1989).
- Labastie and Whetten (1990) P. Labastie and R. L. Whetten, Phys. Rev. Lett. 65, 1567 (1990).
- Amar and Berry (1986) F. G. Amar and R. S. Berry, J. Chem. Phys. 85, 5943 (1986).
- Doye and Calvo (2001) J. P. K. Doye and F. Calvo, Phys. Rev. Lett. 86, 3570 (2001).
- Pahl et al. (2008) E. Pahl, F. Calvo, L. Koccaroni, and P. Schwerdtfeger, Angew. Chem. Int. Ed. 47, 8207 (2008).
- White et al. (2005) R. P. White, S. M. Cleary, and H. R. Mayne, J. Chem. Phys. 123, 094505 (2005).
- Frantz (1996) D. D. Frantz, J. Chem. Phys. 105, 10030 (1996).
- Frantz (1997) D. D. Frantz, J. Chem. Phys. 107, 1992 (1997).
- Sabo et al. (2004a) D. Sabo, J. D. Doll, and D. L. Freeman, J. Chem. Phys. 121, 847 (2004a).
- Sabo et al. (2004b) D. Sabo, C. Predescu, J. D. Doll, and D. L. Freeman, J. Chem. Phys. 121, 856 (2004b).
- Munro et al. (2002) L. J. Munro, A. Tharrington, and K. D. Jordan, Comput. Phys. Commun. 145, 1 (2002).

a)
 b)
b)
a)
 b)
b)
ArXe12
KrXe12
Ar12Xe
Kr12Xe
ArXe54
KrXe54
Ar54Xe
Kr54Xe
ArXe146
KrXe146
Ar146Xe
Kr146Xe
ArXe308
KrXe308
Ar308Xe
Kr308Xe
a)
b)
c)
d)
ArXe54 (A)
ArXe54 (B)
Kr12Xe
ArXe12
Ar12Xe
KrXe12
LJ13
Kr54Xe
ArXe54
Ar54Xe
KrXe54
LJ55