2: Center for Integrated Nanotechnologies, Los Alamos National Laboratory, Los Alamos, New Mexico 87545, USA
3: Department of Physics, Penn State University, University Park, Pennsylvania 16802, USA
4: Department of Physics, Washington University, St. Louis, Missouri 63160, USA
11email: graf@lanl.gov
The glassy response of double torsion oscillators in solid 4He
Abstract
Single and double torsion oscillators have been used to measure the anomalous change in resonant frequency and accompanying dissipation in solid 4He. We present a glass description of the mechanical anomalies found in torsion oscillator measurements. Our results show that it is not necessary to invoke a supersolid interpretation to explain these mechanical anomalies. Previously, we demonstrated that the back-action of a glassy subsystem present in solid 4He can account for frequency change and dissipation peak in single torsion oscillator experiments. Here, we show that the same glassy back-action can explain the experimental results of the composite torsion oscillator developed by the Rutgers group, which measures the response of solid 4He at the in-phase mode Hz and out-of-phase mode Hz.
Keywords:
solid helium, supersolid, glass, torsion oscillatorpacs:
67.80.B-, 67.80.bd, 64.70.P-1 Introduction
The controversy over the origin of the anomalous low-temperature signature in solid 4He continues since it was first discovered in ultrasound measurements by Goodkind and collaborators1, 2, 3 and eventually detected in torsion oscillator (TO) experiments by Kim and Chan.4, 5 In earlier work, we argued that the origin of the TO anomaly is not that of a non-classical rotational inertia effect (NCRI), but rather due to a mechanical effect. We examined the response of a nonuniform solid with defects leading to transient elastic dynamics at high temperatures.6, 7, 8, 9, 10 These defects are quenched at lower temperatures leading to increased mechanical stiffness and hence increased rotational speed of the TO. Furthermore, a nonuniform solid with a small concentration of defects can explain the maximal damping at the crossover temperature where the putative NCRI was reported. Our defect-based scenario is quite simple. At high temperatures, the transient dynamics is very rapid relative to the time scale set by the TO, while at temperatures far lower than the putative supersolid transition, the transient dynamics is much longer. As in classical damped oscillators, when the transient dynamics due to internal dissipation matches the impedance of the external driving force, the dissipation peaks.
A “freezing” between a high-temperature dynamic state and a low-temperature immobile state may be characterized by either (i) a discontinuous first order or continuous transition in annealed systems with no disorder or (ii) an observed dynamic crossover in amorphous systems with disorder (spin-glass) or self-generated quenched disorder due to rapid cooling (as in structural glasses). Freezing of rapid degrees of freedom can be triggered by a distribution of activation barriers; as we will briefly review below, activated dynamics corresponds to a particular choice of the relaxation time for glasses. Such a distribution of barriers also lies at the heart of theories describing insulating “electron glasses” in which electrons are pinned by disorder. 11 Some theories of structural glasses assume that there is no true glass “transition”, but rather a dynamic crossover at which the relaxation time becomes long relative to experimental time scales. Yet other theories assume that an ideal glass exists in the thermodynamic limit but that, experimentally, it is largely inaccessible by divergent equilibration times. Notwithstanding the lack of consensus on the origin of universal slow dynamics in numerous amorphous systems, the increase in observed relaxation times is due to pinning or freezing of some form of degrees of freedom that are dynamic at high temperature. 12
Several theories of glasses assume that elastic defects can entangle and become pinned and consequently form a sluggish state at low temperatures. 13 An early theory of defect dynamics investigated the consequences of a low-temperature pinning of dislocations.14 Although, as emphasized above, the underlying mechanism of low temperature dynamics in these amorphous systems is not universally agreed upon, their empirical behavior has precise universal features, 15 which we employ here. Salient features of amorphous systems that are pertinent to our study include:
A nearly universal Vogel-Fulcher-Tammann (VFT) form describing the increase in relaxation time of glasses as temperature is lowered. The VFT form has been used to fit data collected from many glasses, although it has no unique theoretical basis. Specifically, the VFT expression includes activated (Arrhenius) dynamics () dominated by energy barriers . Thus, the general VFT analysis that we employ includes the specific case of such activated dynamics; this particular case was discussed in our earlier fits to the TO data. 6 Indeed, activated dynamics triggered by pinning of defects (dislocations) may occur in solid 4He. 16 Similarly, increased dynamics relative to an activated form () suggests an increase in motion due to quantum fluctuations.
The activated dynamics in amorphous systems is characterized by a broad distribution of relaxation times. The empirical response functions, which capture this distribution, are consequently of the Davidson-Cole or Cole-Cole form which we invoke in our analysis.
Omni-present memory effects and hysteresis are particularly important in these systems and characterize the observed dynamic crossover including “aging” behavior.17, 18, 19 Such memory effects are of current technological importance. 20
Finally, low-temperature specific heat contributions that scale linearly with temperature in insulators have been key indicators for glassiness.21, 22
It is important to emphasize that our approach assumes that only a small glass-like fraction present in solid 4He exhibits a freezing transition of a high-temperature mobile component with a distribution of relaxation times. 6 Since we first proposed a nonsupersolid interpretation, several other disorder-based theories have been put forward to explain the large dissipation seen in torsion oscillator or shear modulus experiments. Yoo and Dorsey proposed that solid 4He displays viscoelastic properties.23 Syshchenko et al.24, 25 and Iwaza26 argued that the shear modulus measurements can be understood in terms of dislocation motion and the formation of a low-temperature dislocation network based on the theory by Granato and Lücke.14 All these models have in common disorder, but do not require glassiness. Similarly, Syshchenko25 speculated that the observed dissipation peak is associated with boiling off of 3He atoms from dislocation lines. The 3He unbinding causes a depinning with increasing temperature that generates a distribution of mobile dislocation lines responsible for softening of the shear modulus and increased dissipation. Very recently, Reppy27 reported a nonsupersolid scenario in TO experiments, where induced disorder affected primarily the high-temperature response above the putative supersolid transition. A result consistent with the dynamics of highly disordered or glassy systems. So far attempts to offer a unified picture within elasticity theory of uniform solids, i.e., how applied shear stresses affect torsion oscillators and elastic coefficient measurements, have been unsuccessful.24, 29, 30 This may be due to a neglect of anelastic contributions in these approaches.
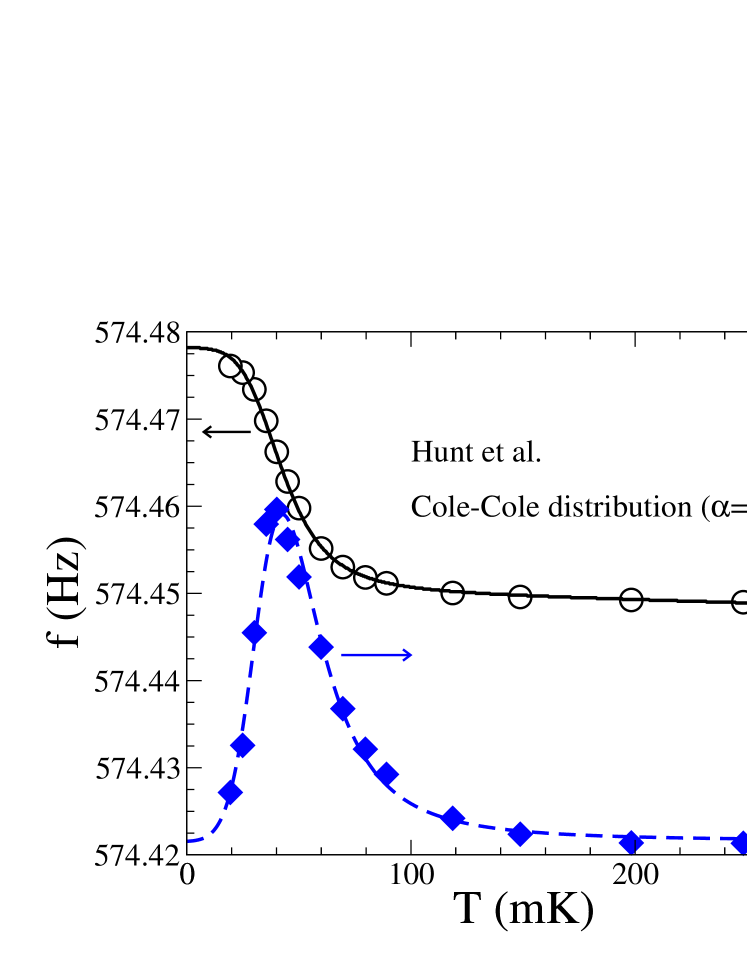
Since a true phase transition is a bulk effect of the sample, we investigated previously thermodynamic signatures as reported by specific heat and pressure measurements.31, 32, 33, 34, 35 Our thermodynamic analysis in terms of two-level systems is consistent with a glassy interpretation of the linear- dependence in the specific heat below mK and the quadratic- dependence in pressure measurements of the equation of state, , of an otherwise perfect Debye solid.16, 36 A Debye solid exhibits a specific heat and a pressure dependence . It is notable that the associated excess entropy is at least three orders of magnitude too small to explain an NCRI effect of a couple of percent in the TO experiments if it is caused by uniform Bose-Einstein condensation.16, 36 Finally, we demonstrated previously that single torsion oscillators can be described by using a distribution of glassy relaxation times, for example, the well-known Cole-Cole distribution. In Fig. 1 we show excellent agreement between model calculations for a glassy back-action and the data by Hunt and coworkers for a single TO.28 Details of the model have been described in Ref. 8 The important message of this comparison is that 100% of the TO signal can be ascribed to a glassy back-action response of mechanical origin with no need for a supersolid component.
Here we focus on the TO experiments reported by Aoki and coworkers.37, 38 The unique design of two coupled torsion oscillators has opened up a window in frequency space to explore the dynamic response of solid 4He at two very different frequencies. However, these measurements have been difficult to explain within a supersolid or glassy scenario alike. In the past, these difficulties have been used as arguments against a glassy interpretation.37, 38, 29 The composite design allowed for the measurement of an in-phase, Hz, and out-of-phase, Hz, resonant frequency on the same solid 4He sample. Surprisingly, the observed changes in frequency and dissipation as a function of temperature showed that the relative magnitude in frequency shift, , is nearly frequency independent. At the same time, the dissipation peak shifted only slightly to higher temperatures at the higher frequency. These observations are contrary to the standard theory of supersolidity, with the hallmark of dissipationless superflow of vacancies or interstitials. Even when invoking a vortex picture for supersolidity to account for the anomalously large dissipation, it fails to account for the unchanged relative shift in resonant frequency , which is a direct measure of the NCRI. Any theory of superfluidity predicts that the superfluid fraction is more rapidly destroyed when perturbed at higher frequency. This is certainly at odds with the experiments by Aoki and coworkers and deserves more attention. Simply extrapolating results of the single TO to higher frequencies fails to explain the experiments. The puzzle is how to explain the outcome of the composite double TO experiment.
In this paper, we present an interpretation of these measurements using a glassy back-action term in the response function of the double TO similar to our earlier work for the single TO. We provide a consistent interpretation and modeling of the composite double TO within the glassy framework, where we postulate the presence of a glassy subsystem in solid 4He. We descibe the experiments by Aoki in terms of two coupled mechanical torsion oscillators, shown schematically in Fig. 2. Our model can explain the measurements, though requires anomalous damping and a strongly frequency dependent glass term. Note that anomalous damping is already required for the empty cell (no 4He present!) to explain that the quality factor of the high mode is lower than of the low mode at 0.3 K, its origin may be due to anelasticity or non-rigid connections between the torsion rod or to a nonlinear feedback of the capacitive drive onto the dummy bob. Additionally, our results point toward 4He slipping at the container walls of the cylindrical pressure cell consistent with the very small, frequency-independent relative shifts .
2 A model for the coupled double oscillator
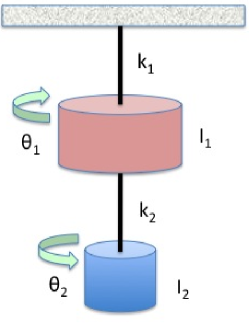
We model the coupled double torsion oscillator of the Rutgers group, sketched in Fig. 2, by the following system of equations for the torsion angles:
| (1) |
where are torsion angles, are damping coefficients, are torsion rod stiffnesses, is the glass back-action term, and is the applied external torque. The subindex “” refers to the upper or dummy bob in the experiment, while “” refers to the lower oscillator with the pressure cell that can be loaded with solid 4He. After Fourier transformation of Eq. (2), we obtain
| (2) |
For a strongly underdamped oscillator and a small glassy back-action, it suffices to solve first for the bare resonant frequencies and later include perturbatively damping and glass terms. The bare resonant frequencies () are
| (3) |
Next, we expand the system of equations in (2) around the bare resonant frequencies (3) by inserting and solving the secular equations for
| (4) |
where we introduced ancillary functions for compactness of notation
| (5) | |||||
| (6) | |||||
| (7) |
It is now straightforward to calculate the resonant frequencies and dissipation of the loaded oscillator
| (8) | |||||
| (9) |
At high temperatures, where and the dissipation is given by
| (10) |
Since the empty pressure cell shows significant temperature dependence in its response, we follow the experimental analysis and subtract the -dependent empty cell response and correct for the differences due to the small difference in . Hence, we compare against corrected shifts relative to a high-temperature value, e.g., at 300 mK,
| (11) |
Within our notation we find that approximately .
Our model of the coupled composite oscillators can describe the temperature behavior of the Rutgers experiment if we make further assumptions about the glassy back-action . We model the dynamics of the glassy subsystem by
| (12) |
Here the glass term is and the Vogel-Fulcher-Tammann relaxation time is for . is the ideal glass transition temperature, which is below the temperature where the peak in dissipation occurs. The parameter is an average potential barrier of the glass. Finally, at temperatures the glassy subsystem freezes out and becomes infinite.
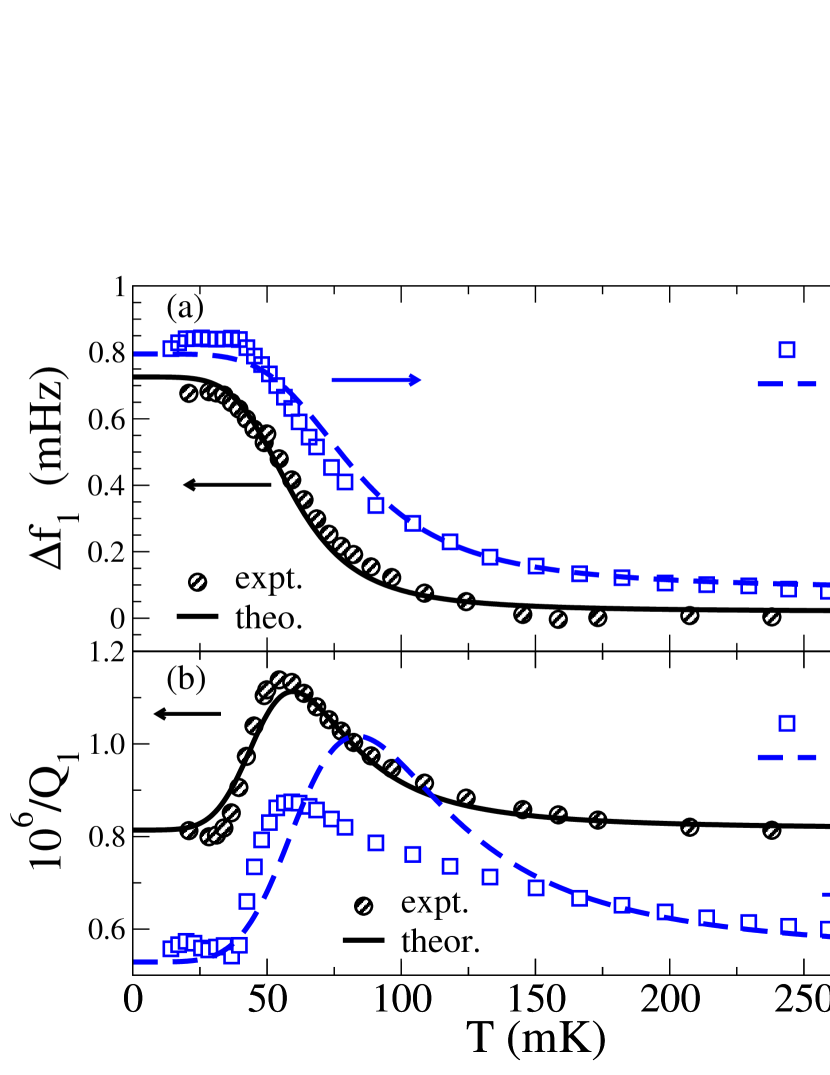
The parameters and can be determined from the bare resonant frequencies in Eq. (3). In addition, the damping coefficients can be extracted from the high-temperature dissipation . Finally, the glassy back-action with its parameterization accounts through for the temperature dependence of and . Our phenomenological glass theory, applied to the coupled double oscillator, explains both frequency shift and dissipation peak for in-phase and out-of-phase torsional response.37 Data for in-phase frequency Hz and out-of-phase Hz are shown in Fig. 3, plotted against the temperature. The data are found to be well described by our model of coupled oscillators presented in Eq. (2) with model parameters: nNs2, nNs2, N, N, nNs, nNs, N, s, mK, mK, , . The obtained values for moment of inertia and rod stiffness agree well with estimates for moments of inertia and BeCu rods.38 At the highest measured temperatures, where the glassy contribution is small, these parameters result in resonant frequencies Hz, Hz and dissipation , in excellent agreement with experiment. The experimental values are Hz, Hz and , .
It is worth pointing out that an anomalous damping coefficient is needed to explain the anomalous behavior of increased dissipation with increased frequency. Note that this anomalous damping is already required to describe the unloaded pressure cell, so it is unrelated to the properties of solid 4He. After loading the cell with solid 4He the dissipation ratio becomes at 300 mK with frequency ratio . A negative is indicative of strong quantum fluctuations leading to an avoided glass transition. This behavior resembles that of a paramagnetic system with a negative Curie-Weiss temperature in the presence of antiferromagnetic fluctuations. It will be interesting to see if the zero-point motion of 4He is indeed responsible for this behavior.
Finally, the comparison in Fig. 3 shows that an explicit frequency-dependent back-action must be used with and to account for the experimental fact of , i.e., the relative frequency shift remains unchainged with changing resonant frequency. In the past, when we studied single oscillators, it sufficed to parameterize by the single resonant frequency, namely, .
It will require further studies to sort out whether the negative damping is related to an anelastic or non-rigid torsion rod or nonlinear feedback from the external drive. Notice that the combined oscillator system is underdamped and dissipates energy with . On the other side, a frequency exponent of in the glass term points toward slip of solid 4He at the cylindrical container wall. Theories describing solid 4He in torsion oscillators as a viscoelastic material 23 or two-level systems moving through a solid matrix 39, 40, 41 predict an explicit frequency exponent of for the back-action term, when assuming a no-slip boundary condition at the cylindrical container wall. So it is reasonable to expect that the slip of 4He at the container wall will lead to a reduction in the power of the frequency dependence of .
3 Conclusions
For the first time, we present a quantitative explanation of the anomalous frequency and dissipation dependence reported for the double torsion oscillator with cylindrical sample chamber by the Rutgers group invoking glass dynamics. So far these experiments have been at odds with supersolid and glassy interpretations. The conventional single oscillator models fail to account simultaneously for the low and high resonant frequency data. Our studies of the coupled oscillator show that the observed shifts in resonant frequencies and dissipation are in agreement with a glassy back-action contribution in solid 4He if one includes anomalous damping in the dummy bob and explicit frequency dependence of the glassy back-action term. Surprisingly, already the double torsion oscillator with the empty pressure cell requires a negative damping coefficient for the dummy bob to accurately describe frequencies and dissipation at 300 mK. Clearly, more dynamic studies of solid 4He with coupled oscillators are needed to determine the frequency dependence over a larger frequency range and for different cell designs to identify the origin of the anomalous damping and the frequency dependence of the back-action term. It remains to be seen if a quantitative supersolid interpretation of the double oscillator experiment is possible.
Acknowledgements.
We are grateful to H. Kojima and Y. Aoki for explaining their experiments and sharing their data. We like to thank A.V. Balatsky, J.C. Davis, J.M. Goodkind, and S.E. Korshunov for many stimulating discussions. This work was supported by LDRD through the US Dept. of Energy at Los Alamos National Laboratory under contract No. DE-AC52-06NA25396 and by the Center for Materials Innovation (CMI) of Washington University, St. Louis.References
- 1 G. Lengua and J. M. Goodkind, J. Low Temp. Phys. 79, 251 (1990).
- 2 P.-C. Ho, I. P. Bindloss, and J. M. Goodkind, J. Low Temp. Phys. 109, 409 (1997).
- 3 J. M. Goodkind, Phys. Rev. Lett. 89, 095301 (2002).
- 4 E. Kim and M. H. W. Chan, Nature (London) 427, 225 (2004).
- 5 E. Kim and M. H. W. Chan, Science 305, 1941 (2005).
- 6 Z. Nussinov, M. J. Graf, A. V. Balatsky, and S. A. Trugman, Phys. Rev. B 76, 014530 (2007).
- 7 M. J. Graf, A. V. Balatsky, Z. Nussinov, I. Grigorenko, and S. A. Trugman, JPCS 150, 032025 (2009).
- 8 M. J. Graf, Z. Nussinov, and A. V. Balatsky, J. Low Temp. Phys. 158, 550 (2010).
- 9 J.-J. Su, M. J. Graf, and A. V. Balatsky, Phys. Rev. Lett. 105, 045302 (2010).
- 10 J.-J. Su, M. J. Graf, and A. V. Balatsky, preprint arXiv:1007.1937.
- 11 A. Amir, Y. Oreg, and Y. Imry, Annu. Rev. Cond. Mat. Phys., to appear (2011), preprint arXiv:1010. 5767.
- 12 L. Berthier and G. Biroli, arXiv: 1011.2578 (2010)
- 13 D. R. Nelson, Defects and Geometry in Condensed Matter Physics, (Cambridge University Press, Cambridge, 2002).
- 14 A. Granato and K. Lücke, J. Appl. Phys. 27, 583 (1956).
- 15 V. Lubchenko and P. G. Wolynes, Annu. Rev. Phys. Chem. 58, 235 (2007); M. Tarzia and M. A. Moore, Phys. Rev. E 75, 031502 (2007); W. Gotze, J. Phys.: Condens. Matter 11, A1 (1999); J. P. Garrahan, J. Phys.: Condens. Matter 14, 1571 (2002); G. Tarjus, S. A. Kivelson, Z. Nussinov, and P. Viot, J Phys.: Condens. Matter 17, R1143 (2005); T. Park et al., Phys. Rev. Lett. 94, 017002 (2005).
- 16 A. V. Balatsky, M. J. Graf, Z. Nussinov, and S. A. Trugman, Phys. Rev. B 75, 094201 (2007).
- 17 G. Bertotti, Hysteresis and Magnetism for Physicists, Materials Scientists, and Engineers (Academic Press, New York, 1998).
- 18 L. C. Struick, Physical Aging in Amorphous Polymers and Other Materials (Elsevier, Amsterdam,1978).
- 19 A. P. Young (Editor), Spin Glasses and Random Fields, Series on Directions in Condensed Matter Physics, Vol. 12 (World Scientific, Singapore, 1998).
- 20 One example is that of HD-DVD Blu Ray devices that use the optical hysteresis of chalcogenide glasses for data storage.
- 21 P. Esquinazi (Editor), Tunneling Systems in Amorphous and Crystalline Solids (Springer, Heidelberg, 1998).
- 22 C. Enss and S. Huncklinger, Low-Temperature Physics (Springer, Heidelberg, 2005).
- 23 C.-D. Yoo and A. Dorsey Phys. Rev. B 79, 100504(R) (2009).
- 24 J. Day, O. Syshchenko, and J. Beamish, Phys. Rev. B 79, 214524 (2009).
- 25 O. Syshchenko, J. Day, and J. Beamish, Phys. Rev. Lett. 104, 195301 (2010).
- 26 I. Iwasa, Phys. Rev. B 81, 104527 (2010).
- 27 J. D. Reppy, Phys. Rev. Lett. 104, 255301 (2010).
- 28 B. Hunt, E. Pratt, V. Gadagkar, M. Yamashita, A. V. Balatsky, and J. C. Davis, Science 324, 632 (2009).
- 29 A. C. Clark, J. D. Maynard, and M. H. W. Chan, Phys. Rev. B 77, 184513 (2008).
- 30 H. J. Maris and S. Balibar, to appear in J. Low Temp. Phys.
- 31 X. Lin, A. C. Clark, and M. H. W. Chan, Nature 449, 1025 (2007).
- 32 X. Lin, A. C. Clark, Z. G. Cheng, and M. H. W. Chan, Phys. Rev. Lett. 102, 125302 (2009).
- 33 V. N. Grigor’ev, V. A. Maidanov, V. Yu. Rubanskii, S.P. Rubets, E. Ya. Rudavskii, A. S. Rybalko, Ye. V. Syrnikov, and V. A. Tikhii, Phys. Rev. B 76, 224524 (2007).
- 34 V. N. Grigor’ev and Ye. O. Vekhov, J. Low Temp. Phys. 149, 41 (2007).
- 35 E. Y. Rudavskii, V. N. Grigor’ev, A. A. Lisunov, V. A. Maidanov, V. Y. Rubanskii, S. P. Rubets, A. S. Rybalko, and V. A. Tikhii, J. Low Temp. Phys. 158, 578 (2010).
- 36 J.-J. Su, M. J. Graf, and A. V. Balatsky, J. Low Temp. Phys. 159, 431 (2010).
- 37 Y. Aoki, J. C. Graves, and H. Kojima, Phys. Rev. Lett. 99, 015301 (2007).
- 38 Y. Aoki, J. C. Graves, and H. Kojima, J. Low Temp. Phys. 150, 252 (2008).
- 39 A. F. Andreev, JETP Lett. 85, 585 (2007).
- 40 A. F. Andreev, JETP 109, 103 (2009).
- 41 S. E. Korshunov, JETP Lett. 90, 156 (2009).