A HIFI preview of warm molecular gas around Cyg : first detection of H2O emission toward an S-type AGB star ††thanks: Herschel is an ESA space observatory with science instruments provided by European-led Principal Investigator consortia and with important participation from NASA.
Abstract
Aims. A set of new, sensitive, and spectrally resolved, sub-millimeter line observations are used to probe the warm circumstellar gas around the S-type AGB star Cyg. The observed lines involve high rotational quantum numbers, which, combined with previously obtained lower-frequency data, make it possible to study in detail the chemical and physical properties of, essentially, the entire circumstellar envelope of Cyg.
Methods. The data were obtained using the HIFI instrument aboard Herschel, whose high spectral resolution provides valuable information about the line profiles. Detailed, non-LTE, radiative transfer modelling, including dust radiative transfer coupled with a dynamical model, has been performed to derive the temperature, density, and velocity structure of the circumstellar envelope.
Results. We report the first detection of circumstellar H2O rotational emission lines in an S-star. Using the high- CO lines to derive the parameters for the circumstellar envelope, we modelled both the ortho- and para-H2O lines. Our modelling results are consistent with the velocity structure expected for a dust-driven wind. The derived total H2O abundance (relative to H2) is , much lower than that in O-rich stars. The derived ortho-to-para ratio of 2.10.6 is close to the high-temperature equilibrium limit, consistent with H2O being formed in the photosphere.
Key Words.:
Stars: AGB and post-AGB – Circumstellar matter – Stars: kinematics and dynamics – Stars: individual Cyg – Stars: late-type – stars: mass-loss1 Introduction
Observations of the dust and gas components in the circumstellar envelopes (CSEs) around asymptotic giant branch (AGB) stars have been carried out at different wavelengths. Observations in the infrared trace the dust as well as the warm molecular layer close to the stellar photosphere (e.g., Justtanont et al. 1996; Aoki et al. 1999; Schöier et al. 2002). Submillimeter and radio observations of trace molecules have been used to study the cooler outer parts of the CSEs (e.g., Knapp & Morris 1985; Schöier & Olofsson 2000; Kemper et al. 2003). To bridge this gap, the Infrared Space Observatory (ISO) was used to observe a large number of AGB stars up to almost 200 m, and in O-rich stars, a number of H2O emission lines were detected (Barlow et al., 1996; Neufeld et al., 1996). However, the circumstellar far-infrared lines were unresolved. Hence, crucial information about the line profiles remained unknown.
Water is an important molecule in CSEs as it is thought to be one of the main cooling agents in the wind. It is also expected to be a good probe of the inner regions of the CSE where the gas is accelerated. However, to fully explore the potential of H2O lines as a probe of the circumstellar gas, a full radiative transfer has to be performed. Owing to difficulties in calculating accurate collisional rates coupled with the very high optical depth of the H2O lines in the inner region of the CSE, slow progress has been made. Nevertheless, calculations of the heating and cooling in the CSEs of O-rich stars suggest that H2O dominates the cooling in most parts of the envelope until it is photodissociated by interstellar UV photons (Goldreich & Scoville, 1976; Justtanont et al., 1994; Maercker et al., 2008, 2009; Decin et al., 2010a), and that some lines should come mainly from the acceleration zone. Eventually, spectrally resolved circumstellar H2O lines were observed by two space missions dedicated to search for cosmic water line emission: SWAS and Odin. Both missions were able to detect the ground-state line of H2O at 557 GHz in a number of AGB stars (Harwit & Bergin, 2002; Melnick et al., 2001; Justtanont et al., 2005; Hasegawa et al., 2006; Maercker et al., 2009). It was shown that not only the line intensity, but also the line profile is crucial for interpreting the data correctly.
In 2009, the ESA-Herschel Space Observatory (Pilbratt et al., 2010) was launched with the Heterodyne Instrument for the Far-Infrared (HIFI111 HIFI has been designed and built by a consortium of institutes and university departments from across Europe, Canada and the United States under the leadership of SRON Netherlands Institute for Space Research, Groningen, The Netherlands and with major contributions from Germany, France and the US. Consortium members are: Canada: CSA, U.Waterloo; France: CESR, LAB, LERMA, IRAM; Germany: KOSMA, MPIfR, MPS; Ireland, NUI Maynooth; Italy: ASI, IFSI-INAF, Osservatorio Astrofisico di Arcetri- INAF; Netherlands: SRON, TUD; Poland: CAMK, CBK; Spain: Observatorio Astronómico Nacional (IGN), Centro de Astrobiología (CSIC-INTA). Sweden: Chalmers University of Technology - MC2, RSS & GARD; Onsala Space Observatory; Swedish National Space Board, Stockholm University - Stockholm Observatory; Switzerland: ETH Zurich, FHNW; USA: Caltech, JPL, NHSC. , de Graauw et al. 2010), which aims to study H2O line emission in different environments in our Galaxy and beyond. HIFI offers the opportunity to study the warm molecular layers in CSEs of AGB stars in great detail, e.g., the high spectral resolution and wide spectral coverage allow a detailed study of the gas dynamics.
As part of the guaranteed time programme HIFISTARS (P.I.: V. Bujarrabal), the S-star (C/O 1) Cyg was selected for study. Distance estimates range from 150 pc (Knapp et al., 2003) to 180 pc (van Leeuwen, 2007). The star exhibits SiO masers (e.g., Olofsson et al. 1981; Schwartz et al. 1982; Alcolea & Bujarrabal 1992), but no H2O maser emission has been found (Menten & Young, 1995; Shintani et al., 2008). Being nearby and bright, Cyg has been observed using interferometric techniques in both the optical (Lacour et al., 2009) and the infrared (Tevousjan et al., 2004). In this Letter, we briefly describe the observations in Sect. 2, we discuss the modelling of the observed molecular emission in Sect. 3, and present our results and conclusions in Sect. 4.
2 Observations
| Molecule | Transition | (GHz) | (K) | ( K km s-1) |
|---|---|---|---|---|
| CO | =6–5 | 691.473 | 116 | 15.3 |
| CO | =10–9 | 1151.985 | 304 | 13.6 |
| CO | =16–15 | 1841.346 | 752 | 13.5 |
| o-H2O | 1 | 556.936 | 61 | 3.0 |
| p-H2O | 2 | 752.033 | 137 | 4.2 |
| p-H2O | 2 | 987.927 | 101 | 7.3 |
| p-H2O | 1 | 1113.343 | 53 | 8.0 |
| o-H2O | 3 | 1153.127 | 249 | 7.5 |
| o-H2O | 3 | 1162.912 | 305 | 1.5 |
| o-H2O | 3 | 1716.770 | 197 | 18.1 |
Note to the table: aThe absolute calibration accuracy is between 10% to 30% (see text).
The HIFI data were obtained using the dual-beam-switching mode (Roelfsema et al., 2010) with a throw of 3′ and slow (0.5-1Hz) chopping in March-April 2010. A total of 8 frequency settings with a total of 10 lines detected are being reported in this paper. The targeted lines were selected to cover a wide range of excitation temperature, exploring different regions of the CSE. As backend, the wide-band spectrometer (WBS) covering a region of 4 GHz with a resolution of 1.1 MHz was used. More details about these observations can be found in Bujarrabal et al. (2010). The data were calibrated using the standard pipeline for Herschel, HIPE version 2.8. Only the H-polarization data are presented here because the V-polarization data are noisier especially for the high frequency lines. We subtracted the baseline using a first or second order polynomial, except for the H2O transition at 1716 GHz, where this line is affected by standing waves and, consequently, the baseline was fitted using a high order polynomial (see Sect. 3.2).
We detected high rotational transitions of CO as well as the first detection of rotational H2O in an S-star. All of the observed lines listed in Table 1 were detected. The frequency in GHz and the energy of the upper level in K are given along with the integrated line intensity, in K km s-1. The spectra were corrected for the main beam efficiency, i.e., . The absolute calibration accuracy ranges from 10% for the lowest frequency line to 30% for the high frequency ( 1 THz) lines.
3 Modelling HIFI lines
We started the analysis by fitting the spectral energy distribution of the CSE (assumed to be spherically symmetric) using Dusty (Ivezic & Elitzur, 1997) to derive the dust mass-loss rate. Based on this, we solved the gas-dust drag equation, assuming that both are momentum coupled, to derive the velocity structure using the observed terminal gas velocity as a constraint, as shown in Fig. 1. This also provides a so-called dynamical mass-loss rate estimate, 4.9 M⊙ yr-1 in the case of Cyg (see e.g., Ramstedt et al. 2008). The gas velocity law is fed into the CO radiative transfer model, where the line fluxes and shapes are computed and compared to the observations. At the same time, the heating by dust grains and the cooling by CO lines are calculated and the resulting temperature structure obtained (e.g., Justtanont et al. 1994; Crosas & Menten 1997; Decin et al. 2006; van der Tak et al. 2007; Ramstedt et al. 2008). This provides a circumstellar model, including a mass-loss-rate estimate based on the CO line modelling, which is used to model the H2O line emission and its contribution to the cooling. The H2O cooling is then used to recalculate the gas kinetic temperature in the CO model, and the process is iterated until good fits to the observed CO and H2O lines are obtained.
3.1 Modelling of the CO lines
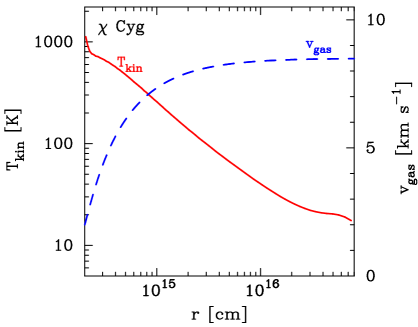
The Monte Carlo code developed by Schöier & Olofsson (2001) was used to model the observed CO lines. The molecular data were taken from the Hitran database (Rothman et al., 2009) and the collisional rate coefficients from Yang et al. (2010) for the 41 lowest rotational levels in the vibrational state. We fitted the line shapes and fluxes for the low- lines obtained from ground-based observations, as well as the interferometric data for the = 1–0 and 2–1 lines to more tightly constrain the size of the CO envelope (Schöier et al, in preparation). The parameters are listed in Table 2. The gas kinetic temperature distribution is shown in Fig. 1.
| Distance | 150 pc |
|---|---|
| Stellar effective temperature () | 2600 K |
| Stellar luminosity ( ) | 7.5 L⊙ |
| Gas terminal velocity () | 8.5 km s-1 |
| Inner radius of the shell () | 2 cm |
| Gas mass-loss rate () | 7 M⊙ yr-1 |
| CO abundance (CO/H2) | 6 |
| ortho-H2O abundance (o-H2O/H2) | 7.5 |
| para-H2O abundance (p-H2O/H2) | 3.6 |
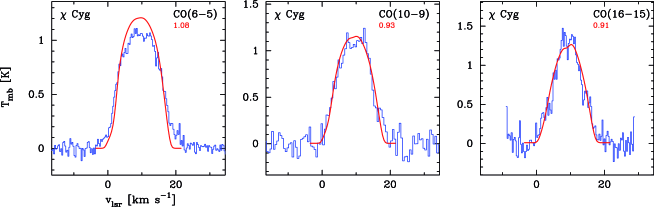
We assume a distance of 150 pc (Knapp et al., 2003), and the resulting mass-loss rate is 7 M⊙ yr-1 using an adopted CO abundance of 6 (relative to H2, see Table 2), which provide the best fits to both the line profile and line intensities. The uncertainty in the mass-loss rate is of the order 50%. This mass-loss rate agrees well with the dynamical mass-loss rate (certainly to within the errors in the input parameters). A comparison of the model fits and the HIFI observations can be seen in Fig 2. The models have been scaled to match the line intensities and the scaling factor (given in each panel of the figure) is a measure of the goodness of fit. The high rotational line at = 16–15 is noticeably narrower than the lower-level lines observed with HIFI and ground-based instruments (e.g., Knapp et al. 1998), indicating that this line originates in a region where the gas is still being accelerated. The estimated outer CO radius is 4 cm.
3.2 Modelling of the H2O lines
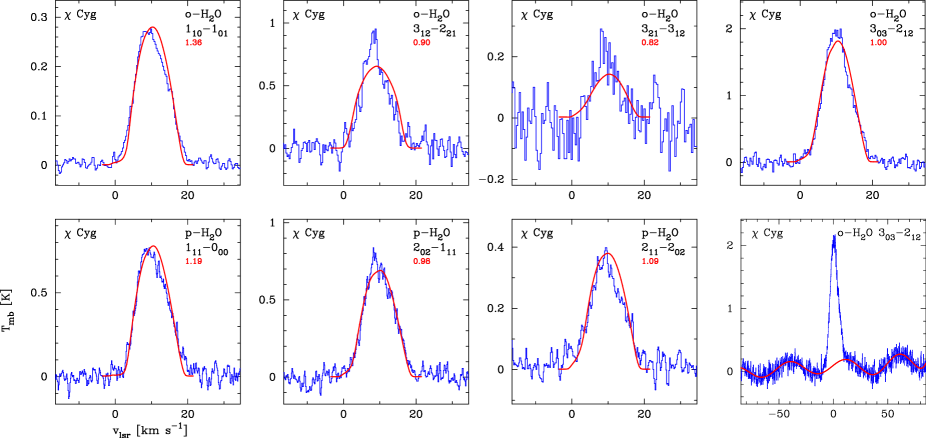
To calculate the strength and shape of the circumstellar H2O lines, we apply the parameters derived from our CO line modelling (mass-loss rate, gas temperature and density structure, and gas velocity law) to the radiative transfer model for H2O based on an accelerated lambda iteration (ALI) code (Justtanont et al., 2005; Maercker et al., 2008, 2009). We used the molecular data from Rothman et al. (2009) and the collisional cross-sections from Faure et al. (2007) for the lowest 45 levels of ortho- and para-H2O. The radiative excitation due to the absorption in the bending and stretching modes is included. The latter has been found to have a non-negligible effect in the low mass-loss-rate case (Maercker et al., 2009). The outer radius of the H2O shell was derived using the model results of Netzer & Knapp (1987), i.e., 3.6 cm. Since the ortho- and para-species are expected to be independent, we model the two species separately, using the same circumstellar input values and estimate the two abundances independently. Using the temperature and velocity structure from the CO modelling (Fig 1), we calculate the best-fit model to the H2O lines. All the lines are found to be sub-thermally excited. As mentioned above, both CO and H2O line cooling is taken into account.
We present the fits to four lines of ortho-H2O and three lines of para-H2O observed with HIFI in Fig. 3. These lines span upper energies from 60 to 300 K so the lines probe the cool part of the CSE as well as the warmer inner part. From Figs. 1 and 4, it can be seen that H2O lines originate well within the acceleration zone. All lines are of reasonably high signal-to-noise ratio, including the 3 line, the highest frequency line, where the spectrum is affected by standing waves inside HIFI. For this line, we used a higher order Chebyshev polynomial for the baseline subtraction (bottom right panel of Fig 3).
4 Results and conclusions
The observed HIFI lines are reliable probes of the inner CSE as the high-energy lines probe the wind in the acceleration zone. Both the velocity and density structures are tightly constrained using the HIFI lines. The abundance of CO used is 6, intermediate to those usually adopted for O- and C-rich CSEs. The derived ortho- and para-H2O abundances are significantly lower, (7.5 and (3.6, respectively (Table 2). These values are well below the limits for O-rich AGB stars of 10-4 (Justtanont et al., 2005; Maercker et al., 2008, 2009) consistent with Cyg being an S-star of C/O very close to unity. From our modelling, assuming that all carbon is locked up in CO (i.e., C/H = 3) and the oxygen is locked up in both CO and H2O (i.e., O/H = 3 + 5.5), our derived C/O is 0.98, given that a small fractional abundance of the oxygen is in dust grains. This value is slightly higher than that of 0.95, assumed by Duari & Hatchell (2000). A non-thermal equilibrium chemistry model for S-stars (C/O = 0.98) predicts an H2O abundance of 10-4 at the stellar photosphere, falling off to a few 10-6 at 5 R∗ (Cherchneff, 2006), an order of magnitude lower than our value.
In the thermal equilibrium (TE) limit at high temperature, the expected ortho-to-para ratio is 3. Our derived ortho-to-para ratio is 2.10.6, close to the high-temperature TE value. The reported ortho-to-para ratio in CSEs of O-rich stars vary from 1 in W Hya with a large uncertainty (Barlow et al., 1996) to 3 in IK Tau (Decin et al., 2010b). Our result is consistent with H2O molecules being formed under thermal equilibrium conditions in the warm and dense stellar photosphere.
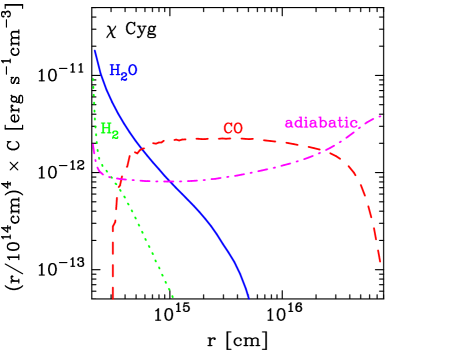
Given the low total H2O abundance of , it is clear from our analysis that the dominating cooling agent in the CSE of Cyg is CO (Fig. 4). Vibrationally excited H2 and rotationally excited H2O contribute only in the innermost ( 1015 cm) part of the CSE while CO line cooling extends further out until CO is photodissociated by the external UV field. Adiabatic cooling dominates only in the outermost part of the CSE. The derived H2O abundance, although much lower than in O-rich stars, is higher than that observed in C-stars, IRC+10216 (Melnick et al., 2001) and V Cyg (Neufeld et al., 2010), consistent with AGB stars of S-type being chemically intermediate between O-rich and C-rich AGB stars.
Acknowledgements.
HCSS / HSpot / HIPE is a joint development (are joint developments) by the Herschel Science Ground Segment Consortium, consisting of ESA, the NASA Herschel Science Center, and the HIFI, PACS and SPIRE consortia. K.J., F.S, M.M., and H.O. acknowledge funding from the Swedish National Space Board. This work has been partially supported by the Spanish MICINN, within the program CONSOLIDER INGENIO 2010, under grant “Molecular Astrophysics: The Herschel and Alma Era – ASTROMOL” (ref.: CSD2009-00038). R.Sz. and M.Sch. acknowledge support from grant N 203 393334 from Polish MNiSW. J.C. thanks funding from MICINN, grant AYA2009-07304. This research was performed, in part, through a JPL contract funded by the National Aeronautics and Space Administration.References
- Alcolea & Bujarrabal (1992) Alcolea, J. & Bujarrabal, V. 1992, A&A, 253, 475
- Aoki et al. (1999) Aoki, W., Tsuji, T., & Ohnaka, K. 1999, A&A, 350, 945
- Barlow et al. (1996) Barlow, M. J., Nguyen-Q-Rieu, Truong-Bach, et al. 1996, A&A, 315, L241
- Bujarrabal et al. (2010) Bujarrabal, V., Alcolea, J., Soria, R., et al. 2010, A&A, this volume
- Cherchneff (2006) Cherchneff, I. 2006, A&A, 456, 1001
- Crosas & Menten (1997) Crosas, M. & Menten, K. M. 1997, ApJ, 483, 913
- de Graauw et al. (2010) de Graauw, T., Helmich, F., Phillips, T. G., et al. 2010, A&A, in press
- Decin et al. (2010a) Decin, L., De Beck, E., Brunken, S., et al. 2010a, A&A, in press
- Decin et al. (2006) Decin, L., Hony, S., de Koter, A., et al. 2006, A&A, 456, 549
- Decin et al. (2010b) Decin, L., Justtanont, K., Waters, L., et al. 2010b, A&A, this volume
- Duari & Hatchell (2000) Duari, D. & Hatchell, J. 2000, A&A, 358, L25
- Faure et al. (2007) Faure, A., Crimier, N., Ceccarelli, C., et al. 2007, A&A, 472, 1029
- Goldreich & Scoville (1976) Goldreich, P. & Scoville, N. 1976, ApJ, 205, 144
- Harwit & Bergin (2002) Harwit, M. & Bergin, E. A. 2002, ApJ, 565, L105
- Hasegawa et al. (2006) Hasegawa, T. I., Kwok, S., Koning, N., et al. 2006, ApJ, 637, 791
- Ivezic & Elitzur (1997) Ivezic, Z. & Elitzur, M. 1997, MNRAS, 287, 799
- Justtanont et al. (2005) Justtanont, K., Bergman, P., Larsson, B., et al. 2005, A&A, 439, 627
- Justtanont et al. (1996) Justtanont, K., de Jong, T., Helmich, F. P., et al. 1996, A&A, 315, L217
- Justtanont et al. (1994) Justtanont, K., Skinner, C. J., & Tielens, A. G. G. M. 1994, ApJ, 435, 852
- Kemper et al. (2003) Kemper, F., Stark, R., Justtanont, K., et al. 2003, A&A, 407, 609
- Knapp & Morris (1985) Knapp, G. R. & Morris, M. 1985, ApJ, 292, 640
- Knapp et al. (2003) Knapp, G. R., Pourbaix, D., Platais, I., & Jorissen, A. 2003, A&A, 403, 993
- Knapp et al. (1998) Knapp, G. R., Young, K., Lee, E., & Jorissen, A. 1998, ApJS, 117, 209
- Lacour et al. (2009) Lacour, S., Thiébaut, E., Perrin, G., et al. 2009, ApJ, 707, 632
- Maercker et al. (2009) Maercker, M., Schöier, F. L., Olofsson, H., et al. 2009, A&A, 494, 243
- Maercker et al. (2008) Maercker, M., Schöier, F. L., Olofsson, H., Bergman, P., & Ramstedt, S. 2008, A&A, 479, 779
- Melnick et al. (2001) Melnick, G. J., Neufeld, D. A., Ford, K. E. S., Hollenbach, D. J., & Ashby, M. L. N. 2001, Nature, 412, 160
- Menten & Young (1995) Menten, K. M. & Young, K. 1995, ApJ, 450, L67+
- Netzer & Knapp (1987) Netzer, N. & Knapp, G. R. 1987, ApJ, 323, 734
- Neufeld et al. (1996) Neufeld, D. A., Chen, W., Melnick, G. J., et al. 1996, A&A, 315, L237
- Neufeld et al. (2010) Neufeld, D. A., Gonzalez-Alfonso, E., Melnick, G. A., et al. 2010, A&A, this volume
- Olofsson et al. (1981) Olofsson, H., Rydbeck, O. E. H., Lane, A. P., & Predmore, C. R. 1981, ApJ, 247, L81
- Pilbratt et al. (2010) Pilbratt, G., author2, author3, et al. 2010, A&A, in press
- Ramstedt et al. (2008) Ramstedt, S., Schöier, F. L., Olofsson, H., & Lundgren, A. A. 2008, A&A, 487, 645
- Roelfsema et al. (2010) Roelfsema, P., Helmich, F., Teyssier, D., et al. 2010, A&A, this volume
- Rothman et al. (2009) Rothman, L. S., Gordon, I. E., Barbe, A., et al. 2009, J. Quan. Spectroscopy and Radiative Transfer, 110, 533
- Schöier & Olofsson (2000) Schöier, F. L. & Olofsson, H. 2000, A&A, 359, 586
- Schöier & Olofsson (2001) Schöier, F. L. & Olofsson, H. 2001, A&A, 368, 969
- Schöier et al. (2002) Schöier, F. L., Ryde, N., & Olofsson, H. 2002, A&A, 391, 577
- Schwartz et al. (1982) Schwartz, P. R., Bologna, J. M., & Zuckerman, B. 1982, ApJ, 256, L55
- Shintani et al. (2008) Shintani, M., Imai, H., Ando, K., et al. 2008, PASJ, 60, 1077
- Tevousjan et al. (2004) Tevousjan, S., Abdeli, K., Weiner, J., Hale, D. D. S., & Townes, C. H. 2004, ApJ, 611, 466
- van der Tak et al. (2007) van der Tak, F. F. S., Black, J. H., Schöier, F. L., Jansen, D. J., & van Dishoeck, E. F. 2007, A&A, 468, 627
- van Leeuwen (2007) van Leeuwen, F. 2007, A&A, 474, 653
- Yang et al. (2010) Yang, B., Stancil, P. C., Barakrishnan, N., & Forrey, C. 2010, ApJ, submitted