The Mid-Infrared Period-Luminosity Relations for the Small Magellanic Cloud Cepheids Derived from Spitzer Archival Data
Abstract
In this paper we derive the Spitzer IRAC band period-luminosity (P-L) relations for the Small Magellanic Cloud (SMC) Cepheids, by matching the Spitzer archival SAGE-SMC data with the OGLE-III SMC Cepheids. We find that the and band P-L relations can be better described using two P-L relations with a break period at : this is consistent with similar results at optical wavelengths for SMC P-L relations. The and band P-L relations do not extend to sufficiently short periods to enable a similar detection of a slope change at . The slopes of the SMC P-L relations, for , are consistent with their LMC counterparts that were derived from a similar dataset. They are also in agreement with those obtained from a small sample of Galactic Cepheids with parallax measurements.
1 Introduction
A precise and accurate measurement of the Hubble constant at the levels is important for modern precision cosmology (for example, see Tegmark et al., 2004; Hu, 2005; Macri et al., 2006; Jackson, 2007; Olling, 2007; Greenhill, 2009; Komatsu et al., 2010; Larson et al., 2010; Mortonson et al., 2010). This will be feasible after the launch of the James Webb Space Telescope (JWST), which will be capable of routinely observing Cepheids in distant galaxies (Riess et al., 2009; Freedman & Madore, 2010) at near- and mid-infrared wavelengths. In preparation for future distance scale work, it is necessary to derive the Cepheid Period-Luminosity relations (hereafter P-L relations, also known as the Leavitt Law) at mid-infrared ( to ) wavelengths. Some advantages and potential problems of the mid-infrared P-L relations were summarized, for example, in Ngeow et al. (2009a, and reference therein). For example, the contribution of extinction to the error budget of the Hubble constant becomes negligible in these bands. Motivated by this, the Spitzer IRAC band (hereafter IRAC band) P-L relations were derived in Ngeow & Kanbur (2008a) and Freedman et al. (2008), by matching the known Cepheids in the Large Magellanic Cloud (LMC) to the archival SAGE dataset (Surveying the Agents of a Galaxy’s Evolution, Meixner et al., 2006). The IRAC band P-L relations were further refined in Ngeow et al. (2009b) and Madore et al. (2009), respectively, by using the SAGE Epoch 1 and 2 data. Besides the LMC Cepheids, the IRAC band P-L relations were also derived from a sample of Galactic Cepheids that possess independent distance estimates from literature (Marengo et al., 2010).
The main purpose of this Paper is to extend the IRAC band P-L relations to the Small Magellanic Cloud (SMC), which has a much lower metallicity than both the LMC and our Galaxy. The slopes of the P-L relations in the IRAC bands are expected to be insensitive to metallicity (Freedman et al., 2008). An empirical determination of the IRAC band P-L relation derived from SMC Cepheids will provide a critical test of this assumption.
2 The Data
Recently, the Optical Gravitational Lensing Experiment has released a catalog of SMC Cepheids from its third phase of operation (OGLE-III, Soszyński et al., 2010). This contains fundamental mode Cepheids. To derive the SMC IRAC band P-L relations, we matched the OGLE-III SMC Cepheids to the publicly released Epoch 1 SAGE-SMC (SAGE-SMC: Surveying the Agents of Galaxy Evolution in the Tidally-Disrupted, Low-Metallicity Small Magellanic Cloud, Gordon & SAGE-SMC Spitzer Legacy Team, 2010) IRAC band data (version ). To be consistent with previous studies (Ngeow & Kanbur, 2008a; Ngeow et al., 2009b), we only use the SAGE-SMC Archive data (hereafter SAGE-SMC data), which contains millions sources.
We matched the SAGE-SMC sources to the OGLE-III SMC Cepheids by using a search radius of . The number of matched SAGE-SMC sources and the mean separation () from the input OGLE-III SMC Cepheids in each IRAC bands are summarized in Table 1. From this table, it can be seen that more than of the matched SAGE-SMC sources are located within , or within one pixel in the IRAC band images (the pixel scale for IRAC instrument is pixel, see Fazio et al., 2004), from the OGLE-III SMC Cepheids. Extinction is ignored in this Paper, because it is negligible in the IRAC bands (Freedman et al., 2008; Ngeow et al., 2009b).
| Band | aa is the separation, in arcsecond, between the matched SAGE-SMC sources and the OGLE-III SMC Cepheids. | Std. Dev.bbThe standard deviation of the mean. | Fraction within ccThe fraction of matched SAGE-SMC sources within radius from the OGLE-III SMC Cepheids. | |
|---|---|---|---|---|
| 2567 | 0.263 | 0.214 | 98.75% | |
| 2545 | 0.264 | 0.216 | 98.70% | |
| 699 | 0.265 | 0.271 | 97.00% | |
| 404 | 0.284 | 0.290 | 96.29% |
3 The SMC P-L Relations in the IRAC Bands
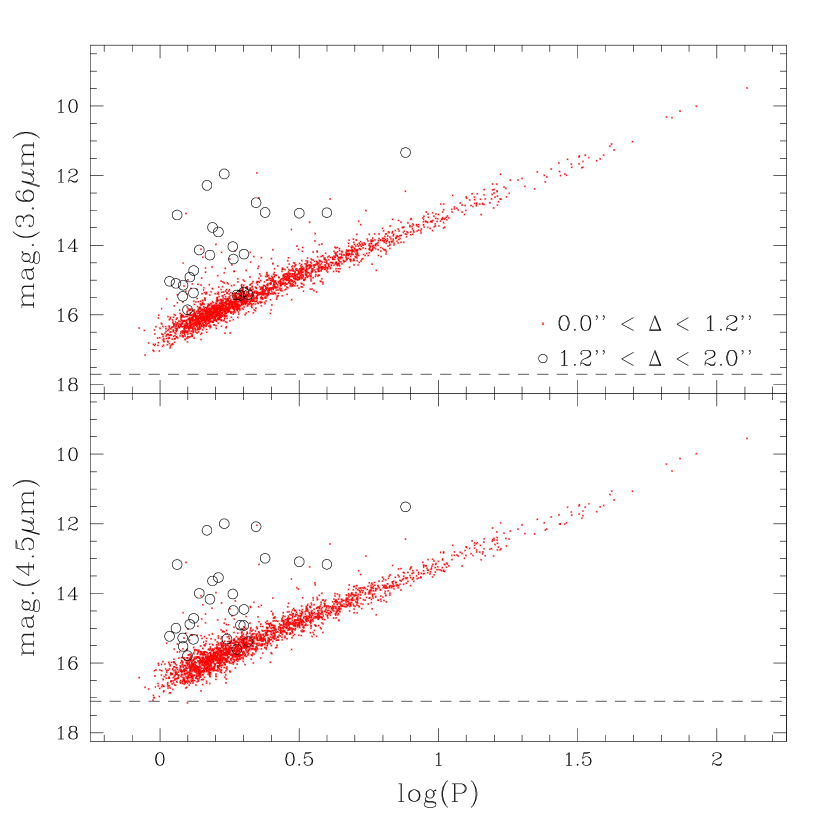
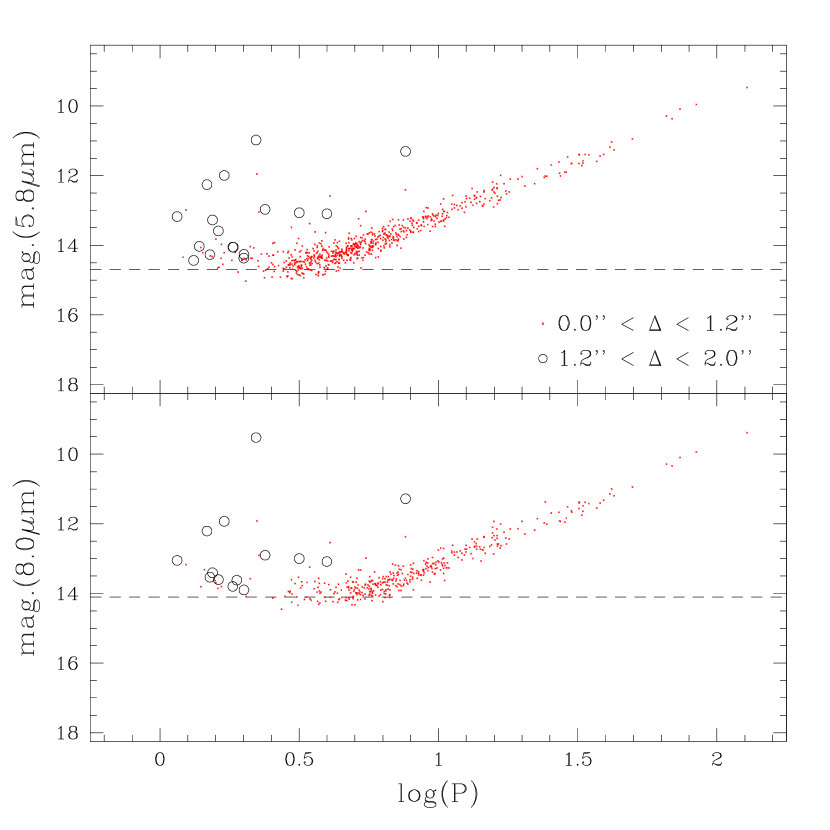
Figure 1 displays the P-L relation in the four IRAC bands using all of the matched SAGE-SMC sources. This Figure presents a clear correlation between the IRAC band magnitudes and the Cepheid pulsation period. To remove the outliers shown in the Figure, we employed an iterative rejection algorithm when fitting the P-L relations to the data. This is the same procedure used in Ngeow & Kanbur (2008a) and Ngeow et al. (2009b). The abnormally bright outliers shown in Figure 1 could be blended with a nearby red companion. To find out if there are any nearby sources around these outliers, we searched for neighboring sources within radius from the Cepheids’ location, using the OGLE-III SMC photometry map (Udalski et al., 2008, which has a pixel scale of pixel). Only about 20% of of these outliers were found to have one faint neighboring source around the Cepheids (and few of them have more than one neighboring sources). Figure 2 shows two examples of the outliers that do not have any neighboring source; while Figure 3 presents two examples that display a neighboring source. These abnormally bright outliers could be due to the presence of circumstellar dust envelopes that would cause the observed mid-infrared excess. The circumstellar envelope could be formed from Cepheid mass-loss activity (see, for example, Neilson et al., 2010, and reference therein). A detailed investigation of these outliers and their mass-loss activity is beyond the scope of this Paper, but will be addressed in future papers. Nevertheless, it is clear that these outliers should be removed from the sample.
Figure 1 also suggests that a period cut is needed for the and band data, as the data approaches the faint magnitude limit for the short period Cepheids. We therefore applied a range of period cuts to the data. Figure 4 shows the slopes of the P-L relations for all four IRAC bands as a function of period cut. We discuss the implications of the period cuts and the resulting P-L relations in the following sub-sections.
3.1 The & Band P-L Relations
Figure 1 implies that period a cut may not be needed for the and band data. If a period cut is not applied to the data, the resulting P-L relations are: () and (). However, Figure 4 points to the fact that the slopes of the P-L relations in these two IRAC bands gradually changes from a steep slope () to a more shallow slope () when the the adopted period cut, , is less than . In the optical bands, a change of slope for SMC P-L relations at has been reported in the literature (Bauer et al., 1999; Udalski et al., 1999; Sharpee et al., 2002; Sandage et al., 2009; Soszyński et al., 2010). This slope change is postulated to occur due to evolutionary effects (Becker et al., 1977; Baraffe et al., 1998). Therefore, we separated out the and band data at . For Cepheids with , the resulting P-L relations are:
While for Cepheids with , the resulting P-L relations are:
The difference between the long () and short () period slopes are at the and level for the and band P-L relations, respectively. Figure 5 presents the residuals of the fitted P-L relations as a function of period when the long period P-L relations are used to fit all data. The residuals show a clear trend at the short period end. To further verify that there is a change of slope at , we applied the -test (for example, see Weisberg, 1980) to the combined data of the long and short period Cepheids (after removing the outliers). The -test results show that the and band P-L relations are non-linear at the break period of , with and , respectively111Recall that for a large number of data points, at confident level. Therefore, indicates that the null hypothesis of a single-line regression can be rejected..
For Cepheids with , we also tested the non-linear P-L relations at a break period of (which have been found to be non-linear for LMC P-L relations in the optical, see Kanbur & Ngeow, 2004; Sandage et al., 2004; Ngeow et al., 2005; Kanbur & Ngeow, 2006; Ngeow et al., 2008b, 2009b, and reference therein). The -test results imply that the P-L relations are linear (with and ). This is consistent with tests on the LMC IRAC band P-L relations (Ngeow & Kanbur, 2008a; Ngeow et al., 2009b).


3.2 The & Band P-L Relations
It is clear from Figure 1 that the shallow slopes for and band P-L relations with , as shown in Figure 4, are due to the lack of Cepheids at the short period end, where the magnitudes approach the faint limit in these two IRAC bands. A period cut of is necessary to remove the bias due to the incomplete data at the faint magnitude end. Inspecting Figure 4 suggests that the slope of the and band P-L relations begin to stabilize at and , respectively. Hence, we have adopted a period at and when deriving the P-L relations in these two bands. The resulting P-L relations are:
The ratios of the number of Cepheids with and are and in the and band, respectively, after the period cut. Therefore the -test can be applied to the data in order to test for non-linearity at . The -test results show that both of the and band P-L relations are linear, with and respectively. This result is also consistent with the LMC results (Ngeow & Kanbur, 2008a; Ngeow et al., 2009b).
4 Comparison of the P-L Slopes
In Table 2, we compare the IRAC band P-L slopes currently available for our Galaxy, LMC and SMC. We aggregate the slopes into two groups: one with shallow slopes and another with steep slopes. In general, slopes within a group are consistent with each other. In contrast, the LMC slopes derived in Ngeow et al. (2009b, the LMC2) and the SMC slopes disagree with those in the “steep slope” group at the level or more. If the IRAC band P-L slopes were indeed shallow, then the slopes from all three galaxies would be consistent (despite the large uncertainties for GAL3 slopes shown in Table 2). This suggests that the metallicity will not strongly affect the IRAC band P-L slopes. On the other hand, if the Galactic and LMC P-L slopes were steeper (for those listed as GAL1/2 and LMC1 in Table 2), our SMC slopes will challenge the assumption that these slopes should be insensitive to metallicity.
| Galaxy | ReferenceaaReference: (1) Marengo et al. (2010); (2) Madore et al. (2009); (3) Ngeow et al. (2009b); (4) This Paper for Cepheids with . | Note | ||||
|---|---|---|---|---|---|---|
| Steep Slope | ||||||
| GAL1 | (1) | GAL Cepheids with “old” IRSB distancesbb“Old” and “new” distances referred to the old and new projection factor-period relations adopted in IRSB technique, respectively. See Marengo et al. (2010) for more details. | ||||
| GAL2 | (1) | GAL Cepheids with “new” IRSB distancesbb“Old” and “new” distances referred to the old and new projection factor-period relations adopted in IRSB technique, respectively. See Marengo et al. (2010) for more details. | ||||
| LMC1 | (2) | LMC Cepheids | ||||
| Shallow Slope | ||||||
| GAL3 | (1) | GAL Cepheids with parallax distancesbb“Old” and “new” distances referred to the old and new projection factor-period relations adopted in IRSB technique, respectively. See Marengo et al. (2010) for more details. | ||||
| LMC2 | (3) | to LMC Cepheids | ||||
| SMC | (4) | to SMC Cepheids | ||||
Does crowding affect the derivation of the SMC P-L slopes presented in this Paper? We tested this by dividing our SMC Cepheids into two groups: one group for Cepheids located in the central “bar” region (with higher stellar density), and another group for Cepheids located on the outskirts of the “bar” region. The derived P-L relations from these two groups are consistent with each other. We performed another test by searching the nearby companion sources within of the respected Cepheids, using the OGLE-III SMC photometry map mentioned previously. The Cepheid samples were grouped into two groups that either did or did not contain the nearby sources. Again, the slopes derived from these two groups are in good agreement. We therefore believe crowding does not seriously affect our results.
The discrepancy between the two LMC slopes given in Table 2 may be due, in part, to the different samples used in both studies. Madore et al. (2009) derived the P-L relations using 70 LMC Cepheids drawn from Persson et al. (2004). Most of them had periods longer than days. In contrast, the LMC P-L relations presented in Ngeow et al. (2009b) were derived based on the OGLE-III LMC Cepheids (Soszyński et al., 2008), which have a distribution peaking at (Soszyński et al., 2010). Neilson et al. (2010) showed that the LMC IRAC band P-L slopes, based on the OGLE-III Cepheids, became comparable to the slopes given in Madore et al. (2009) when only the long period () Cepheids were used.
For the Galactic IRAC band P-L relations, the P-L slopes derived from the infrared surface brightness (IRSB) technique (GAL1 and GAL2 in Table 2) were steeper than the slopes derived from Cepheids that have parallax measurements (GAL3 in Table 2). The large uncertainties of the GAL3 P-L slopes (due to the combination of a small number of data points in the sample and less precise photometry, see Marengo et al., 2010) cause all three sets of Galactic P-L slopes to be consistent with each other. It is worthwhile to note that the theoretical P-L slopes derived in Marengo et al. (2010) agree well with the GAL3 P-L slopes. If the uncertainties of the P-L slopes derived from the parallax distances are the same as those from the IRSB techniques, then the slopes between them will disagree at the level. Marengo et al. (2010) suggested that the projection factor-period relation used in IRSB technique may need further refinement.
5 Conclusion
In this Paper we have derived SMC P-L relations in the IRAC bands, by matching the archival SAGE-SMC data to the latest SMC Cepheid catalog from OGLE-III. We have found, for the first time, that the SMC P-L relations show a change of slope at in the and band, similar to their optical counterparts. Due to the incompleteness at the short period end, such a change of slope cannot be confirmed to exist in the and bands. Future observations with JWST may help to determine the change of slope in these two bands.
The slopes of the SMC IRAC band P-L relations were found to be around , which is consistent with the LMC slopes found in Ngeow et al. (2009b) and the Galactic P-L relations derived from Cepheids with parallax measurements (Marengo et al., 2010). This indicates that the slopes of the P-L relations in the IRAC bands are insensitive to metallicity. However, the SMC slopes disagree with the steeper slopes for the LMC and Galactic counterparts from Madore et al. (2009) and those from the IRSB technique, respectively. Future observations such as the parallax measurements from Gaia for Galactic Cepheids and/or JWST observations of Magellanic Cloud Cepheids may help to resolve this discrepancy.
References
- Baraffe et al. (1998) Baraffe, I., Alibert, Y., M’era, D., Chabrier, G. & Beaulieu, J.-P., 1998, ApJ, 499, L205
- Bauer et al. (1999) Bauer, F., et al., 1999, A&A, 348, 175
- Becker et al. (1977) Becker, S. A., Iben, I., Jr. & Tuggle, R. S., 1977, ApJ, 218, 633
- Fazio et al. (2004) Fazio, G. G., et al., 2004, ApJS, 154, 10
- Freedman et al. (2008) Freedman, W. L., Madore, B. F., Rigby, J., Persson, S. E. & Sturch, L., 2008, ApJ, 679, 71
- Freedman & Madore (2010) Freedman, W. L. & Madore, B. F., 2010, Annual Reviews of Astronomy and Astrophysics, 48, 673
- Gordon & SAGE-SMC Spitzer Legacy Team (2010) Gordon, K. D. & SAGE-SMC Spitzer Legacy Team, 2010, Bulletin of the American Astronomical Society, 41, 489
- Greenhill (2009) Greenhill, L., 2009, astro2010: The Astronomy and Astrophysics Decadal Survey, 2010, 103
- Hu (2005) Hu, W. 2005, Observing Dark Energy, ed. Wolf, S. & Lauer, T., ASP Conf. Series Vol. 339, pg 215
- Jackson (2007) Jackson, N., 2007, Living Reviews in Relativity, 10, 4
- Kanbur & Ngeow (2004) Kanbur, S. M. & Ngeow, C.-C., 2004, MNRAS, 350, 962
- Kanbur & Ngeow (2006) Kanbur, S. M. & Ngeow, C.-C., 2006, MNRAS, 369, 705
- Komatsu et al. (2010) Komatsu, E., et al., 2010, submitted to ApJS (arXiv:1001.4538)
- Larson et al. (2010) Larson, D., et al., 2010, submitted to ApJS (arXiv:1001.4635)
- Macri et al. (2006) Macri, L. M., Stanek, K. Z., Bersier, D., Greenhill, L. J. & Reid, M. J., 2006, ApJ, 652, 1133
- Madore et al. (2009) Madore, B. F., Freedman, W. L., Rigby, J., Persson, S. E., Sturch, L. & Mager, V., 2009, ApJ, 695, 988
- Marengo et al. (2010) Marengo, M., Evans, N. R., Barmby, P., Bono, G., Welch, D. L. & Romaniello, M., 2010, ApJ, 709, 120
- Meixner et al. (2006) Meixner, M., et al., 2006, AJ, 132, 2268
- Mortonson et al. (2010) Mortonson, M. J., Hu, W. & Huterer, D., 2010, Phys. Rev. D, 81, 063007
- Neilson et al. (2010) Neilson, H. R., Ngeow, C.-C., Kanbur, S. & Lester, J. B., 2010, ApJ, 716, 1136
- Ngeow et al. (2005) Ngeow, C.-C., Kanbur, S. M., Nikolaev, S., Buonaccorsi, J., Cook, K. H. & Welch, D. L., 2005, MNRAS, 363, 831
- Ngeow & Kanbur (2008a) Ngeow, C.-C. & Kanbur, S. M., 2008a, ApJ, 679, 76
- Ngeow et al. (2008b) Ngeow, C.-C., Kanbur, S. M. & Nanthakumar, A., 2008b, A&A, 477, 621
- Ngeow et al. (2009a) Ngeow, C.-C., Kanbur, S., Ghobrial, L., Neilson, H. & Macri, L., 2009a, American Institute of Physics Conference Series, 1170, 37
- Ngeow et al. (2009b) Ngeow, C.-C., Kanbur, S. M., Neilson, H. R., Nanthakumar, A. & Buonaccorsi, J., 2009b, ApJ, 693, 691
- Ngeow et al. (2010) Ngeow, C.-C., Ita, Y., Kanbur, S. M., Neilson, H. R., Onaka, T. & Kato, D., 2010, MNRAS In-Press (arXiv:1006.1553)
- Olling (2007) Olling, R. P., 2007, MNRAS, 378, 1385
- Persson et al. (2004) Persson, S. E., Madore, B. F., Krzemiński, W., Freedman, W. L., Roth, M. & Murphy, D. C., 2004, AJ, 128, 2239
- Riess et al. (2009) Riess, A. G., et al., 2009, ApJ, 699, 539
- Sandage et al. (2004) Sandage, A., Tammann, G. A. & Reindl, B., 2004, A&A, 424, 43
- Sandage et al. (2009) Sandage, A., Tammann, G. A. & Reindl, B., 2009, A&A, 493, 471
- Sharpee et al. (2002) Sharpee, B., Stark, M., Pritzl, B., Smith, H., Silbermann, N., Wilhelm, R. & Walker, A., 2002, AJ, 123, 3216
- Soszyński et al. (2008) Soszyński, I., et al., 2008, Acta Astronomica, 58, 163
- Soszyński et al. (2010) Soszyński, I., et al., 2010, Acta Astronomica, 60, 17
- Tegmark et al. (2004) Tegmark, M., et al., 2004, Phys. Rev. D, 69, 103501
- Udalski et al. (1999) Udalski, A., Szymanski, M., Kubiak, M., Pietrzynski, G., Soszynski, I., Wozniak, P. & Zebrun, K., 1999, Acta Astronomica, 49, 201
- Udalski et al. (2008) Udalski, A., et al., 2008, Acta Astronomica, 58, 329
- Weisberg (1980) Weisberg, S., 1980, Applied Linear Regression. Wiley, New York