Strong CH+ =1–0 emission and absorption in DR21 ††thanks: Herschel is an ESA space observatory with science instruments provided by European-led Principal Investigator consortia and with important participation from NASA.
We report the first detection of the ground-state rotational transition of the methylidyne cation CH+ towards the massive star-forming region DR 21 with the HIFI instrument onboard the Herschel satellite. The line profile exhibits a broad emission line, in addition to two deep and broad absorption features associated with the DR 21 molecular ridge and foreground gas. These observations allow us to determine a =1–0 line frequency of =835137 MHz, in good agreement with a recent experimental determination. We estimate the CH+ column density to be a few cm-2 in the gas seen in emission, and cm-2 in the components responsible for the absorption, which is indicative of a high line of sight average abundance []/[H]. We show that the column densities agree well with the predictions of state-of-the-art C-shock models in dense UV-illuminated gas for the emission line, and with those of turbulent dissipation models in diffuse gas for the absorption lines.
Key Words.:
Astrochemistry - ISM : molecules - ISM : kinematics and dynamics - Turbulence1 Introduction
The methylidyne ion CH+ was among the first molecules to be detected in the interstellar medium (ISM) Douglas & Herzberg (1941). This reactive ion is prevalent in the diffuse ISM with column densities several orders of magnitude above the predictions of UV-driven equilibrium models (see references in Godard et al. 2009). Apart from the strong emission lines of CH+ detected in both the envelope of the Red Rectangle Hobbs et al. (2004) and NGC 7027 Cernicharo et al. (1997), all other observations are absorption lines detected at visible wavelengths in the spectra of nearby stars. is a light molecule and its rotational lines lie at submillimeter and far infrared wavelengths. The exact frequencies of the rotational transitions of CH+ have remained elusive for a long time because of the extreme reactivity of CH+ and the difficulty in isolating it in the laboratory Pearson & Drouin (2006). Recent laboratory measurements have led to GHz for the ground-state transition (Amano, 2010). Ground-based astronomical detection of (1-0) is prevented by its proximity to a strong atmospheric line of water vapor. The ground-state frequency of the isotopologue , redshifted by GHz, has superior sky transmission. It has been detected at the Caltech Submillimeter Observatory towards several massive star-forming regions of the inner Galaxy (Falgarone et al. in prep., Falgarone et al. 2005). The abundances averaged along these long lines-of-sight (los), confirm the high abundances of this species inferred from visible observations in the local ISM, []/[H] 8 on average. In this paper, we report the detection of the =1–0 transition towards the massive star-forming region DR21, presented in Sect. 2. The HIFI observations are described in Sect. 3. The results, given in Sect. 4, are compared to models in Sect. 5.
2 The DR 21 region
The massive star-forming region DR 21 is located in the Cygnus X complex at an average distance of 1.7 kpc, that of the Cyg OB2 stellar association (see reviews by Jakob et al. 2007; Schneider et al. 2010). The DR 21 molecular core is one of the most massive cores in the Galaxy (2.5 at the 1 pc-scale) (Kirby 2009). It is located in front of the main DR 21 HII region comprising five compact HII regions and more diffuse ionised gas (Roelfsema et al. 1989; Wilson et al. 1995; Cyganowski et al. 2003).
The star-forming region DR 21 itself is known to host one of the most powerful molecular outflows shining in vibrationally excited H2 (e.g., Garden & Carlstrom 1992). The outflow source is heavily extinguished by more than 100 magnitudes, and its location is not accurately known (Wilson et al. 1995). High velocity HI (up to 90 kms-1) associated with the molecular outflow has been detected by the VLA (Russell et al. 1992), indicating that the molecular outflow may be driven by this atomic jet. The outflow shows up as broad wings in CO and HCO+ lines Kirby (2009). At the position of the HIFI beam, the S(1) H2 emission line has a similar broad width Nadeau & Béland (1988); Cruz-Gonzalez et al. (2007) to that of the SiO emission (Motte et al. 2007).
Some line profiles imply that there is foreground gas, which is probably associated with the Cygnus X complex Jakob et al. (2007); Schneider et al. (2010). A foreground component associated with W75N shows up as weak emission lines at km s-1 in low excitation transitions of CO and HCO+ or atomic carbon, and in the atomic oxygen fine-structure line, with cm-2 Poglitsch et al. (1996). The total hydrogen column density of this foreground material is estimated to be cm-2 for an elemental abundance ratio [O]/[H] = Oliveira et al (2005), in coherence with cm-2 inferred from K extinction to DR21 (Marshall et al. 2006). This component is also detected in atomic hydrogen, which indicates that there is saturated absorption of between -5 and 18 Roberts et al. (1997). Its estimated HI column density, if , is (HI) cm-2.
3 HIFI observations
All FIR spectra presented here were obtained in the course of performance verification observations with the HIFI instrument (Pilbratt et al. 2010; de Graauw et al. 2010). Since their main goal was to demonstrate the functionality and performance of the different observing modes, the spectra were taken with a large variety of observing strategies. Most observations were only single-point observations towards the central position of the DR21 HII region at RA=20h39m01.1s, Dec=42∘19′43.0′′ (J2000). At the frequencies around 1 THz discussed here, the Herschel beam covers about 20′′ HPBW (or 0.16 pc at 1.7 kpc). Here, we only present data from the wideband spectrometer (WBS) that provides a resolution of 1.1 MHz, corresponding to 0.2 km/s (at 1900 GHz) and 0.4 km/s (at 835 GHz).
The CH+ spectrum at 835 GHz was obtained in a single-point load-chop observing mode without OFF reference. It uses the internal cold load as reference, having the advantage that we can exclude any self-chopping effects in the line profiles. The mode has, however, the disadvantage that the different optical paths towards the sky and the internal calibration load sometimes lead to standing wave differences that are detected as baseline ripples. We subtracted these manually using the HifiFitFringe pipeline tool. The total integration time on the source was 48 s leading to a noise level of 0.1 K for the combination of the spectra from both polarisations at the WBS resolution.
The H2O (1113 GHz) line was observed in the frame of a spectral scan in a load-chop mode and an on-source integration time of 30 s. The baseline was calibrated on a distant OFF position (20h37m10s, 42∘37′00′′) because the first selected OFF position, closer to the ON, retained some signal (see Fig. 1). The [CII] line was detected in one of the first double-beam switch raster mapping observations in which neither the logic of the mapping mode worked as expected nor the pointing of the instrument was yet known. The instrument pointing was measured afterwards and the map coordinates were corrected by hand to include the correct offsets. A comparison of the integrated [CII] intensities in the shifted map with the MSX 8 m band shows a very good agreement, confirming the accuracy of the correction. The observations were taken on a 7′′ raster that included a 14 s on-source integration time at each point. To obtain a spatial resolution comparable to that of the other two lines, the map was convolved with a Gaussian beam of 20′′ at the DR 21 central position.
4 Results of the line profile analysis
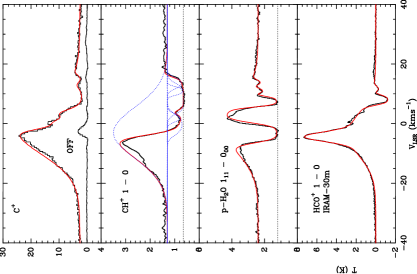
The HIFI spectra are displayed in Fig. 1 with, for comparison, an IRAM-30m spectrum of HCO+(1-0) (Schneider et al. 2010). The line profiles exhibit both complex emission and absorption because of the multiplicity of velocity components and gas physical conditions within the beam. The line integrated areas in emission and absorption are remarkably comparable. This would lead to a weak or non-detection with low spectral resolution instruments. The dashed lines in the and p- spectra, at about half the continuum level, reveal the broad velocity ranges across which the absorption lines are saturated.
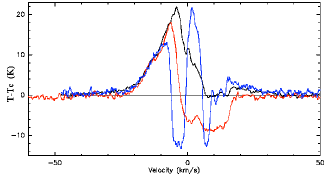
The (1-0), and p- spectra, plotted after their continuum has been subtracted, are superimposed in Fig. 2 for the frequency of the =1–0 line set to 835.137 GHz. We propose in Sect. 5 that the broad line emission originates from a shock associated with the outflow, and we show that the three species, , , and are connected with each other in the shock chemistry. The good agreement (within 1 ) between the blue wing of the emission line profiles of these three species allows us to adopt MHz as the rest frequency of the (1-0) line, which is remarkably consistent with the experimental value measured by Amano (2010).
| Line | ||||||
|---|---|---|---|---|---|---|
| K | ||||||
| CH+ | -3.0 | 20.0 | 2.2 | |||
| p-H2O | -1.0 | 20.0 | 2.16 | |||
| C+ | -1.8 | 20.0 | 22 | |||
| 0 | 80.0 | 1.0 | ||||
| HCO+ | -3.6 | 17.0 | 2.8 |
The CH+ =1–0 line profile can be decomposed into a broad emission line and a series of absorption features. We used information from the line profiles of CO and HCO+ =1–0 (see Fig. 1), the spectra of atomic carbon Jakob et al. (2007), and other HIFI spectra (Ossenkopf et al. 2010; van der Tak et al. 2010) to constrain the velocity and linewidth of these components. Since the line has not been observed, the actual emission profile is unknown. We had to rely on the symmetric shapes of the CO emission lines to model the broad emission wings with Gaussians adjusted on the blue wings of the lines (Table 1). Over the velocity range -5 to 17 , not only the continuum level but also the core line emission is absorbed by intervening gas. The broad emission lines ( , see Table 1) correspond to the emission associated with the outflow shock (see Sect. 5). A still broader component in the [CII] line has a width similar to that of the H66 recombination lines Roelfsema et al. (1989). Self-absorption features in the range to 2 , caused by the close environment of the DR21 core, are visible in CO, HCO+(4-3), and other dense gas tracers (e.g., NH3 inversion lines). The absorption dip at this velocity is more prominent in the H2O() profile as expected from the high critical density of this transition. We disregarded this velocity range in our analysis because of the unknown line intensity of the dense core emission. In contrast, the absorption at corresponds to the gas that is most likely to be associated with the W75N cloud in the Cygnus X complex. Its velocity coverage is very similar in the and spectra. We fitted three components in this velocity range, guided by the absorption features of the HCO+ =1–0 and H2O profiles at , and 13.7 shown in Fig. 1, the resulting profiles being in red.
The column density of the emission line was determined by assuming that it is optically thin. This is consistent with the (1-0) line not being detected in emission towards galactic massive star-forming regions (Falgarone et al. in prep., Falgarone et al. 2005). The total column density was therefore assumed to scale with the line integrated area (in K) with a coefficient that depends on the excitation temperature. For 40 K K, the range of that minimizes , a lower limit was obtained, using the spontaneous decay rate s-1 inferred from the dipole moment, D Kobayashi et al. (1993). In absorption, we inferred the column density from the integral of the optical depth (in ) to be . It is almost independent of as long as K, an approximation that is valid for gas of density much lower than the critical density of the transition () and not closely associated with intense FIR radiation. The resulting column densities are given in Table 2. Those of the saturated absorption components are lower limits. Although the Gaussian decomposition is by no means unique, it provides an estimate of both the detected column densities and the abundance relative to the total hydrogen []/[H] in the diffuse gas. We note that the [CII] line opacity of the foreground gas, averaged over 10, is . This opacity limit corresponds to a column density larger than cm-2 for gas of density lower than the critical density of the transition , i.e. a few 103, whatever the line excitation temperature (Crawford et al. 1985). The required column density is much larger if the transition is thermalized, i.e. . From the estimated gas column of cm-2, the expected column is cm-2, assuming a gas-phase carbon abundance of . This value is in close agreement with that derived for the low density limit, strengthening the association of the foreground absorption with gas of densities lower than a few 103.
| Component | ||
|---|---|---|
| K | cm-2 | |
| Broad line emission | ||
| Foreground absorption | 3.0 |
5 Comparison with model predictions
The only formation route of the molecular ion CH+ is understood to be initiated by the reaction C+ + H CH+ + H, which is highly endoenergic (4640 K). The formation of in the cold interstellar medium therefore requires suprathermal energy. Several scenarios have been investigated : C-shocks (Pineau des Forêts et al. 1986), highly illuminated and dense photon-dominated regions (PDR) where reacts with vibrationally excited H2 (Sternberg & Dalgarno 1995; Agundez et al. 2010), turbulent interfaces between the warm and cold neutral medium (Lesaffre et al. 2007), and regions of intermittent turbulent dissipation (TDR models, Godard et al. 2009). In the first and last models, ion-neutral friction plays a major role.
For the DR 21 core, it is unclear which processes are at work in the formation. Broad ( ) emission lines of SiO Motte et al. (2007) and vibrationally excited H2 Cruz-Gonzalez et al. (2007), similar to the broad emission in the HIFI profiles, are observed and suggest the influence of a shock. We now present a preliminary attempt to account for the observed column densities of CH+ in this highly irradiated environment.
5.1 emission line: C-shock models
We used a steady-state model for C-shocks with time-dependent chemistry and ionization (Flower & Pineau des Forêts 2003). The chemical network was supplemented with the relevant photo-reactions (Pineau des Forêts, priv. comm.). The H2 and CO self-shielding were assumed to be those of a PDR model at cm-3. We adopted a pre-shock density cm-3, a shock velocity =20 , a magnetic field G (from the measure of magnetic field in Roberts et al. 1997), and a standard cosmic-ray ionisation rate of s-1. We stopped the computation of the shocks at a neutral flow time of 104 yr, which corresponds to the estimated dynamical age of the outflow (lobes of 0.5 pc for a jet velocity up to 100 ). The CH+ column-density was found to have already reached a plateau at this stage in the shock, so the results are insensitive to that choice of age.
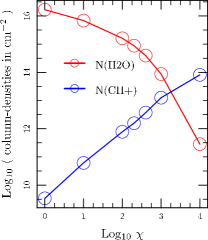
Although the incident radiation field is estimated to be in ISRF units Ossenkopf et al. (2010) for the material closest to the HII region, we keep this value as a free parameter. Figure 3 displays the total column densities of CH+ and H2O as a function of the adopted external radiation field. Its effect turns out to be quite interesting: a strong radiation field () is needed to account for the large observed CH+ column density. It is the enhanced photo-dissociation of and , both products of the rapid hydrogenation of in the shock, that increases the abundance of as increases. The shock model also predicts that both and are rather well distributed across the various velocity slices of the shock. This supports the assumption that the and blue line wings are similar, underlying the line frequency determination.
5.2 absorption lines: turbulent dissipation models
The large column density observed in the foreground component corresponds to a los average of the abundance, []/[H], for (see Sect. 2). It can be reproduced in the framework of TDR models. At any time, a very large number of tiny regions ( AU), altogether filling a small fraction of the entire los, are developing a transient warm chemistry triggered by dissipation bursts where local abundances reach (Godard et al. 2009). The filling factor of the ensemble of these tiny structures is set by the energy transfer rate in the turbulent cascade, , identified with the turbulent dissipation rate. The resulting average abundance is found to scale as []/[H]ave=6.4 for an ambient radiation field in ISRF units, where is the density of the gas in which the bursts occur and is a non-local quantity of galactic average (see Godard et al. 2009). Fluctuations by two orders of magnitude are observed in the ISM about that galactic average, the highest values being reached in active star-forming regions, such as Cygnus X. We thus expect to be up to 100 times higher than average in Cygnus X, so that the observed abundance can be produced by intermittent dissipation of turbulence occurring in gas of density up to . The total number of tiny structures along that 1.7 kpc los is found to scale as .
6 Conclusion
We have detected the line profile of CH+(1-0) towards the DR 21 massive star-forming region with the HIFI instrument, obtaining several major results. The line is a combination of broad emission and almost saturated broad absorption, which have comparable integrated areas. The rest-frame frequency of the =1–0 line is inferred to be MHz. For the gas seen in emission, the column density, of about 1013 cm-2, compares well to predictions of C-shock models propagating in dense, highly illuminated gas. Additional chemical modelling (and radiative transfer calculations) are needed to confirm the C-shock framework and exploit the other line signatures. The large CH+ column density in the foreground gas, cm-2, can be explained by the turbulent dissipation models in diffuse gas and confirms the large opacity of that line in the diffuse molecular gas,
Acknowledgements.
HIFI has been designed and built by a consortium of institutes and university departments from across Europe, Canada and the United States (NASA) under the leadership of SRON, Netherlands Institute for Space Research, Groningen, The Netherlands, and with major contributions from Germany, France and the US. Consortium members are : Canada: CSA, U. Waterloo; France : CESR, LAB, LERMA, IRAM; Germany : KOSMA, MPIfR, MPS; Ireland : NUI Maynooth; Italy : ASI, IFSI-INAF, Osservatorio Astrofisico di Arcetri-INAF; Netherlands : SRON, TUD; Poland : CAMK, CBK; Spain : Observatorio Astronòmico Nacional (IGN), Centro de Astrobiologia; Sweden : Chalmers University of Technology - MC2, RSS & GARD, Onsala Space Observatory, Swedish National Space Board, Stockholm University - Stockholm Observatory; Switzerland : ETH Zurich, FHNW; USA : CalTech, JPL, NHSC. MG and EF acknowledge the support from the Centre National de Recherche Spatiale (CNES). Part of this work was supported by the German DeutscheForschungsgemeinschaft, DFG project # Os177/1–1. We thank G. Pineau des Forêts for providing us with his version of the code for C-shock models.References
- Agundez et al. (2010) Agundez M., Goicoechea J.R., Cernicharo J. et al. 2010 ApJ 713, 662
- Amano (2010) Amano, T. 2010 ApJ accepted
- Cernicharo et al. (1997) Cernicharo J. et al. 1997 ApJL 483 L65
- Crawford et al. (1985) Crawford, M.K., Genzel, R., Townes C.H. et al. 1985 ApJ 291, 755
- Cruz-Gonzalez et al. (2007) Cruz-Gonzalez I., Salas L., Hiriart D. 2007 Rev Mex. A. & A. 43, 337
- Cyganowski et al. (2003) Cyganowski C.J., Reid M.J., Fish V.L. & Ho P.T.P. 2003, ApJ 596, 344.
- Davis et al. (2007) Davis C.J., Kumar M.S.N., Sandel G. et al. 2007 MNRAS 374 29
- Douglas & Herzberg (1941) Douglas, A.E., Herzberg,G, 1941 ApJ 94 381.
- Falgarone et al. (2005) Falgarone E., Phillips T.G., Pearson J.C., 2005, ApJ 634, L149.
- Flower & Pineau des Forêts (1998) Flower D. R., Pineau des Forêts G., 1998, MNRAS, 297, 1182
- Flower & Pineau des Forêts (2003) Flower D. R., Pineau des Forêts G., 2003, MNRAS, 343, 390
- Garden & Carlstrom (1992) Garden R.P., Carlstrom J.E., 1992, ApJ 392, 602.
- Godard et al. (2009) Godard B., Falgarone E., Pineau des Forêts G. 2009 A&A 495 847
- de Graauw et al. (2010) de Graauw T. et al. 2010, this volume
- Hobbs et al. (2004) Hobbs, L.M., et al. 2004 ApJ 615, 947
- Jakob et al. (2007) Jakob H., Kramer C., Simon R., et al. 2007, A&A 461, 999.
- Kirby (2009) Kirby L., 2009, ApJ 694, 1056.
- Kobayashi et al. (1993) Kobayashi R., Koch H. & Meyer D.N. 1993 Chem. Phys. Lett. 211 94
- Lesaffre et al. (2007) Lesaffre P., Gerin M., Hennebelle P., 2007, A&A, 469, 949
- Marshall et al. (2006) Marshall D.J., Robin A.C., Reylé C., et al. 2006 A&A 453, 635
- Motte et al. (2007) Motte, F., Bontemps, S., Schilke, P. et al. 2007 A&A 476, 1243
- Nadeau & Béland (1988) Nadeau D., Béland S., 1988, AJ 95, 136.
- Oliveira et al (2005) Oliveira C.M., Dupuis J., Chayer P., Moos H.W., 2005, ApJ 625, 232.
- Ossenkopf et al. (2010) Ossenkopf, V., Röllig, M., Simon, R., Schneider, N. et al. 2010, this volume
- Pearson & Drouin (2006) Pearson J.C. & Drouin B.J. 2006 ApJ 647, L83
- Pilbratt et al. (2010) Pilbratt G. et al. 2010, this volume
- Pineau des Forêts et al. (1986 ) Pineau des Forêts G. et al., 1986, MNRAS, 220, 801
- Poglitsch et al. (1996) Poglitsch A., Herrmann F., Genzel R., et al., 1996, ApJ 462, L43.
- Roberts et al. (1997) Roberts D.A., Dickel H.R., Goss W.M., 1997, ApJ 476, 209.
- Roelfsema et al. (1989) Roelfsema P.R., Goss W.M., Geballe T.R., 1989, A&A 222, 247.
- Russell et al. (1992) Russell, A. P. G., Bally, J., Padman, R., Hills, R. E., 1992, ApJ 387, 219.
- Schneider et al. (2010) Schneider N., Csengeri T., Bontemps S. et al., 2010, arXiv1003.4198
- Sternberg & Dalgarno (1995) Sternberg A., Dalgarno A., 1995, ApJS, 99, 565
- van der Tak et al. (2010) van der Tak, F.F.S., Marseille M.G., Herpin F. et al. 2010 this volume
- Wilson et al. (1995) Wilson T.L., et al., 1995, ApJ 452, 693.