Herschel/HIFI deepens the circumstellar NH3 enigma††thanks: Herschel is an ESA space observatory with science instruments provided by European-led Principal Investigator consortia and with important participation from NASA.
Abstract
Context. Circumstellar envelopes (CSEs) of a variety of evolved stars have been found to contain ammonia (NH3) in amounts that exceed predictions from conventional chemical models by many orders of magnitude.
Aims. The observations reported here were performed in order to better constrain the NH3 abundance in the CSEs of four, quite diverse, oxygen-rich stars using the NH3 ortho ground-state line.
Methods. We used the Heterodyne Instrument for the Far Infrared aboard Herschel to observe the NH3 transition near 572.5 GHz, simultaneously with the ortho-H2O transition, toward VY CMa, OH 26.5+0.6, IRC+10420, and IK Tau. We conducted non-LTE radiative transfer modeling with the goal to derive the NH3 abundance in these objects’ CSEs. For the last two stars, Very Large Array imaging of NH3 radio-wavelength inversion lines were used to provide further constraints, particularly on the spatial extent of the NH3-emitting regions.
Results. We find remarkably strong NH3 emission in all of our objects with the NH3 line intensities rivaling those of the ground state H2O line. The NH3 abundances relative to H2 are very high and range from to for the objects we have studied.
Conclusions. Our observations confirm and even deepen the circumstellar NH3 enigma. While our radiative transfer modeling does not yield satisfactory fits to the observed line profiles, it does lead to abundance estimates that confirm the very high values found in earlier studies. New ways to tackle this mystery will include further Herschel observations of more NH3 lines and imaging with the Expanded Very Large Array.
Key Words.:
Stars: AGB and post-AGB – Stars: supergiants – Stars: individual: IK Tau, VY CMa, OH 26.5+0.6, IRC+10420 – circumstellar matter1 Introduction
Ammonia (NH3) was the first polyatomic molecule detected in an astronomical object (Cheung et al. 1968). It is ubiquitous in dark, dense interstellar cloud cores and an eminently useful thermometer of these regions (Walmsley & Ungerechts 1983, Danby et al. 1988). This, aided by the easy observability of its inversion lines – many of the astronomically most important ones crowd around 1.3 cm wavelength (24 GHz frequency) – make NH3 one of the most frequently observed interstellar molecules (Ho & Townes 1983).
NH3 has also been detected toward a still limited, but diverse number of CSEs around evolved stars, first using infrared (IR) heterodyne absorption spectroscopy toward the high mass-loss asymptotic giant branch (AGB), extreme carbon star CW Leo (= IRC+10216; Betz et al. 1979). In addition, absorption was found toward a number of oxygen-rich objects that included the long-period variable (LPV) Ceti (Betz & Goldhaber 1985) and the super- or even hyper-luminous objects VY CMa and IRC+10420 (McLaren & Betz 1980, Monnier et al. 2000). The last study finds that around VY CMa the NH3 is forming at stellar radii away from the star, where dust formation has well started.
Contemporaneously, several radio inversion lines were detected also toward IRC+10216 (Kwok et al. 1981, Bell et al. 1982, Nguyen-Q-Rieu et al. 1984). Later on, high-velocity cm-wavelength NH3 emission plus absorption was found toward the bipolar protoplanetary nebulae (PPNe) CRL 2688 and CRL 618 (Truong-Bach et al. 1988, Martin-Pintado & Bachiller 1992, Truong-Bach et al. 1996). Toward CRL 618, P Cygni profiles are observed with a full width at zero power (FWZP) of km s-1. Menten & Alcolea (1995) detected high-velocity NH3 radio emission toward IRC+10420, the high mass-loss rate LPV IK Tau, and the PPN OH 231.8+4.2. In the last case, they find high-velocity emission over km s-1 FWZP. Recently, Hasegawa et al. (2006) report and discuss observations of the NH3 line central to the present study, the ortho-NH3 transition, toward IRC+10216 made with the Odin satellite.
One common, surprising result of all the above studies is the exceedingly high NH3 abundances they report. Most of them cite values of several times or even relative to molecular hydrogen. These numbers are in stark contrast to the results of thermodynamical equilibrium calculations for the atmospheres of cool stars, which predict the production of only negligible amounts of NH3, of order (Tsuji 1964). The pioneering study of Tsuji has been confirmed by more recent work (see, e.g., Lafont et al. 1982, Cherchneff & Barker 1992, both for C-rich CSEs). Somewhat ad hoc approaches to bringing observations and theory closer together involved injecting a significant amount of NH3 in the inner envelope (Nejad & Millar 1988, Nercessian et al. 1989). Willacy & Cherchneff (1998) include shock chemistry in their model of IRC+10216, but still only produce an abundance of , at least three orders of magnitude below the value implied by observations. As to bona fide shocked regions like PPN outflows, Morris et al. (1987) suggested that, for OH 231.8+4.2, N2, which binds most of the nitrogen, might be dissociated in the high-velocity gas and that the high NH3 abundance might be the result of a series of hydrogenation reactions. Whether this can be confirmed by detailed chemical models remains to be explored.
For the present study, as described in Sect. 2, we observed the NH3 ortho ground-state transition in O-rich stars of widely different natures and mass loss rates: the high mass-loss LPV IK Tau, the peculiar red supergiant VY CMa, the archetypical OH/IR star OH 26.5+0.6, and the hypergiant IRC+10420. We chose a receiver setting that allowed simultaneous observations of the transition of ortho-H2O. All of these objects have dense CSEs, and NH3 has been previously detected toward all of them but OH 26.5+0.6. In particular, for IK Tau and IRC+10420, single-dish observations of the and inversion lines have been reported by Menten & Alcolea (1995). Moreover, the emission in these lines has subsequently been imaged with the NRAO Very Large Array (VLA) with a resolution of a few arcseconds (Menten et al., in prep.; see Sect. 2.3).
The critical density of the cm-wavelength inversion lines is on the order of cm-3, while that of the sub-mm transition has a value orders of magnitude higher. Thus, both types of lines should provide complementary information on different regions of the envelope. In Sect. 3.1, we give a general description of the sub-mm spectra we obtained with HIFI aboard Herschel (Pilbratt et al. 2010, in this volume). Thereafter, in Sect. 3.2, we present radiative transfer calculations conducted to model the observed line profiles, taking advantage of the constraints from the VLA imaging. These lead to NH3 abundance determinations.
2 Observations
2.1 Herschel/HIFI submillimeter observations
The observations were made with the two orthogonal HIFI receivers available for each band, which in all cases work in double side-band (DSB) mode (see de Graauw et al. 2010, in this volume). This effectively doubles the instantaneous intermediate frequency (IF) coverage. We observed the four stars described above with a tuning that, in the upper sideband, covers the frequency of the ground state transition of ortho-NH3 at 572.4981 GHz. The tuning was chosen to also cover the frequency of the ground state line of ortho-H2O at 556.9360 GHz in HIFI’s lower sideband. The observations were obtained using the dual-beam-switching (DBS) mode. In this mode, the HIFI internal steering mirror chops between the source position and a position believed to be free of emission, which was certainly the case for our observations. The telescope then alternately locates the source in either of the chopped beams, providing a double-difference calibration scheme, which allows a more efficient cancellation of the residual standing waves in the spectra. Additional details on this observing mode can be found in Helmich et al. (2010, in this volume). The double sideband system temperature was K, and the calibration uncertainty is estimated to be 10%. Spectral baselines were excellent. Herschel’s beam had a size of FWHM at the observing frequency, which is much larger than the NH3-emitting regions of all our sources.
The HIFI data shown here were obtained using the wide-band spectrometer (WBS), which is an acousto-optical spectrometer, providing a simultaneous coverage of the full instantaneous IF band in the two available orthogonal receivers, with a (oversampled) channel spacing of 0.5 MHz (0.27 km s-1), about half the effective resolution. Spectra in the figures have been resampled and smoothed to a channel spacing of km s-1.
The data were processed with the standard HIFI pipeline using HIPE, and nonstitched Level-2 data were exported using the HiClass tool available in HIPE. Further processing, i.e. blanking spurious signals, first order polynomial baseline removal, stitching of the spectrometer subbands and averaging, was performed in CLASS. Since the quality of the spectra measured in both horizontal and vertical polarization was good, these were averaged to lower the final noise in the spectrum. This approach is justified since polarization is not a concern for the presented molecular-line analysis. All HIFI data were originally calibrated in units of antenna temperature () and were converted to the main-beam temperature () scale according to , with the main-beam efficiency . In all cases we have assumed a side-band gain ratio of one.
2.2 Ammonia spectroscopy and astrophysics
The main focus of this letter is on the line of ortho-NH3. Ammonia microwave spectroscopy has a long history (see, e.g., Townes & Schawlow 1955, Kukolich 1967). Very briefly, because of the possible orientations of the hydrogen spins, two different species of NH3 exist that do not interconvert, ortho-NH3 and para-NH3. Ortho-NH3 assumes states, , with or , where is an integer (all H spins parallel) , whereas for para-NH3 (not all H spins parallel). The principal quantum numbers and correspond to the total angular momentum and its projection on the symmetry axis of the pyramidal molecule.
The temperature corresponding to the energy of the lowest para level () is 22 K above that of the lowest ortho level (). Therefore, for formation in the interstellar gas phase, which involves reactions with high exothermicities, the ortho- to para-NH3 ratio is expected to attain its equilibrium value of unity (Umemoto et al. 1999). This situation is also expected to hold for CSEs, given that the IR studies cited above place the NH3 they observe in the hot medium close to the star.
A high-resolution study of the NH3 transition has very recently been presented by Cazzoli et al. (2009). (Only) its upper state is split into several hyperfine structure (hfs) components with the –2 MHz splitting resulting from the coupling of the quadrupole moment of the N nucleus with the electric field of the electrons. Two of these components are further split by magnetic interactions. The mean frequency is 572498.1 MHz and the centroid frequencies of the three main hfs groups are all within 2 MHz, corresponding to km s-1, much less than the line widths observed for the targets of this study (see Fig. 1).
2.3 VLA observations of inversion lines
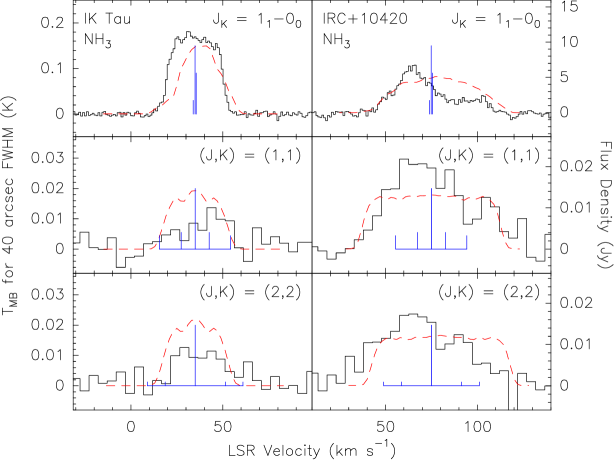
In Sect. 3.2 we use data of the and inversion lines to constrain our models for IK Tau and IRC+10420. For these stars, single-dish observations of those lines made with the Effelsberg 100 meter telescope were reported by Menten & Alcolea (1995). In addition, to place constraints on the spatial distribution of the NH3 molecules, we have used data obtained with the VLA that will be published separately (Menten et al. in prep.). The hfs splitting in the inversion lines in velocity units is much wider than for the rotation line. However, because both the (1,1) and (2,2) lines are very optically thin, as indicated by the spectra and supported by our modeling (see Sect. 3.2), any contribution of the hfs components will be factors of several weaker than the main hfs component and neglected in the modeling. The intensities of the spectra produced from the VLA images, which were restored with a circular beam of ′′ FWHM, used in that section, are consistent with the published 100 m telescope values.
3 Results and analysis
3.1 NH3 versus H2O emission
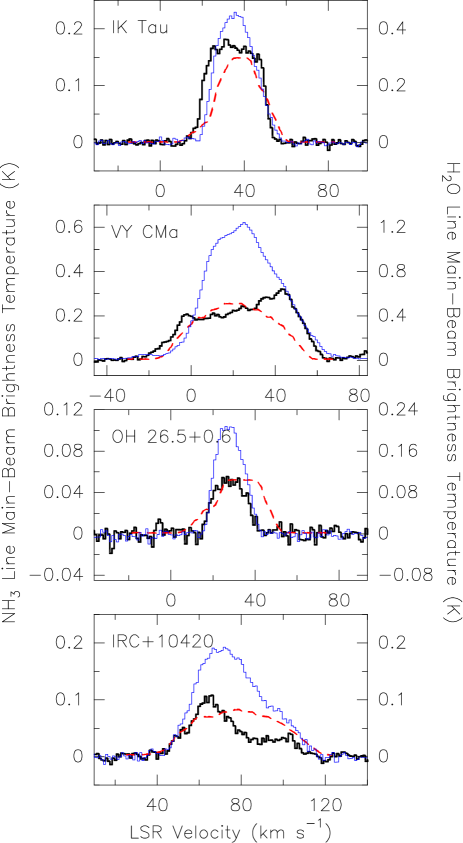
In Figs. 1, 2 and Table 1 we present the results of our HIFI observations of both the NH3 and the H2O ortho ground state lines, together with the results of our NH3 modeling. All our observed positions agree to within with the stars’ 2MASS positions, which themselves have an absolute accuracy of better than ′′ (Cutri et al. 2003). The determination of the LSR ranges is somewhat subjective and the upper and lower velocities are uncertain by a few km s-1 for weaker lines. For all entries, the formal error in is smaller than 0.1 K km s-1. For VY CMa we used the higher of the literature mass-loss rate values scaled to the recently measured trigonometric parallax distance, 1100 pc (Choi et al. 2008). For both IK Tau and IRC+10420 the lower and the higher values of are implied by the cm lines and the submm line, respectively.
Inspecting Fig. 1 and the table, it is striking to see that the luminosity (integrated intensity) in the NH3 and H2O ground-state lines is of comparable magnitude for all of our objects. The NH3/H2O line ratios are and 0.42 for IK Tau, VY CMa, OH 26.5+0.6, and IRC+10420, respectively. One has to keep in mind that H2O is a major molecular constituent of our CSEs, while even the presence of observable NH3 emission is completely unexplained!
Another remarkable result is that the velocity ranges covered by the two lines are almost identical, which suggests that the bulk of the material producing the emission for both is similar. Moreover, for all our targets, both lines’ FWZP values are lower, but comparable to twice the terminal velocity, implying that both molecules are present in the outer layers of the envelope, where the material has almost been fully accelerated. Furthermore, we point out the clear self absorption in the blue wing of the H2O lines toward IK Tau and VY CMa, which proves that the line emitting region covers the whole envelope. Whether this is also true for the NH3 line is a priori not clear.
3.2 Radiative transfer modeling and constraints on abundances
| Object | Lit | ∞ | LSR range | Mod | |||||||
| (kpc) | ( yr-1) | (km s | (km s | (K km s | ( yr-1) | (cm) | (′′) | ||||
| IK Tau | s | 0.25{1} | {2} | 18 {2} | [11.5, 57.2] | 5.1 | 1.3 | (1–3) | |||
| [10.4, 59.5] | 10.3 | ||||||||||
| VY CMa | 07 22 58.3 | 46 03 | 1.1 {3} | (0.8–3.4) {4} | 35 {4} | [, 64.3] | 15.5 | 2.1 | |||
| [, 79] | 51.2 | ||||||||||
| OH26.5+0.6 | 18 37 32.5 | 23 59 | 1.37 {5} | {5} | 16 {6} | [14.6, 43.2] | 0.96 | 1.2 | |||
| [15.0, 43.2] | 3.4 | ||||||||||
| IRC+10420 | 19 26 48.1 | +11 21 17 | 5 {7} | {7} | 38 {7} | [39,112] | 3.1 | 2.0 | (2–5) | ||
| [42.8,116.4] | 7.4 |
The NH3 emission of the sources has been modeled with the Monte Carlo radiative transfer code RATRAN developed and described by Hogerheijde & van der Tak (2000). For NH3, RATRAN uses collision rates calculated by Danby et al. (1988). Power laws for the density and temperature were used to describe the physical structure of the envelope, using as input published values for the mass loss rate and expansion velocity (see Table 1). For IRC+10420, envelope parameters from Dinh-V.-Trung et al. (2009) were used and for IK Tau, VY CMa, and OH26.5+0.6 we refer to the modeling of Decin et al. (2010), Decin et al. (2006), and Justtanont et al. (2006), respectively. The VLA data yield an extent of for the NH3 emitting region around IRC+10420 and ′′ for that around IK Tau, numbers we use for our modeling.
To fit the submm NH3 lines observed with HIFI, the NH3 abundance was varied in a first iteration. For the two sources with additional data from the cm inversion lines, those (para) lines were modeled as well, using an ortho-to-para ratio of 1, appropriate for formation of NH3 under high temperatures (see Sect. 2.2). Interestingly, this does not lead to a satisfying fit for both the cm NH3 inversion lines and the submm ground state line. With a fit adjusted to reproduce the cm lines, the submm line is underestimated by a factor of 10 for IK Tau.
Since high densities are needed to excite the submm line, its emission must arise from the inner part of the envelope, further inward than the cm-line emitting region. Our modeling suggests densities above a few times cm-3 and temperatures in the 10–100 K range. This discrepancy between the physical conditions required to produce the observed cm emission, on the one hand, and the submm emission, on the other, is even greater for the very extended but relatively low-density shell of IRC+10420. To reach densities high enough to excite the NH3 sub-mm line, the mass-loss rate had to be increased to yr-1, i.e., a factor 3 higher than the value derived by Dinh-V.-Trung et al. (2009) and the inner radius reduced to cm, which is twice the value of the hot inner shell proposed by these authors. Then agreement between the abundances obtained from the cm and submm lines can be reached within a factor of 2. Interestingly, De Beck et al. (2010, accepted for publication), derive a value of yr-1 for IRC+10420’s mass loss rate based on multi-transition modeling of CO.
To reproduce the strong submm NH3 line from VY CMa, the highest mass-loss rate and largest radius from the various shells discussed by Decin et al. (2006) had to be used, scaled to pc (see Sect. 3.1). The outer radius that led to a best fit for OH26.5+0.6 is cm. For this source, the same temperature profile as for IK Tau was used.
The line profiles produced by our NH3 model calculations are shown in Figs. 1 and 2 overlaid on the measured spectra. The resulting NH3 abundances for the four observed stars range from to (see Table 1). While they are in line with circumstellar NH3 abundances derived from the inversion lines alone and from IR spectroscopy, we note, as a caveat, that our model calculations did not consider the possibility of IR pumping of the transition. IR pumping of the H2O line in IRC+10216’s CSE via various vibrational bands has been investigated by Agúndez & Cernicharo (2006), who found it to be the dominant source of excitation of this high critical density line over much of the star’s outer envelope. Consequently, their modeling suggests an order of magnitude lower H2O abundance than invoked earlier from SWAS and Odin observations (Melnick et al. 2001, Hasegawa et al. 2006).
4 Summary and outlook
The high critical density of the ortho-NH3 line allows investigations of NH3 in a new density regime of circumstellar envelopes. However, the remarkably high abundances we determine for all our objects confirm and significantly strengthen the finding that this molecule exists in a variety of CSEs at levels not explained by current chemical models. Better constraints on the emitting regions will come from HIFI observations of a number of NH3 lines, which are actually evident in the (heavily spectrally diluted) PACS spectrum of VY CMa (Royer et al. 2010). Given their intensities, such observations appear eminently feasible. They would place tight constraints on future radiative transfer modeling that includes infrared excitation. Additionally, with its extremely wideband new generation digital correlator, the Expanded Very Large Array (EVLA) will allow simultaneous imaging of many NH3 inversion lines. Nevertheless, given the weakness of these lines toward ordinary AGB stars, PPNe being an exception, EVLA observations will be challenging.
References
- Agúndez & Cernicharo (2006) Agúndez, M. & Cernicharo, J. 2006, ApJ, 650, 374
- Bell et al. (1982) Bell, M. B., Kwok, S., Matthews, H. E., & Feldman, P. A. 1982, AJ, 87, 404
- Betz & Goldhaber (1985) Betz, A. L. & Goldhaber, D. M. 1985, in Astrophysics and Space Science Library, Vol. 117, Mass Loss from Red Giants, ed. M. Morris & B. Zuckerman, 83
- Betz et al. (1979) Betz, A. L., McLaren, R. A., & Spears, D. L. 1979, ApJ, 229, L97
- Cazzoli et al. (2009) Cazzoli, G., Dore, L., & Puzzarini, C. 2009, A&A, 507, 1707
- Cherchneff & Barker (1992) Cherchneff, I. & Barker, J. R. 1992, ApJ, 394, 703
- Cheung et al. (1968) Cheung, A. C., Rank, D. M., Townes, C. H., Thornton, D. D., & Welch, W. J. 1968, Physical Review Letters, 21, 1701
- Choi et al. (2008) Choi, Y. K., Hirota, T., Honma, M., et al. 2008, PASJ, 60, 1007
- Cutri et al. (2003) Cutri, R. M., Skrutskie, M. F., van Dyk, S., et al. 2003, 2MASS All Sky Catalog of point sources. (NASA/IPAC Infrared Science Archive)
- Danby et al. (1988) Danby, G., Flower, D. R., Valiron, P., Schilke, P., & Walmsley, C. M. 1988, MNRAS, 235, 229
- Decin et al. (2010) Decin, L., De Beck, E., Brunken, S., et al. 2010, A&A, 516, A69
- Decin et al. (2006) Decin, L., Hony, S., de Koter, A., et al. 2006, A&A, 456, 549
- de Graauw et al. (2010) de Graauw, Th., et al. 2010, A&A, 518, L6
- Dinh-V.-Trung et al. (2009) Dinh-V.-Trung, Muller, S., Lim, J., Kwok, S., & Muthu, C. 2009, ApJ, 697, 409
- Hale et al. (1997) Hale, D. D. S., Bester, M., Danchi, W. C., et al. 1997, ApJ, 490, 407
- Hasegawa et al. (2006) Hasegawa, T. I., Kwok, S., Koning, N., et al. 2006, ApJ, 637, 791
- Helmich et al. (2010) Helmich, F., et al. 2010, A&A, in press
- Ho & Townes (1983) Ho, P. T. P. & Townes, C. H. 1983, ARA&A, 21, 239
- Hogerheijde & van der Tak (2000) Hogerheijde, M. R. & van der Tak, F. F. S. 2000, A&A, 362, 697
- Justtanont et al. (2006) Justtanont, K., Olofsson, G., Dijkstra, C., & Meyer, A. W. 2006, A&A, 450, 1051
- Kemper et al. (2003) Kemper, F., Stark, R., Justtanont, K., et al. 2003, A&A, 407, 609
- Kukolich (1967) Kukolich, S. G. 1967, Physical Review, 156, 83
- Kwok et al. (1981) Kwok, S., Bell, M. B., & Feldman, P. A. 1981, ApJ, 247, 125
- Lafont et al. (1982) Lafont, S., Lucas, R., & Omont, A. 1982, A&A, 106, 201
- Martin-Pintado & Bachiller (1992) Martin-Pintado, J. & Bachiller, R. 1992, ApJ, 391, L93
- McLaren & Betz (1980) McLaren, R. A. & Betz, A. L. 1980, ApJ, 240, L159
- Melnick et al. (2001) Melnick, G. J., Neufeld, D. A., Ford, K. E. S., Hollenbach, D. J., & Ashby, M. L. N. 2001, Nature, 412, 160
- Menten & Alcolea (1995) Menten, K. M. & Alcolea, J. 1995, ApJ, 448, 416
- Monnier et al. (2000) Monnier, J. D., Danchi, W. C., Hale, D. S., Tuthill, P. G., & Townes, C. H. 2000, ApJ, 543, 868
- Morris et al. (1987) Morris, M., Guilloteau, S., Lucas, R., & Omont, A. 1987, ApJ, 321, 888
- Nejad & Millar (1988) Nejad, L. A. M. & Millar, T. J. 1988, MNRAS, 230, 79
- Nercessian et al. (1989) Nercessian, E., Omont, A., Benayoun, J. J., & Guilloteau, S. 1989, A&A, 210, 225
- Nguyen-Q-Rieu et al. (1984) Nguyen-Q-Rieu, Graham, D., & Bujarrabal, V. 1984, A&A, 138, L5
- Pilbratt et al. (2010) Pilbratt, G. L., Riedinger, J. R., Passvogel, T., et al. 2010, A&A, 518, L1
- Royer et al. (2010) Royer, P., Decin, L., Wesson, R., et al. 2010, A&A, 518, L145
- Townes & Schawlow (1955) Townes, C. H. & Schawlow, A. L. 1955, Microwave Spectroscopy (New York: McGraw-Hill, 1955)
- Truong-Bach et al. (1996) Truong-Bach, Graham, D., & Nguyen-Q-Rieu. 1996, A&A, 312, 565
- Truong-Bach et al. (1988) Truong-Bach, Nguyen-Q-Rieu, & Graham, D. 1988, A&A, 199, 291
- Tsuji (1964) Tsuji, T. 1964, Annals of the Tokyo Astronomical Observatory, 9
- Umemoto et al. (1999) Umemoto, T., Mikami, H., Yamamoto, S., & Hirano, N. 1999, ApJ, 525, L105
- Walmsley & Ungerechts (1983) Walmsley, C. M. & Ungerechts, H. 1983, A&A, 122, 164
- Willacy & Cherchneff (1998) Willacy, K. & Cherchneff, I. 1998, A&A, 330, 676
Appendix A NH3 rotational and inversion line spectra and fits for IK Tau and IRC+10420
Fig. 2 shows, for IK Tau and IRC+10420, the HIFI spectra of the ortho-NH3 line and the spectra of the and para-NH3 lines produced from our VLA data together with our best fit model predictions.