Point-contact study of the LuNi2B2C borocarbide superconducting film
Abstract
We present point-contact (PC) Andreev-reflection measurements of a superconducting epitaxial -axis oriented nickel borocarbide film LuNi2B2C (Tc=15.9 K). The averaged value of the superconducting gap is found to be 2.60.2 meV in the one-gap approach, whereas the two-gap approach results in 2.140.36 meV and 30.27 meV. The better fit of the Andreev-reflection spectra for the LuNi2B2C–Cu PC obtained by the two-gap approach provides evidence for multiband superconductivity in LuNi2B2C. For the first time, PC electron-phonon interaction (EPI) spectra have been measured for this compound. They demonstrate pronounced phonon maximum at 8.50.4 meV and a second shallow one at 15.80.6 meV. The electron-phonon coupling constant estimated from the PC EPI spectra turned out to be small (with 0.1), like in other superconducting rare-earth nickel borocarbides. Possible reasons for this are discussed.
pacs:
72.10.Di, 74.45.+c, 74.70DdI Introduction
Among the rare-earth nickel borocarbide superconducting Ni2B2C family, the system with Lu belongs to the nonmagnetic ones with the highest Tc of about 16 K. Although numerous experiments were undertaken to study the superconducting state there, still there is space for more detailed investigation. This is most probably due to the complicated band structure in this compound what may certainly lead to the anisotropy of the superconducting gap or/and multi-band (gap) superconductivity. Point-contact (PC) Andreev reflection spectroscopy is a direct tool to clarify the superconducting gap characteristics, i.e. its value and its anisotropy as well as the temperature and magnetic field dependencies of the gap. Furthermore, PC spectroscopy itself provides a straightforward information as to the PC electron-phonon interaction (EPI) function Naid , which can be a test for the phonon-mediated superconductivity.
Several PC studies were performed on single crystals of LuNi2B2C Bobrov ; Greene . These experiments have shown an anisotropy of the superconducting order parameter (gap). In Ref. Bobrov , the authors claimed that the data are in favor of a two-gap model. A similar conclusion was made also by a study of single crystals and films of the related compound YNi2B2C in Bashlak ; Bashlakov ; raychaudhuri . In this study, we present PC spectroscopy data for epitaxial c-axis oriented LuNi2B2C films in order to compare these data with the results obtained for LuNi2B2C single crystals and to receive information about EPI in LuNi2B2C.
II Experimental details
High-quality LuNi2B2C epitaxial c-axis oriented films with T K have been fabricated using pulsed laser deposition. The details of the film preparation are described in Niemeier . XRD measurements show almost perfect c-axis texture. The films show good homogeneity, very high in-plane and out-of-plane order and high enough for the thin films residual resistivity ratios up to 17 at film thicknesses of 250 nm. The quality of these films compared to single crystals was tested using a sample in the as-grown state for Bc2 measurements. Upper critical field values in the 001 crystallographic direction are higher than those in single crystals (BT Shulga ) and show a less pronounced S-shape behavior.
The PCs were established along the c-direction by the standard ”needle-anvil” method Naid touching of the film surface by a sharpened Cu wire. The differential resistance and the second derivative were recorded by sweeping the dc current on which a small ac current was superimposed using the standard lock-in technique. The measurements were performing in the temperature range =1.5-20 K and in magnetic fields up to 9 T.
II.1 PCS of superconducting energy gap
Spectroscopic information about superconducting energy gap is available in the case if the contact diameter is smaller than the inelastic electron mean-free path as well as than the coherence length (0). LuNi2B2C is characterized at low temperatures by coherence length about 6 nm Shulga and elastic electron mean-free path 10 nm evaluated from the mentioned below value. Estimation of the contact size from its resistance using the Wexler formula Naid
| (1) |
gives 10 nm for the typical PC resistance =10 with 2.7cm and cm2 bhatnagar . Thus, all the mentioned lengths are of the same order of magnitude, therefore it is not possible to say a priori whether investigated PCs are in the ballistic (or diffusive), in other words, in the spectroscopic regime. Independent of the PC resistance (of course the higher the resistance the higher probability to be in spectroscopic regime), each PC spectra should be tested in order to display the spectroscopic features both in the normal (phonons) and superconducting (gap minima) state.
We were able to obtain PC characteristics, which demonstrate clear Andreev-reflection (gap) structures – pronounced minima at at Tc as it is shown in Fig. 1. For the investigated PCs the temperature of the vanishing of the superconducting main minimum in was close to 16 K, that is, close to Tc of the LuNi2B2C film, testifying that superconductivity in the PCs is not degraded. To retrieve the superconducting gap value and other parameters from the Andreev-reflection spectra the generalized Blonder-Tinkham-Klapwijk (BTK) theory BTK is commonly used. The application of the one-gap BTK model to the curves from Fig. 1(bottom panel) results in a moderate fit to the experimental curves. Furthermore, the parameter , which implies a finite lifetime of carriers due to inelastic scattering of charge carriers was found to be rather high (about half of the value) for this PC. Such high as compared to can be connected with the anisotropy of the superconducting gap or a possible two-gap superconductivity. The two-gap(band) model is supported by a recent three-dimensional study of the Fermi surface of LuNi2B2C Dugdale , where contribution to the density-of-states (DoS) at the Fermi energy from 3 bands equal 0.24%, 22.64% and 77.1%, respectively, was found. That is, two bands basically contribute to DoS.
As we can see from Fig. 1(bottom panel) the fitting within the two-gap model gives a much better agreement with the experimental data. Applying the two-gap fit the temperature dependencies of the superconducting gaps , the smearing parameter and the barrier strength were established (see Fig. 2). The so-called scaling parameter corresponding to the ratio of the experimental intensity to the calculated one reflects the quality of the fit and was tried to keep constant and close to 1 at fitting .
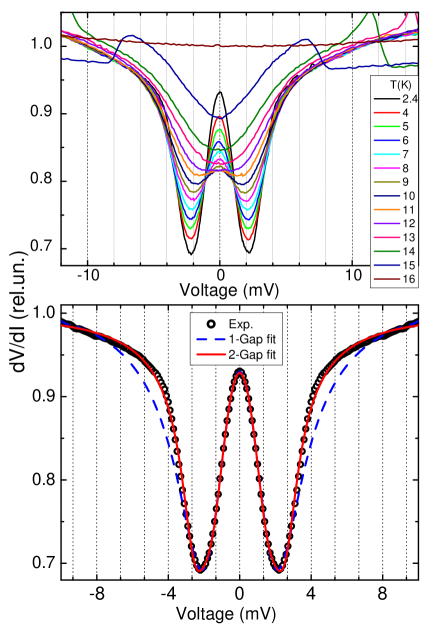
It turned out that the contribution (or weight factor) of both gaps to the spectra is nearly equal =0.5 and the fitting is possible with =0. The latter gives strong support for the used two-gap model which confirms the multiband superconducting state in this compound. We should also note, that with increasing temperature the double minimum structure of smears out above 11 K and this gives more space for the fitting parameters. Therefore their values are less precise by approaching Tc.
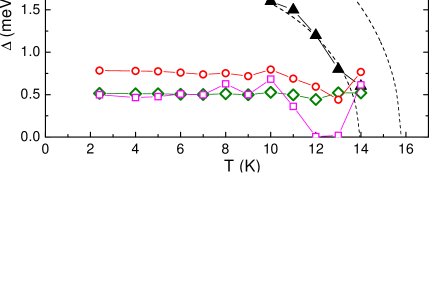
The data for the two superconducting gaps presented in Fig. 2 well agree with results reported for LuNi2B2C single crystals for the c-direction Bobrov . The averaged gap value of 2.60.2 meV for all contacts (about 30) calculated in the one-band approach turned out to be close to the averaged gap of 2.4–2.5 meV reported for PCs on single crystals for the c-direction Bobrov ; Greene .Thus, the quality of the investigated films is comparable to that of the best single crystals. The mean gap values 2.140.36 meV and 30.27 meV established for about 15 PCs from the two-gap approach are also in line with data obtained for LuNi2B2C single crystals Bobrov . The characteristic values of the fitting parameters for the measured contacts are presented in Table I both for the one- as well for the two-gap approach.
| (meV) | (meV) | Z | 2/kTc | |
|---|---|---|---|---|
| Average | 2.60.2 | 0.540.2 | 0.480.06 | 3.80.3 |
| Minimal | 2.12 | 0.22 | 0.32 | 3.21 |
| Maximal | 2.85 | 0.9 | 0.57 | 4.16 |
| (meV) | (meV) | (meV) | (meV) | Z | |
|---|---|---|---|---|---|
| Average | 2.140.36 | 0.36 | 30.27 | 0.25 | 0.47 |
| Minimal | 1.65 | 0 | 2.6 | 0 | 0.32 |
| Maximal | 2.6 | 0.74 | 3.45 | 0.73 | 0.54 |
II.2 PCS of quasiparticle excitations
As it was mentioned in the introduction, the PC spectroscopy makes it possible to study the electron-phonon interaction (EPI). The second derivative of the curve of the ballistic contact at low temperatures is directly proportional to the PC EPI function Naid . The latter can be expressed using measurable signals as
| (2) |
where is the electron charge, is the PC diameter, is the Fermi velocity, and are the rms amplitude of the first and the second harmonics of the modulating signal respectively, which are proportional to the first d/d and the second d/d derivatives of the curve of the investigated PC, respectively.
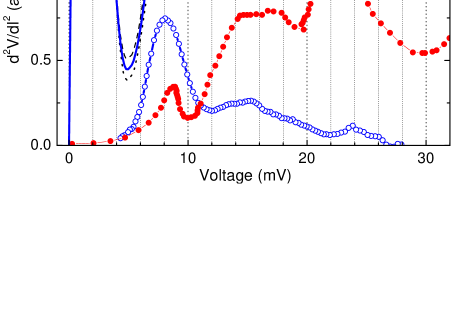
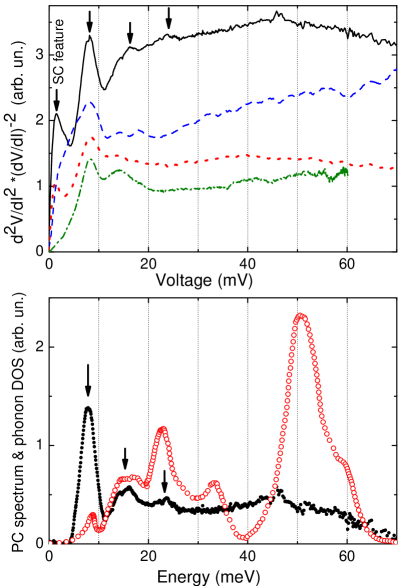
In Fig. 3, the curves of the PC from Fig. 1 are shown. We applied the magnetic field to suppress the superconductivity in the PC, because the magnitude of the superconducting features in the PC spectra near zero bias is much larger than that of the maxima caused by the EPI. As we can see from Fig. 3, the magnetic field of 7 T was not high enough to suppress the superconductivity completely (B 9 T at 2 K Niemeier ) and the huge feature at bias about 2 mV is due to the residual superconductivity. Besides the feature due to the superconducting gap, a clear-cut maximum slightly above 8 mV and a more smeared one at around 15 mV are well distinguished (see Fig. 3). The mentioned peaks correspond to the low energy phonon maxima in the phonon DOS of LuNi2B2C Gompf (see Fig. 3, symbols). Whereas the high energy part of the obtained PC spectra contains no visible features. In Fig. 4, we present a set of curves for different PCs measured up to bias voltages of about 80 mV. By analyzing all of obtained PC spectra (about 30) with the visible phonon features, we have found, that the curves of the LuNi2B2C PCs display phonon maxima at 8.50.4 mV and 15.51.0 mV (averaged for 8 PC) similarly to the PC from Fig. 3. In contrast they do not contain contributions from the other phonon peaks at 23, 33, and 50 mV observed in the phonon DOS of LuNi2B2C (shown in Fig. 4 by the circle symbols). Only the PC with in Fig. 4 shows a weak hump at 23 mV. The reason for the absence of contribution at high-energy phonon maxima could be a deviation from the ballistic (spectroscopic) regime at higher voltages due to increase of the EPI and a shortening of the inelastic mean free path of electrons. It is worth to mention that in Dervenagas ; Stassis phonon softening of two branches was observed below Tc. In our case, we did not observe these modes around 4-5 meV, probably because we have measured PC EPI spectra by suppressing the superconducting state, while in other case a huge gap maximum makes it impossible to see any other features below 5-6 meV (see, e.g., Fig. 3, where the superconducting state is not fully suppressed). Another interesting question arises, whether it is possible to separate the contribution of each (two) bands to the PC EPI spectrum? The problem here is similar to the analogous one raised in the tunneling spectroscopy in Dolgov , where the authors concluded that it is not possible to obtain several band splitted EPI functions from a single function of the tunnel current.
After subtraction of the background from the measured PC spectra we established the EPI function according to (2) (using maximal cm/s calculated for LuNi2B2C bhatnagar ) and estimated the EPI parameter . The latter even for the spectra with the maximal intensity was found to be not bigger than 0.1. This value is an order of magnitude smaller than the values between 0.5 and 1 from dHvA data for the - direction of LuNi2B2C Bergk ; Isshiki or estimated from STM measurements on LuNi2B2C Martinez . Such small values of could be due to some simplifications of the PC spectroscopy theory where only the free electron model and a single band Fermi surface are used. Some issues of evaluation from PC spectra were discussed in Naidyuk . Most of all, the coupling constants estimated from PC spectra should be considered as lower bonds for the coupling constant relevant for superconductivity. Here we also would like to mention that the discussed parameter is some kind of transport EPI constant and in general its value is different from the Eliashberg EPI constant (see Table 3.1 in Naid ), but the difference by one order of magnitude is of course confusing. The calculation of the PC EPI function may shed light on this issue. It will allow to separate the bands contributions, to estimate the integral intensity of the spectrum and to determine the relative contribution of each phonon branch to the PC EPI spectrum. Sure, it would be a very helpful, but also a sophisticated task and it is beyond the scope of this experimental paper.
Another reason for a reduced intensity of the measured PC spectra might be the elastic scattering, which can be larger in the PC core than in the bulk sample due to less perfect surface properties and stresses at the PC formation. As follows from the PC spectroscopy theory, the magnitude of nonlinearity in PC spectra is proportional to Kulik in the diffusive regime . Fig. 5 shows the intensity of the main peak in the PC spectra, which indeed shows strong scattering in the range of about one order. Since we do not see any trend in the intensity of the main peak vs PC resistance which related to the PC size (diameter), we expect that the spectra with the higher intensity are in (or close to) the ballistic regime. Thus, deviation from the ballistic regime of the current flow in the investigated contacts can not be the reason of small values, which were calculated for the PCs with the maximal intensity.
Similar low values as we found for LuNi2B2C were obtained also from the PC spectra of YNi2B2C, HoNi2B2C Bashlakov ; Naidyuk ; Yanson and recently for TmNi2B2C (not yet published). There is also general similarity of PC spectra for the mentioned compounds which are characterized by a prevailing first phonon maximum (excluding CEF peaks in HoNi2B2C and TmNi2B2C). As mentioned above, by determining from PC spectra one can underestimates the superconducting EPI. In this context, a notable large =0.85 was reported for one special PC spectra of DyNi2B2C, while = 0.25 was found for more typical PC spectra of this compound BobrovDy . However, there by calculating the low energy intensive ”magnetic” peak at 5 mV was also taken into account, which gives about half of the value. Therefore, the concerning EPI contribution to in DyNi2B2C is again close to 0.1, if we eliminate the mentioned extra high value and the ”magnetic” peak contribution to .

III Conclusion
We investigated the superconducting energy gap and EPI in LuNi2B2C using an epitaxial c-axis oriented film by PC spectroscopy. The mean value of the superconducting gap is found to be about 2.60.2 meV (2/kT) in the one-gap model what is very close to the values reported for PC measurements on single crystals Bobrov ; Greene . However, the fitting of curves favors the two-gap approach which provides strong support for the multiband superconducting state in this compound. For the two-gap approach the averaged gap values are found to be 2.140.36 meV and 30.27 meV.
For the first time for LuNi2B2C, we succeeded to measure EPI PC spectra with the distinct phonon peaks at 8.50.4 mV and 15.80.6 meV. Therefore, we can conclude that these low energy phonons play a preferential role in the pairing mechanism. The EPI spectra are in general similar to those measured for other nickel borocarbides Bashlakov ; Naidyuk ; Yanson ; BobrovDy showing predominance of the first phonon peak in EPI for all these compounds.
Acknowledgements
Two of the authors (O.E.K., Yu.G.N.) would like to thank the Alexander von Humboldt Foundation for the support, Dr. S.-L. Drechsler for the useful discussions and Dr. K. Nenkov for the technical assistance.
References
- (1) Yu. G. Naidyuk and I. K. Yanson, Point Contact Spectroscopy, Springer Series in Solid-State Sciences, Vol.145 (Springer, New York, 2004).
- (2) N. L. Bobrov, S. I. Beloborod ko, L. V. Tyutrina, I. K. Yanson, D. G. Naugle, and K. D. D. Rathnayaka, Phys. Rev. B 71 014512 (2005), N. L. Bobrov, S. I. Beloborod’ko, L. V. Tyutrina, V. N. Chernobay, I. K. Yanson, D. G. Naugle, K. D. D. Rathnayaka, Low Temp. Phys., 32, 489 (2006) [Fiz. Niz. Temp., 32, 641 (2006)].
- (3) Xin Lu, W. K. Park, Jung-Dae Kim, Sunmog Yeo, Sung-Ik Lee, L. H. Greene, Physica B 403 (2008) 1098; Xin Lu, W. K. Park, Ki-Young Choi, Sung-Ik Lee, Sunmog Yeo, Sergey L. Budko, Paul C. Canfield and L. H. Greene, Journal of Physics: Conference Series 150 052143 (2009).
- (4) D. L Bashlakov, Yu. G. Naidyuk, I. K. Yanson, S. C. Wimbush, B. Holzapfel, G. Fuchs and S-L. Drechsler, Supercond. Sci. Technol. 18 1094 (2005).
- (5) D. L. Bashlakov, Yu. G. Naidyuk, I. K. Yanson, G. Behr, S.-L. Drechsler, G. Fuchs, L. Schultz and D. Souptel, J. of Low Temp. Phys., 147, 336 (2007).
- (6) P. Raychaudhuri, G. Sheet,S. Mukhopadhyay and H. Takeya, Physica C, 460-462, 95 (2007).
- (7) T. Niemeier, R. Huhne, A. Kohler, G. Behr, L. Schultz, B. Holzapfel, Journal of Physics: Conference Series 150, 052185 (2009).
- (8) S. V. Shulga, S.-L. Drechsler, G. Fuchs, K.-H. Müller, K. Winzer, M. Heinecke, and K. Krug, Phys. Rev. Lett. 80, 1730 (1998).
- (9) A. K. Bhatnagar, K. D. D. Rathnayaka, D. G. Naugle, and P. C. Canfield, Phys. Rev. B 56 437 (1997).
- (10) G. E. Blonder, M. Tinkham and T. M. Klapwijk, Phys. Rev. B 25, 4515 (1982).
- (11) F. Gompf, W. Reichardt, H. Schober, B. Renker, M. Buchgeister, Phys. Rev. B 55, 9058 (1997).
- (12) P. Dervenagas, M. Bullock, J. Zarestky, P. Canfield, B. K. Cho, B. Harmon, A. I. Goldman, and C. Stassis, Phys. Rev. B. 52, R9839 (1995).
- (13) C. Stassis, M. Bullock, J. Zarestky, P. Canfield, A. I. Goldman, G. Shirane and S. M. Shapiro, Phys. Rev. B. 55, R8678 (1997).
- (14) O. V. Dolgov, R. S. Gonnelli, G. A. Ummarino, A. A. Golubov, S. V. Shulga, and J. Kortus, Phys. Rev. B 68, 132503 (2003).
- (15) S. B. Dugdale, C. Utfeld, I. Wilkinson, J. Laverock, Zs. Major, M. A. Alam and P. C. Canfield, Supercond. Sci. Technol. 22 014002 (2009).
- (16) B. Bergk, V. Petzold, H. Rosner, S.-L. Drechsler, M. Bartkowiak, O. Ignatchik, A. D. Bianchi, I. Sheikin, P. C. Canfield, and J. Wosnitza, Phys. Rev. Lett. 100, 257004 (2008); B. Bergk and J. Wosnitza, Low Temp. Phys., 35 686 (2009) [Fiz. Nizk. Temp. 35, 872 (2009)] .
- (17) T. Isshiki, N. Kimura, H. Aoki, T. Terashima, S. Uji, K. Yamauchi, H. Harima, D. Jaiswal-Nagar, S. Ramakrishnan, and A. K. Grover, Phys. Rew. B 78 134528 (2008).
- (18) P. Martinez-Samper, H. Suderow, S. Vieira, J. P. Brison, N. Luchier, P. Lejay, and P. C. Canfield, Phys. Rev. 67 014526 (2003).
- (19) I. O. Kulik and I. K. Yanson, Sov. J. Low Temp. Phys. 4, 596 (1978) [Fiz. Nizk. Temp. 4, 1267 (1978)]
- (20) Yu. G. Naidyuk, O. E. Kvitnitskaya, I. K. Yanson, G. Fuchs, K. Nenkov, A. Walte, G. Behr, D. Souptel, and S.-L. Drechsler, Phys. Rev. B 76, 014520 (2007).
- (21) I. K. Yanson, V. V. Fisun, A. G. M. Jansen, P. Wyder, P. C. Canfield, B. K. Cho, C. V. Tomy, and D. McK. Paul, Low Temp. Phys., 23, 712 (1997) [Fiz. Nizk. Temp., 23, 951 (1997)].
- (22) I. K. Yanson, N. L. Bobrov, C. V. Tomy, D. Mc. K. Paul, Physica C 334, 152 (2000).