Thickness dependent structural and electronic properties of adsorbed on SrTiO3(100): a hybrid density functional theory study
Abstract
We discuss the structural and electronic properties of tetragonal CuO grown on (100) by means of hybrid density functional theory. Our analysis explains the anomalously large Cu-O vertical distance observed in the experiments (2.7Å) in terms of a peculiar frustration between two competing local Cu-O environments characterized by different in-plane and out-of-plane bond lengths and Cu electronic populations. The proper inclusion of substrate effects is crucial to understand the tetragonal expansion and to reproduce correctly the measured valence band spectrum for a CuO thickness of 3-3.5 unit cells, in agreement with the experimentally estimated thickness.
pacs:
68.35.bt, 73.61.Le, 71.15.-mI Introduction
Very recently, Siemons et al. siemons synthesized CuO with a tetragonal (i.e. elongated rock salt structure) on a SrTiO3(100) substrate. In a subsequent theoretical study tet2 we investigated bulk phases of tetragonal CuO by applying a hybrid density functional theory approach, which is able to deal with the electronic, ionic and magnetic properties of such a system. Studying a variety of magnetic orderings we obtained two energy minima as a function of tetragonal distortion. The antiferromagnetically ordered phase (denoted as TET2) with a tetragonal distortion of =1.377 appeared to be the most stable one with its lattice parameters being in very good agreement with the experimental results. Furthermore, for the TET2 phase we predicted a very high Neél temperature (TN) of 800 K, which would perfectly fit the trend of TN for the 3d-transition metal monoxidessiemons . Also, the calculated density of states of the TET2 phase agreed well with the experimental valence band spectrum with the exception of a few residual differences related to the structure of the main peak and the presence of an additional peak in the low energy spectrum which we have attributed to surface/substrate effects not taken into account in our previous analysis.
The aim of the present work is now, to corroborate our basic findings for the artificial TET2 phase by modelling experiment as realistically as possible. This is what we do by describing the adsorbate system in terms of an (100) slab for varying thicknesses of CuO layers [with n denoting a CuO coverage of 2,3,3.5 and 4 unit cells (u.c.)].
Shortly after the publication of our bulk CuO study, a further theoretical study appeared, which was based on the self-interaction-corrected local-density functional method. peralta Again, for a variety of magnetic orderings two energy minima were found as a function of the tetragonal distortion, but the values were much closer to 1 than in our work and, consequently, in worse agreement with the experimentally observed ratio of 1.357. Therefore, the present study also serves the purpose to buttress the theoretical capability of our applied hybrid density functional theory approach and to understand the nature of the exceptionally large vertical elongation observed in SrTiO3 supported CuO.
II Computational Aspects
Because standard density functional theory applications fail in correctly describing the ground state of 3d-transition metal monoxides, a more sophisticated (and much more costly) approach has to be chosen. Therefore, for the present study we apply hybrid density functional theorybecke93 based on the Heyd-Scuseria-Ernzerhof (HSE) methodkrukau as implemented in the Vienna ab initio simulation package (VASP)gk1 ; gk2 ; gk3 . All the corresponding technical parameters were the same as in our recent study tet2 of tetragonal bulk CuO. In particular, 1/4 of short-ranged Hartree Fock exchange was admixed to the generalized-gradient-approximation exchange-correlation functional. The adsorbate systems (100) (n=2,3,3.5 and 4 unit cells) were modelled by a repeated slab scheme containing up to 62 atoms per slab for the highest coverage. Figures 1 and 2 sketches the basic layer-wise atomic arrangements. All atomic positions of CuO layers were fully relaxed, whereas for the substrate the lowest 5 bottom layers, corresponding to a full unit cell, were kept fixed. The lateral lattice parameter =3.90 Å for was taken from the recent VASP-based HSE study by R. Wahl and coworkers wahl . Indeed, the optimal HSE value of is in very good agreement with the measured lattice constant =3.900 Å cao . In order to make the HSE computations feasible, ferromagnetic (FM) ordering was assumed although a specific antiferromagnetic ordering appeared to be energetically more stable in the ideal tetragonal bulk phase. tet2 Nevertheless, also because of the small magnetic Cu-moments of about 0.7 we expect only a small influence of the magnetic ordering on the structural relaxations and valence band spectrumfranchinijcp , which are the aim of study of our present work on the (100) substrate system. The k-points integration for the structural optimization runs has been done by using a 44 two dimensional Monkhorst-Pack grid, which was increased to 66 for the final electronic relaxation.
III Results and Discussion
III.1 Structural Properties
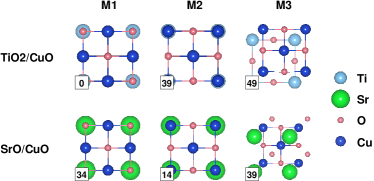
For finding the energetically most stable atomic arrangement several terminations of the (100) substrate and stacking of the CuO adsorbate have been investigated. Fig. 1 sketches all the studied cases: the substrate is either TiO2 or SrO terminated. CuO layers may be accommodated in several ways: (i) Cu on top of oxygen atoms (M1), (ii) Cu on top of Ti or Sr atoms (M2) or (iii) Cu and O in hollow sites (M3). These (FM) calculations have been done by placing 2 CuO unit cells (5 CuO layers) on SrTiO3 (6 unit cells). Fig. 1 shows that the terminated M1 structure is the most stable one. It should, however, be noted that rather close in energy (only 14 meV/Å2 less stable) is the SrO terminated M2 stacking.
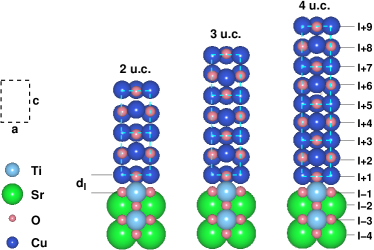
From now on, we only discuss the TiO2 terminated M1 structure. We study the evolution of the structural and electronic properties of the (100) adsorbate system for a CuO coverage of n=2,3,3.5 and 4 unit cells. This choice is based on the experiments estimate, that a tetragonal CuO-layer consisting of 3 to 4 unit cells can be grown on (100)siemons . The corresponding structural models are displayed in Fig 2.
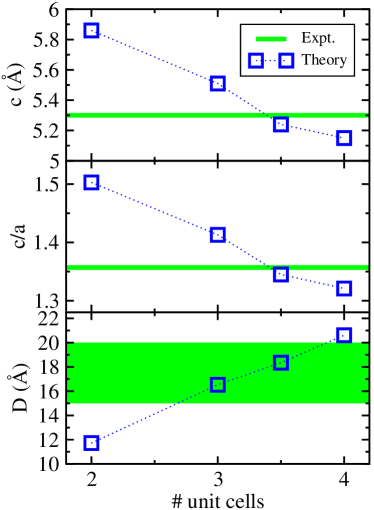
The structural properties are summarized in Fig.3 and Table 1. Fig. 3 illustrates that theoretical and experimental geometrical properties agree well when in the calculation the CuO coverage is 3.5 unit cells, which is also in the estimated range of the experimentally derived thickness (parameter in Table 1). The experimental value of =1.357 is close to the theoretical value of 1.345, which compares favorably to =1.377 as obtained from the HSE study for the ideal bulk TET2 phase.tet2 In general, when increasing the number of unit cells and decrease as shown in Table 1.
The analysis of the interlayer distances reveals that inside the SrTiO3 substrate the interface effects are healed out rather rapidly. Only the distance of the layer closest to the interface (I-1/I-2) experiences a distinct shortening, as it is also the case for the CuO layer at the interface (I+1/I-1). On the other hand, the CuO layer distances appear to be quite sensitive to the thickness of adsorbed CuO. For coverage of 2 and 3 unit cells the distances are significantly larger than the reference value of 2.69 Å which was derived from the ideal TET2 bulk study. For coverage larger than 3 unit cells the distances between the inner CuO layers are significantly shortened, whereas the top 2 layers expand outwards. This change in bond length is reflected by the change of ionicity of Cu, as will be discussed in the following.
| 2 u.c. | 3 u.c. | 3.5 u.c | 4 u.c. | Expt.siemons | |
|---|---|---|---|---|---|
| 5.86 | 5.51 | 5.24 | 5.15 | 5.3 | |
| 1.503 | 1.413 | 1.345 | 1.321 | 1.357 | |
| 11.72 | 16.53 | 18.35 | 20.61 | 15-20 | |
| I+9/I+8 | 2.82 | ||||
| I+8/I+7 | 2.87 | 2.70 | |||
| I+7/I+6 | 2.84 | 2.80 | 2.63 | ||
| I+6/I+5 | 2.78 | 2.61 | 2.56 | ||
| I+5/I+4 | 3.03 | 2.85 | 2.57 | 2.53 | |
| I+4/I+3 | 2.93 | 2.72 | 2.49 | 2.46 | |
| I+3/I+2 | 2.90 | 2.65 | 2.44 | 2.43 | |
| I+2/I+1 | 2.93 | 2.73 | 2.58 | 2.49 | |
| I+1/I-1 | 2.47 | 2.37 | 2.37 | 2.29 | |
| I-1/I-2 | 1.88 | 1.88 | 1.86 | 1.82 | |
| I-2/I-3 | 2.00 | 2.00 | 1.97 | 1.92 | |
| I-3/I-4 | 1.95 | 1.94 | 1.94 | 1.90 | |
| I-4/I-5 | 1.97 | 1.97 | 1.94 | 1.90 | |
| I-5/I-6 | 1.98 | 1.94 | 1.95 | 1.92 | |
| I-6/I-7 | 1.98 | 1.95 | 1.95 | 1.92 | |
| I-7/I-8 | 1.95 | 1.95 | 1.96 | 1.94 | |
| bulk | 1.95 | 1.95 | 1.95 | 1.95 | 1.95 |
III.2 Electronic Properties
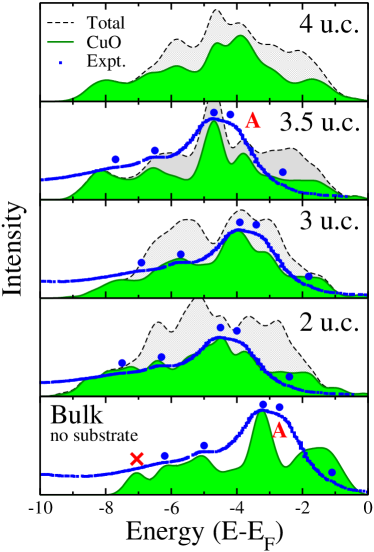
Figure 4 compares the HSE calculated density of states (DOS) with the experimental valence band spectrum. It is obvious that the total as well as the local CuO-projected DOS is rather sensitive to the thickness of the CuO block. Strikingly, the calculated DOS for the ideal TET2 bulk phase and for the system with n=3-3.5 unit cells coverage agree well with experiment, quite in contrast to all cases. Though the superstructure with 2 CuO u.c. already displays some film features which are not reproduced in the calculated bulk spectrum (such as the appearance of the peak A), the overall comparison with the measured curve is not satisfactory due to (i) a much too dominant presence of substrate-related states which weaken the intensity of the main CuO peaks around -4 eV and (ii) the lack of a one-to-one correspondence between theoretical and experimental peaks.
As was discussed for the bulk phase TET2 tet2 , the agreement with experiment is rather good with the exception of one missing peak (indicated by the letter A in Fig. 4) and one extra peak (indicated by the cross) in the calculated spectrum. From the DOS for n=3-3.5 one clearly deduces that the experimental structure is reproduced very well (especially for 3.5 u.c.) and the overall agreement is improved with respect to the ideal bulk phase. In particular, a new peak (A) is found due to the CuO interface layer (the local CuO DOS has a very distinctive peak at this energy position, which is also reflected in the total DOS) and the spurious peak found in the ideal bulk phase disappears. Finally, according to the DOS for n= in Fig. 4 the highest experimental peak, can now be mainly attributed to the substrate, because there the local CuO DOS shows a weak depression, again in line with the observed valence band spectrum.
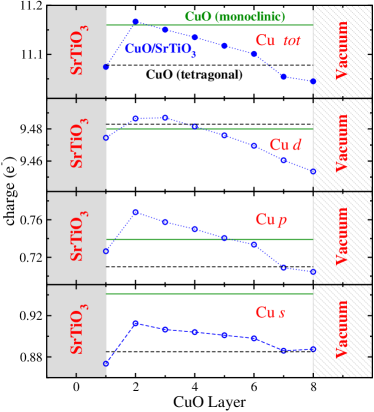
Figure 5 illustrates the layer dependent change of ionicity of the Cu atoms decomposed over the orbital quantum number . A comparison with the corresponding bulk values for both the monoclinic and tenorite structures is also given. Leaving out the layer distance at the interface there is a uniform trend to be seen: with increasing distance from the interface the Cu charge is reduced by about 0.15 (i.e. the ionicity of the positive Cu-ions increases). This change in charge/valency (topmost panel) is mostly due to the change of p- and d-like charges (2nd and 3rd panel from the top). For the two Cu layers closest to the surface the total Cu charge is even less than for the tetragonal bulk phase. This increase in valency is directly accompanied by an increase in the interlayer distance, as clearly illustrated by Table 1.
In general, an increase in bond length corresponds to an increase in ionicity: typical Cu-O bond lengths involving Cu2+ ions are of the order of 2 Å whereas for Cu3+ the value might strongly increase up to 2.75 Å (see Ref. well87, ). In our case, the increase in interlayer distance corresponds to the stretching of the Cu-O bond in the vertical direction (perpendicular to the Cu-O layers). According to Table 1 for the topmost layer of the n=3.5 case the bond length is 2.87 Å, being well in the bond length regime of Cu3+ ionicity. On the other hand, the in-plane bond lengths –due to the SrTiO3 substrate or the lattice parameter =3.91 Å of the optimized bulk TET2 phase– correspond rather well to an ionicity of Cu2+. On the basis of our present surface and recent bulk TET2 study it seems that the Cu atoms appear in two competing concurrent ionic states, depending on the directions of the Cu-O bonds.
Our interpretation of the layer-dependent modulation of the Cu electronic population and Cu-O bond lengths suggesting a peculiar coexistence of Cu2+-like and Cu3+-like behavior is in line with the combined DFT and photoelectron spectroscopy study on copper oxide clusters presented by L.-S. Wang and coworkerswang96 . By investigating the structural and electronic properties of CuOx (=1-4) these authors report a significant change both in the Cu-O bond length (0.05 Å) and Cu charge (0.1) going from Cu2O2 (Cu2+) to Cu2O3 (Cu3+).
We can attribute the relatively small charge difference between bulk and surface Cu ions (0.15 ), to the aforementioned completion between Cu2+-like and Cu3+-like environments. To support further this interpretation we have calculated the charge difference between 2+ and 3+ Mn ions in MnO and Mn2O3 using the optimized data provided in Ref. mno, . Indeed, the resulting value of 0.38 , by far smaller than the expected difference of 1 electron which would result from a simplified ionic picture, is twice larger than the corresponding Cu-difference in our frustrated CuO/SrTiO3 superstructure.
Finalizing the discussion of the electronic structure, the gap of the ideal TET2 phase of 2.7 eV is strongly reduced when CuO is grown on : for a coverage of 3.5 unit cells the gap formed by CuO states is reduced to about 0.6 eV, which for the total system (now including substrate states) is even more reduced to about 0.5 eV. The average local magnetic moment for Cu is about 0.75 , which is enhanced in comparison to 0.63 of the bulk TET2 phase. It should be noted that the present calculation for the surface system (100) was done for ferromagnetic ordering (in order to make the HSE calculation feasible) whereas for the bulk TET2 calculation the most stable phase was found for some particular antiferromagnetic ordering tet2 . However, in Ref. tet2, studying several magnetic orderings it was found, that the local Cu moment is rather insensitive to the specific alignment of spins.
III.3 Summary
Summarizing, our first principles study on the (100) adsorbate system based on a hybrid density functional theory approach describes and explains the recent experiments siemons rather well, which corroborates our findings and predictions for the ideal bulk (without substrate) TET2 phase tet2 . The analysis of our calculated results for structural and electronic properties indicates that the physical properties of the Cu-O bonds are rather peculiar. In particular, we find that the enormous structural anisotropy of the Cu-O sublattice –which determines the experimentally observed tetragonal symmetry– can be understood in terms of a layer dependent evolution of the Cu ionicity which increases progressively towards the surface. Ultimately, the local structural and electronic Cu-O environment appears very frustrated as a results of the coexistence between two concurrent states attributable to an in-plane Cu2+-like and out-of-plane Cu3+-like arrangements.
IV Acknowledgments
Research in Vienna was sponsored by the FP7 European Community grant ATHENA. Support by the FWF, project nr. F4110-N13 is gratefully acknowledged. Research at the Shenyang National Laboratory for Materials Science was sponsored by the Materials Processing Modeling Division. X.-Q.C acknowledges the support from the “Hundred Talents Project” of Chinese Academy of Science. All calculations have been performed on the Vienna Scientific Cluster (VSC).
References
- (1) W. Siemons, G. Koster, D.H.A. Blank, R.H. Hammond, T.H. Geballe, and M.R. Beasley, Phys. Rev. B 79, 195122 (2009).
- (2) Xing-Qiu Chen, C.L. Fu, C. Franchini, and R. Podloucky, Phys. Rev. B 80, 094527 (2009).
- (3) G. Peralta, D. Puggioni, A. Filippetti, and V. Fiorentini, Phys. Rev. B 80, 140408(R) (2009).
- (4) A. D. Becke, J. Chem. Phys. 98, 1372 (1993).
- (5) A. V. Krukau, et. al. Chem. Phys. 125, 224106 (2006).
- (6) G. Kresse and J. Hafner, Phys. Rev. B 48, 13115 (1993).
- (7) G. Kresse and J. Furthm"uller, Comput. Mater Sci. 6, 15 (1996).
- (8) J. Paier, R. Hirschl, M. Marsman, and G. Jresse, J. Chem. Phys. 122, 234102 (2005).
- (9) R. Wahl, D. Vogtenhuber, and G. Kresse, Phys. Rev. B. 78 104116 (2008).
- (10) L. Cao, E. Sozontov, and J. Zegenhagen, Phys. Status Solidi A 181, 387 (2000).
- (11) C. Franchini, J. Zabloudil, R. Podloucky, F. Allegretti, F. Li, S. Surnev, F.P. Netzer, J. Chem. Phys. 130, 124707 (2009).
- (12) A.F. Well, Structural Inorganic Chemistry, 5th ed. (Oxford University Press, New York, 1987).
- (13) L.-S. Wang, H. Wu, S.R. Desai, and L. Lou, Phys. Rev. B. 53 8028 (1996).
- (14) C. Franchini, R. Podloucky, J. Paier, M. Marsman, and G. Kresse, PRB 75, 195128 (2007).