Age distributions of star clusters in spiral and barred galaxies as a test for theories of spiral structure
Abstract
We consider models of gas flow in spiral galaxies in which the spiral structure has been excited by various possible mechanisms: a global steady density wave, self-gravity of the stellar disc and an external tidal interaction, as well as the case of a galaxy with a central rotating bar. In each model we estimate in a simple manner the likely current positions of star clusters of a variety of ages, ranging from Myr to around Myr, depending on the model. We find that the spatial distribution of cluster of different ages varies markedly depending on the model, and propose that observations of the locations of age-dated stellar clusters is a possible discriminant between excitation mechanisms for spiral structure in an individual galaxy.
1 Introduction
Understanding the nature and origin of spiral structure in galaxies is still a fundamental problem in astrophysics. It is evident that in many galaxies spiral structure is driven by tidal effects, either externally by interaction with a companion, or companions, or internally by a central rotating bar. It is worth noting than the possibility of tidal excitation is not precluded by the apparent absence of a visible perturber, because orbiting clumps of dark matter might be responsible (Tutukov & Fedorova, 2006; Dubinski et al., 2008). Indeed, some authors have argued that all spiral structure is driven in this manner (e.g. Kormendy & Norman 1979; Bottema 2003). However determining whether all spiral structure is tidally induced is not a simple observational problem.
There is also the possibility, at least from theoretical considerations, that some spirals can be self-excited. Here two distinct possible mechanisms for the excitation of spiral structure have been proposed. First, there is the argument that spiral structure is the result of quasi-steady, global modes in the stellar disc (Lin & Shu, 1964; Bertin et al., 1989). This is commonly referred to as ‘density wave theory’. Second there is the suggestion that spiral structure is the result of local, transient self-gravitational instabilities (Toomre, 1964) which shear to form short-lived spiral arms (Toomre, 1990; Sellwood & Kahn, 1991). Early numerical simulations of this process (Sellwood & Carlberg, 1984) indicated that such activity might be short lived, in the absence of some other phenomenon, such as gas accretion, which could act to reduce the stellar dispersion velocity, and so maintain the disc close to the borderline for self-gravitational instability. However, more recent, higher resolution simulations suggest that the activity can last for a substantial fraction of a Hubble time (Fujii et al., 2010).
One problem, highlighted in a recent review (Sellwood, 2010), is that it is difficult to find observational tests to distinguish between the various theoretical models. In fact the usual observational approach seems to be to assume one model (usually the assumption is that there is a well-defined global pattern speed), and to then interpret the observations in terms of that particular model (e.g. Elmegreen et al. 1989; Kendall et al. 2008; Martínez-García et al. 2009). Several authors have tried to infer pattern speeds by use of colour gradients to observe a transition in stellar ages across the spiral arms (Efremov & Ivanov, 1982; Regan & Wilson, 1993; Beckman & Cepa, 1990; Gonzalez & Graham, 1996; Martínez-García et al., 2009). However with the exception of one or two cases, there is rarely an identifiable trend in the colour gradients.
For nearby galaxies, it is also possible to study the ages of individual clusters (Anders et al., 2004; Fall et al., 2005; Scheepmaker et al., 2007; Fall et al., 2009; Bastian et al., 2009). This technique involves fitting the UBVI H magnitudes to those predicted by stellar population and starburst models, and then estimating an age for each star cluster. Estimates of ages are thought to be accurate to within factors of around two, and ages can be derived from around 1 Myr to around 100 Myr. This method has been applied to the LMC and SMC (Hunter et al., 2003; de Grijs & Anders, 2006; Chandar et al., 2010), and interacting galaxies, the Antennae (Fall et al., 2009) and M51 (Bik et al., 2003; Kaleida & Scowen, 2010). So far, the age-dating of clusters has been largely used to examine intrinsic properties of clusters, e.g. the cluster IMF, age mass relation, size age relation. However if one can assume that in spiral galaxies such stellar clusters form predominantly in regions of high gas density, for example predominantly within the spiral arms, then the distribution of age-dated clusters throughout the spiral galaxy can be used as a means of obtaining some idea of the nature and timing of the gas flow relative to the spiral arms. In this way it might be possible to distinguish between the various theoretical models for spiral arm formation.
Bash et al. (1977) also made predictions about stellar clusters in the context of density wave theory. However their analysis concentrated on the observational charcteristics related to ongoing star formation, e.g. the presence of O stars, CO emission. Furthermore, the birth sites of their clusters were assumed to lie along an imposed spiral, rather than derived from numerical models.
In this paper we carry out numerical simulations of gas flow in model galaxies in which the spiral arms are excited by the various theoretical mechanisms and then locate the regions in which ‘star clusters’, formed in the dense arm regions, can be expected to be found at later times. We consider four canonical galaxy models, corresponding to the four basic theoretical models for spiral arm and/or bar formation. These are: (i) a galaxy with an imposed spiral potential with fixed pattern speed, (ii) a galaxy which is bar unstable, (iii) a ‘flocculent’ galaxy in which the arms are intermittent and driven by local gravitational instabilities, and (iv) a galaxy which is subject to a strong external tidal interaction. We then make predictions for the distribution of stellar clusters of different ages. We find that different spatial distributions arise at different cluster ages depending on the underlying dynamics of the galaxy, and on the spiral excitation mechanism. We finally suggest that by using methods for age-dating clusters, e.g. in the recent work by Fall et al. (2009), it may be possible to identify what is the underlying mechanism producing spiral structure in individual nearby galaxies.
In Section 2, we outline our basic numerical model, both for the galaxy dynamics, and for the identification of locations for age-dated star clusters. We then apply these techniques to the four excitation mechanisms mentioned above: ‘density wave theory’ in Section 3, bar-driven waves in Section 4, flocculent behaviour in Section 5 and external tides in Section 6. In Section 7 we illustrate our findings by plotting the distributions of cluster ages across spiral arms for the different excitation mechanisms. We summarise our findings and provide discussion in Section 8.
2 Simulations
All the calculations presented here use an SPH code, developed originally by Benz et al. (1990) and substantially modified to include sink particles (Bate et al., 1995), individual timesteps (Bate, 1995) and individual smoothing lengths (Price & Monaghan, 2004).
For all the calculations except the fixed spiral (Section 3), we fully model the galaxy with particles for stars, gas, and the dark matter halo. Since we are primarily interested in the gas flow, and in particular the gas flow downstream of any density maxima which might be taken to give rise to star cluster formation, we use relatively low gas surface densities. In the case of the fixed spiral we do not include the self-gravity of the gas. In the models which do include gas self-gravity (Sections 4, 5, and 6) we choose a relatively high gas temperature ( K), in order to avoid widespread gravitational collapse. In all models the gas is taken to be isothermal. Thus we make no pretence of modelling star-formation, feedback, radiative processes in the ISM, and so on, in any detail. Rather we are trying to identify those regions in which the gas tends to have higher than average density, and will then identify those regions as the ones in which star clusters are most likely to form. Even so, in the runs with self-gravity, we have still had to insert a few sink particles to replace the highest density regions in order to ensure that the simulations did not take too long. The number of sink particles used is low (see Sections 4, 5 and Dobbs et al. 2010).
2.1 Estimating cluster ages
Since in our simulations we cannot resolve the formation of star clusters we instead locate dense gas, which would be where stars are more likely to form, given a more realistic surface density (or self-gravity, for the fixed spiral) and sufficient resolution. For each simulation, we locate gas at high density at times between 2 Myr and 130 Myr before a given time frame. So for example, for the calculation with a fixed spiral potential (Section 3), we take a time frame of 255 Myr to represent the present. We then locate dense gas at times of 125 Myr, 155 Myr, 205 Myr and 253 Myr. We assume that the dense gas represents the location of stellar clusters forming at those times, and then plot the location of that gas at the time of 255 Myr. Thus we obtain estimates for the location of star clusters of ages of 2 Myr, 50 Myr, 100 Myr and 130 Myr. The definition of ‘dense gas’ requires some care, since in general the mean gas density decreases with radius. In practice, we found for the models except the fixed spiral, it was sufficient to select gas which has a density more than 3 times the average (mass weighted) surface density for a given radial bin, as being regions where star formation would be likely to take place. For the fixed spiral (Section 3), we used colder gas, which shocks to higher densities, and thus chose a density of 10 times the average. Radial bins were chosen to have width .
As we do not explicitly include star formation in these simulations, we cannot distinguish between SPH particles which represent star clusters and those which represent gas. Thus, we assume that the trajectories of the gas particles are not dissimilar to stars. In reality stellar clusters lose their gas over a time period of a few Myr, after which they are not subject to gas pressure. However, the role of gas pressure is most important as gas passes through a spiral shock. In the simulations, the dense gas that we assume represents the locations of star cluster formation has already passed through the shock. The velocity of the gas is highly supersonic and thus the effect of gas pressure is in general small, except in shocks. We therefore expect those stars formed in an arm, together with the gas from which they form, to emerge from a spiral arm with similar space velocities, and to continue on neighbouring trajectories until they pass through the next spiral shock. In our calculations, the majority of the cluster locations we identify occur before the gas has gone through the next spiral arm. We test this assumption that gas pressure is, for the most part, negligible, explicitly in Section 3.
3 Fixed global pattern speed – ‘density wave theory’
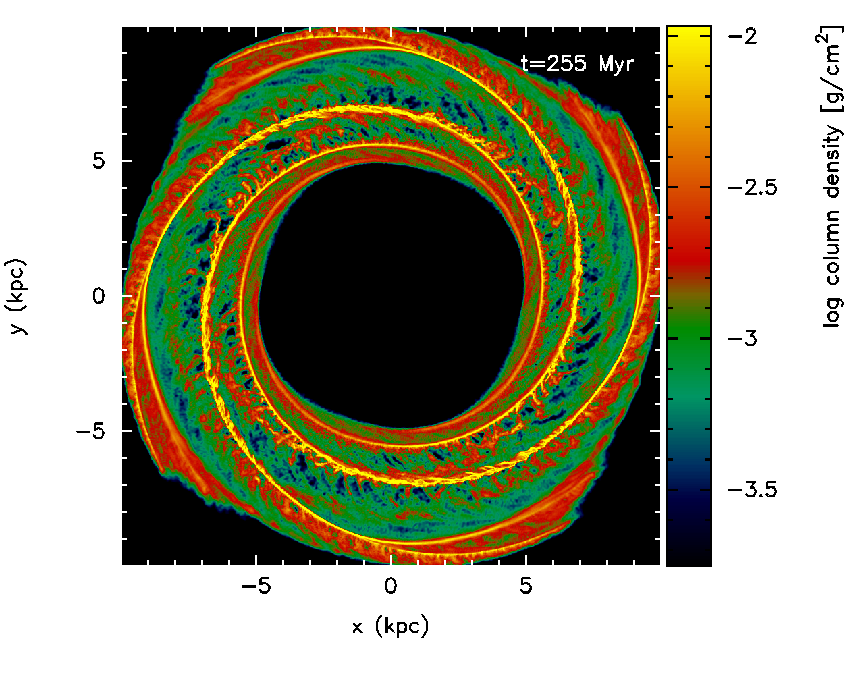
The model galaxy discussed in this Section is subjected to a fixed spiral potential rotating with a fixed global pattern speed. It is intended to represent the Lin & Shu (1964) model of quasi-steady spiral structure, which predicts the presence of a global spiral mode. We note that a galaxy which exhibits a simple kinematic density wave (Binney & Tremaine 1987, Section 6.2; Dobbs et al. 2010, section 6.1.2) which has a radially-dependent pattern speed will show analogous effects. We perform a calculation analogous those presented in Dobbs & Bonnell (2006); Dobbs et al. (2006). We impose a fixed cylindrically symmetric ‘galaxy’ potential, comprising of a logarithmic component, which produces a flat rotation curve with a peak velocity of 220 km s-1, and add an spiral perturbation from Cox & Gómez (2002). Thus unlike the other galaxy models presented below, we only need to model the gas component of the disc. The spiral has a fixed pattern speed and has an amplitude of about 4 per cent (see Dobbs (2008)). The corotation radius is at kpc. For this calculation, there is no self-gravity, and the gas is taken to be isothermal with a temperature of 100 K. We use 1 million gas particles, which are initially distributed randomly in the disc, so that the gas has an initial uniform surface density.
The simulation was run for a total of 450 Myr, and the rotation period at the midpoint of the torus ( kpc) is 200 Myr. During the course of the simulations, the gas becomes compressed into clumps in the spiral arms, which are then sheared into spurs (Dobbs et al., 2006). A PDF of the density distribution of the gas remains roughly constant after about 125 Myr. The morphology of the spurs still varies with time, but as they do not greatly change the gas flow, this is not likely to effect our results.
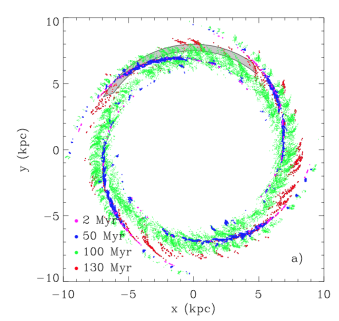
Our method for estimating cluster ages is the simplest for the fixed pattern speed scenario, since, after initial transient behaviour, the dynamics is essentially stationary in the frame rotating with the pattern speed. In the rotating frame, we expect the gas to follow steady streamlines. The simple expectation is that older clusters appear at correspondingly larger distances downstream once the gas has passed through the spiral arms. The domain of our simulation lies entirely within corotation, and thus the older stars are always expected to be the same side of the spiral arms.
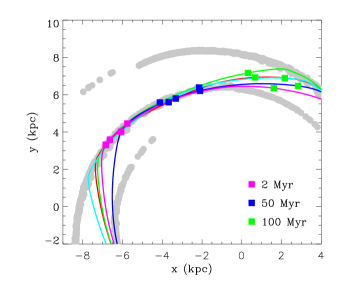
In Fig. 1a we show the surface density of the gas at a representative time of 225 Myr. In (Fig. 2a), we plot the positions of notional star clusters which formed at times 2 Myr, 50 Myr, 100 Myr and 130 Myr earlier than this time. We see that the youngest star clusters are all found in the spiral arms. The gas actually spends relatively long (around 60 Myr) in the spiral arms (Dobbs et al., 2006). Hence even after 50 Myr, star clusters lie still predominantly in the spiral arms. But after 100 Myr, the stars have moved into the interarm region. After 130 Myr, the stars have moved further into the interarm region and are approaching the next spiral arm. Thus we observe a continuous and monotonic increase in the ages of star clusters across the spiral arm. This is what one would expect from standard theory (Fujimoto, 1968; Roberts, 1969, 1972). To illustrate this more clearly, in Figure 3 we plot the paths of representative particles for this model in the rotating frame of the potential. If the flow were exactly steady, these paths would represent gas streamlines, but as can be seen there is some mixing present in the spiral shock. We mark points corresponding to the predicted locations of stellar clusters with ages 2, 50 and 100 Myr. These points correspond to the locations in the particle’s trajectory at 2, 50 and 100 Myr after the first density maximum of the gas in the shock (typically there is only one density maximum over the duration the gas spends in the spiral arm).
We tested whether our assumption that gas pressure does not strongly change the locations of the clusters by running the calculation with a fixed spiral potential from 205 Myr to 255 Myr, and from 125 Myr to 255 Myr without gas pressure. The first case corresponds to clusters of age 50 Myr, and the second 130 Myr. For the 50 Myr clusters, the mean difference in the locations of clusters with and without gas pressure was 30 pc, and only a tiny fraction (2%) of the clusters are displaced by more than 100 pc. For the 130 Myr clusters, a larger fraction (25%) exhibit displacements of more than 100 pc, as the clusters go through the next spiral arm. However 100 pc is still small compared to the length scales in our simulations, so the overall distribution of clusters calculated without pressure occupies a similar area to that shown in Figure 2, even after 130 Myr.
We did not include self gravity in this calculation, which may alter the location and dynamics of the spiral shock (Lubow et al., 1986). However in view of observational evidence that gas clouds are actually slightly unbound (Heyer et al., 2009; Koda et al., 2009), the self gravity of the gas is likely to be much less important than assumed in the calculations of Lubow et al. (1986).
Young star clusters are found in the so-called ‘spurs’ (or feathers) of spiral galaxies, downstream of the spiral shock. Spurs are the result of large agglomerations of dense cold gas (typically Giant Molecular Associations) which form in the spiral shock being sheared out as they leave the arm in the downstream flow (Dobbs & Bonnell, 2006; Koda et al., 2009; Muraoka et al., 2009). However, while spur formation is present in the current simulations (Figure 1), the interarm densities recorded here are insufficient to be recorded as sites of cluster formation. Thus there are no young star clusters predicted in the spurs seen in Figure 2a. We note too that, while in observed spirals some star formation does occur in interarm regions, the bulk of the star formation does occur in spiral arms (Elmegreen & Elmegreen, 1986). Modelling such behaviour needs a more complex treatment of the ISM than we assume here (see, for example, Dobbs & Pringle 2009), or it could be inserted deo ex machina (e.g. Karl et al. 2010). Thus while the simpler models here enable us to estimate where most of the star clusters are likely to form, they cannot form the basis of a prediction of where all such clusters might form.
4 Barred galaxy
For this galaxy model, and indeed for the other two simulations (Sections 5 and 6), we model the whole galaxy as a dynamical entity. That is, we include particles representing the gas, the stars and the dark matter halo. For each calculation, the initial conditions are generated using the mkkd95 program (Kuijken & Dubinski, 1995).
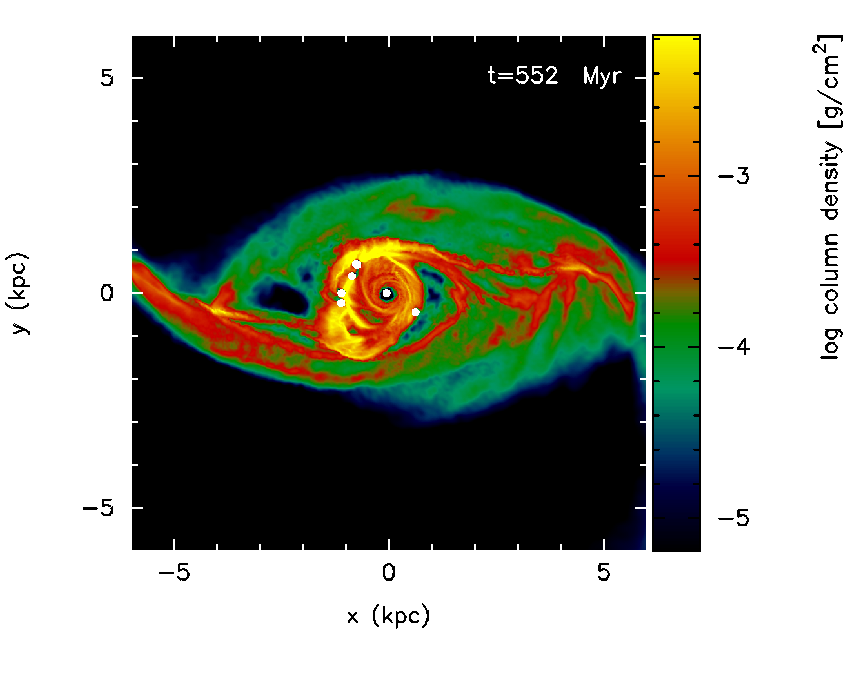
To produce a barred galaxy, we simply set up a galaxy with a high disc to halo mass ratio, since galaxies with a large fraction of their mass in the disc are known to be unstable to perturbations (Ostriker & Peebles, 1973; Kalnajs & Athanassoula-Georgala, 1974; Hohl, 1976). For our calculation, the masses of the disc and halo are and M⊙ respectively. Thus the disc mass is 80 per cent that of the halo. We also include a bulge, with a mass of M⊙. The number of particles in the halo, stellar disc and bulge are , and respectively, and there are gas particles. The gas constitutes 1 per cent of the mass of the disc, with a surface density of 3 M ⊙ pc-2 and temperature K. The gas surface density initially follows that of the stars, though settles into equilibrium within a short timescale (see Dobbs et al. (2010))
The disc quickly becomes unstable and produces an spiral in the stars and gas, which materialises into a bar after a time of around 450 Myr. The bar rotates with a relatively constant pattern speed of 38 km s-1 kpc-1 for the duration of the simulation (800 Myr), so that the co-rotation radius is at about kpc. An inner ring also forms at the centre of the galaxy, with a radius of about 1 kpc. Though we chose a low surface density and high temperature, some regions still become gravitationally unstable, and the inclusion of a few sink particles was necessary to enable the computation to proceed. However only 8 such particles formed during the simulation and thus they do not affect the dynamics. The gas surface density, and the location of the sink particles, are shown at a representative time of 552 Myr in Fig. 1b.
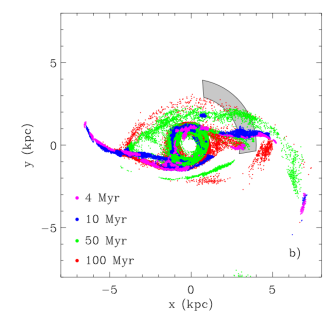
For this barred galaxy (Fig. 2b) we show the positions of ‘star clusters’ of notional ages 4 Myr, 10 Myr, 50 Myr and 100 Myr. We again see that the youngest star clusters are found to lie in the bar, whilst the older star clusters lie progressively further from the bar (see also the simulations by Wozniak (2007)) on the trailing side. Thus there is a similar pattern to the case with a fixed spiral. This is not so surprising since the stellar distribution changes little during the course of the simulation, so the pattern speed is effectively constant. The youngest stars occur on the leading side of the bar, after the gas has passed the minimum of the potential associated with the stars. This offset from the stellar bar is predicted from analysis with a fixed bar potential (Roberts et al., 1979) and is common in observations (Sheth et al., 2002).
In the inner ring, we find clusters of all ages. There is no obvious trend in ages with position, and clusters of 50 Myr, 100 Myr and even 10 Myr old stars appear to be spread throughout the ring. This is presumably because the dynamical timescale there is short (around 30 Myr). Sandstrom et al. (2010) recently studied the central ring of NGC 1097, and find that emission in tracers other than CO is widespread throughout the ring, with no apparent age transition, in agreement with these results.
5 Flocculent galaxy
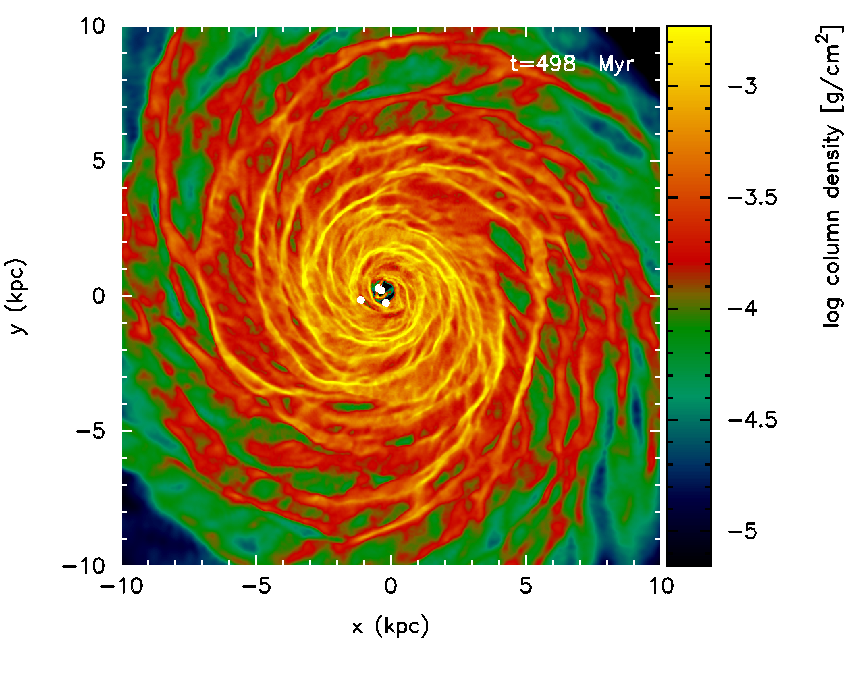
The simulations of the flocculent spiral, and of the tidally induced spiral (Section 6) are both described in more detail in Dobbs et al. (2010). We use the same initial galaxy model in each case, except that for the tidally induced spiral, we also include an orbiting perturber. We again set up the initial conditions using the mkkd95 program to assign particles to the disc, halo and bulge. This time the disc mass is chosen to be approximately 40 per cent of the halo. Thus the galaxy is more stable to bar formation, and does not form a bar at least over the duration of the calculation (600 Myr). Similar to the barred galaxy (Section 4), the gas contains 1% of the mass of the disc, and is isothermal with a temperature of K.
In the case of the flocculent galaxy, the galaxy exhibits numerous, but transient spiral arms, with no grand design spiral pattern. Gravitational instabilities in the stars lead to transient, local, short spiral arms which are co-spatial both in the stars and in the gas. The distribution of gas surface density at a representative time of 498 Myr is shown in Fig. 1.
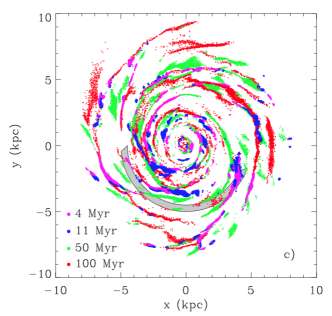
In Fig. 2c we show the positions of ‘star clusters’ of nominal ages 4 Myr, 11 Myr, 50 Myr and 100 Myr. In a flocculent galaxy such as this, there is no fixed spiral pattern; rather the spiral arms form and dissolve in an intermittent and random fashion (Dobbs & Bonnell, 2007). What we see in this case is that there is no obvious or systematic change in cluster ages across spiral arms. Rather there are many short sections of spiral arms, which have stars of roughly the same age along the arm. This comes about because of the mechanism by which spiral arms form in this case. The arms form because of local, small-scale gravitational instabilities. The gas falls into the so formed local potential minima associated with the stars. At the same time the local minimum is subject to the shearing motion of the galaxy flow as a whole. The gas is drawn out to form a local spiral arm segment, with the density changing more or less simultaneously at all positions along the segment. Thus the stars that form in the arm segment do so more or less at the same time. As time proceeds, the spiral arm dissolves, with the maxima in gas and stars being sheared out. This has the result that in the simulation, the spiral arms, or arm segments, typically contain either the young clusters (4 Myr or 11 Myr), or the older clusters which are 50 Myr, or 100 Myr old (but generally not both). However the distribution of cluster ages in some spiral arms is somewhat more complicated, due to collisions or mergers between arms of different ages. Furthermore the timescales are shorter at smaller radii, and in the central regions, gas from one spiral arm can end up in a different spiral arm by 100 Myr.
6 Interacting galaxy
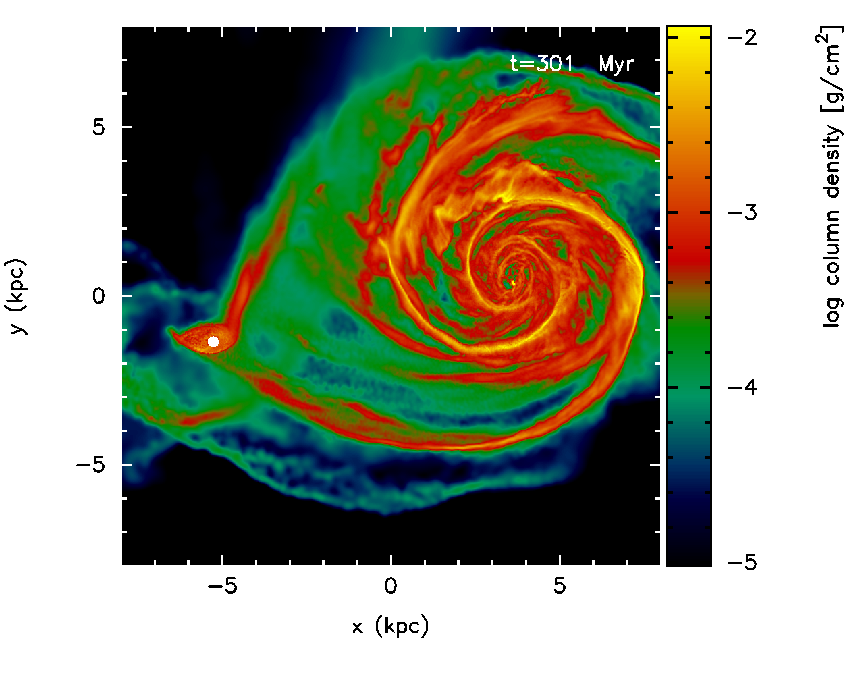
In our final example, we present results for a representative model of spiral structure induced by tidally interactions. This particular calculation was designed to model M 51, and is described in detail in Dobbs et al. (2010). The galaxy is set up in the same way as the flocculent model, but is then placed on an orbit with a perturbing galaxy of 1/3 the mass. The orbits of the two galaxies are taken from Theis & Spinneker (2003), who performed N-body calculations designed to reproduce M 51, and the initial locations and velocities of the galaxies are stated in Dobbs et al. (2010). The perturbing galaxy NGC 5195 is represented by a point mass in our calculations.
The tidal perturbation in the interacting case leads to a grand design spiral structure (Fig. 1). The nominal time of 301 Myr represents the closest the simulation got to modelling the current picture of M 51 (or NGC 5194) and its companion NGC 5195. At the time shown in Fig. 1, the perturbing galaxy is actually passing close to the main galaxy for the second time. In Dobbs et al. (2010) we show that unlike the models with the fixed potential, the pattern speed of the spiral is not constant, and that, rather, the pattern speed decreases with radius. We also found further departures from simple density wave theory, such as bifurcations and kinks along the spiral arms. Many such features are caused because the perturbing galaxy actually undergoes two close passages with M 51.
If the dynamics of the tidally induced spiral were to follow standard density wave theory, as a global mode with a radially independent pattern speed, or as a simple kinematic density wave, we would expect a similar scenario to Fig. 2a, where there is a monotonic transition of ages across each spiral arm. Instead, as can be seen in Fig. 2d, the distribution of cluster ages (here 3 Myr, 10 Myr, 50 Myr and 100 Myr) is much more complicated. At some locations (such as Point A in Fig. 2d), we can see cluster ages increasing across the arm in a manner similar to what one might expect from standard density wave theory. However, what is remarkable here is that while the 3 Myr clusters are on the inner edge of the arm, and the 50 Myr clusters are on the outer edge of the arm, there are no intermediate age 10 Myr clusters in between them. At other locations (for example Point B) we see younger clusters entering the spiral arm which already consists of older (50 Myr) clusters. And in contrast, at Point C, we see younger (10 Myr) clusters moving out of the spiral arm, whilst the older (50 Myr) clusters still lie in the spiral arm. Generally there is a tendency for clusters of quite different ages to be in the same spiral arm, but the ordering of ages of clusters across the spiral arm can be in either direction. This comes about because of the complicated dynamics of the interaction. At large radii this is not surprising, since the arms are largely tidal, with little gas flow through the spiral arm. But even at lower radii, the distribution is much more messy compared with the other cases.
Thus the difference in the distribution of clusters of a tidally interacting spiral galaxy, compared to the case with a fixed pattern speed (Section 3) is evidently due to the much more complex internal dynamics within the galaxy induced by the tidal interaction(s) with the companion. In the interaction modelled here, the companion passes close to the main galaxy twice, effectively inducing new spiral arms on two different occasions. These spiral arms are then able to evolve and interact. This accounts for the asymmetry of the spiral arms, large-scale branches, and the kink along one spiral arm at kpc, close to Point A.

7 Sections across a spiral arm
It is evident that from the point of view of observations of cluster ages, the main distinguishing feature between the various models of spiral structure excitation is the way in which cluster ages change across a spiral arm, or across a spiral arm segment (Fig. 2).
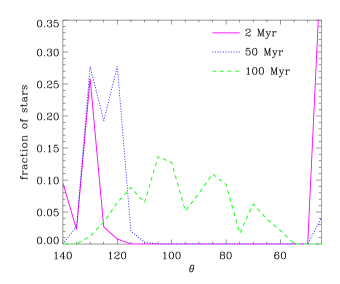
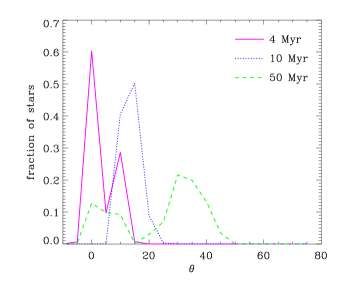
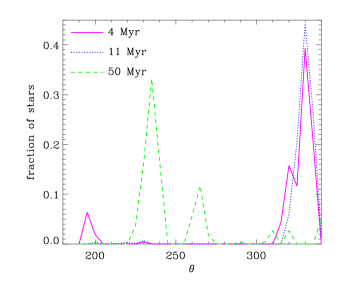
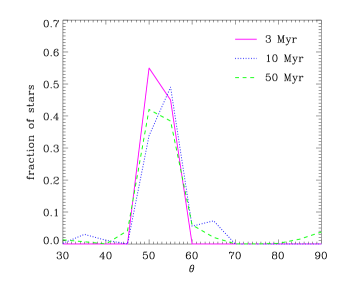
To show this more clearly we plot in Figure 4 the distribution of clusters of different ages across a particular spiral arm (or arms), for each of the spiral galaxy models (Sections 3, 5 and 6), and across the bar for the barred galaxy (Section 4). To do this we choose regions of each galaxy in the form of circular arcs. These regions are shown as regions of grey in Fig. 2. 111Thus we produce similar plots to those shown in Martínez-García et al. (2009), though they plot a photometric index as a measure of age, whereas we show the number of clusters of a given age. Except for the tidally induced spiral (Section 6) we simply took an arc centred on the origin (the centre of the galaxy), of width 0.5 kpc for the spiral galaxies and 1 kpc for the barred galaxy. For the tidally induced spiral, an arc is chosen which is more perpendicular to the spiral arm. In each plot, and for each cluster age, we normalise the number of clusters to the total number of clusters of that age. We do not plot the oldest clusters in each case, as often these have reached the next spiral arm (or bar) and, as discussed in Section 2.1 at such late times the estimated positions of the star clusters are not well modelled.
For each panel in Fig. 4, (the angle round each arc shown in Fig. 2) is plotted so that the direction of rotation is anti-clockwise clockwise in Fig. 2. This is in the direction of gas flow and thus in standard density wave theory we might expect to see in Fig. 4 a time sequence of cluster ages from left to right. However we only observe such a sequence in the two simulations with a (more or less) constant pattern speed, which are the spiral with a fixed potential (Section 3) and the barred galaxy (Section 4). These are shown on the top two panels of Fig. 4. Here we see the highest peaks for the youngest (2 Myr or 4 Myr) clusters on the left, whilst the 10 Myr and 50 Myr age clusters are located at successively further to the right.
For the flocculent galaxy (Section 5, lower left), we instead see individual peaks for arms with young clusters ( and ) or older clusters ( and ), but no trend in age across a particular arm.
For the tidally induced spiral (Section 6) we see no clear pattern at all. The different age clusters are largely coincident, even though we chose an arc more perpendicular to the arm compared to the other cases. In particular, we do not see a systematic trend in ages across an arm. We attribute the difficulty in picking out a clear trend, such as is seen in the fixed pattern speed and the barred galaxy, to a variety of effects. At large radii, the arms are largely tidal, which means gas stays in the arms for long periods (as much as 100 Myr). At smaller radii, there is a significant amount of dense interarm gas, which appears to be undergoing new star formation. Also at smaller radii, the timescales for flow between the arms are short, and thus 50 Myr old clusters in one spiral arm may have formed in the previous arm. Finally, in this case, the perturbing galaxy makes two close passes and so effectively induces two sets of tidal arms, as it orbits the main galaxy. The kink at the point marked A in Fig. 2d corresponds to one point where two such arms interact and merge.
Overall in a tidal interaction, the stress, shear and compression to which the spiral arms are subject are likely to vary both in time and space (and thus the star formation also varies in similar fashion). This is in contrast to the fixed spiral and the bar, where the forces acting along the spiral or bar, are more constant in space and time (and thus in those cases star formation is more uniform along the spiral arm or bar).
8 Discussion and Conclusions
New methods for determining ages of clusters in external galaxies are now becoming available. We have presented simplified calculations for the gas flow in spiral galaxies, including a barred galaxy, in which the spiral structure is induced in the galaxy by different mechanisms. Using the gas flow so derived, we have estimated in a simple fashion the likely locations of stellar clusters aging from a few Myr to around 130 Myr old. These calculations demonstrate that different mechanisms for the excitation and maintenance of spiral arms result in different predictions for the distribution of clusters of different ages.
If the galaxy has a quasi-static spiral pattern, either caused by standard density wave theory or by a bar, we expect to see a monotonic sequence of ages across the spiral arm (or bar) from youngest to oldest. If the spiral is tidally induced, we would not necessarily expect to see a clear trend. Rather the distribution of cluster of various ages depends intimately on the details of the tidal interaction. In our model, based on M51, the galaxy undergoes a double interaction, so the distribution of clusters may be more disordered than for a single, simple encounter. If the galaxy exhibits a predominantly flocculent spiral structure, induced by local gravitational instabilities, we would expect individual spiral arm segments to mainly consist of stars of the same age.
One caveat to our results is that we have determined the expected age of the clusters from the trajectories of the gas particles, rather than star particles. However from a calculation ran without gas pressure, there appears to be little difference between the expected locations with or without gas pressure, at least until the next spiral arm passage. A larger uncertainty is that the older the cluster, the less obvious it becomes which spiral arm the cluster formed in. This is most problematic for the flocculent galaxy, where spiral arms tend to collide on timescales of order 100 Myrs, and in the centres of galaxies.
So far, attempts to find trends in the ages of stars in external galaxies have mainly used colour gradients. For the traditional view of density wave triggering of star formation, we would expect to see a steep gradient on the trailing side of the arm (where there is a deficiency of young stars), and a much shallower gradient on the leading side, where young stars have emerged from the spiral arms and are entering the interarm region.
The analysis of colour gradients in spiral galaxies has produced few results in agreement with the predictions of density wave theory. One of the few positive results is Gonzalez & Graham (1996), who find an age transition in M99. However Martínez-García et al. (2009) analyse a sample of 13 spiral galaxies and find that in many galaxies, the colour gradients are opposite to the predictions of density wave theory (i.e. steeper on the leading side). Furthermore, they often find that for a given galaxy, one spiral arm follows the predictions whilst the other does not (e.g. NGC 4254).
The results from our simulations show that in a tidally induced, or in a flocculent spiral, a clear transition in ages is not expected. Thus the difficulty of finding a transition may simply reflect that those galaxies do not exhibit quasi-stationary density waves, but rather that their dynamics are more complex. Alternatively the uncertainties may simply be too large to properly measure age differences, due to difficulties correcting for dust and HII, and interarm star formation. The errors in their data are a sizable fraction of the gradients they show. Thus age-dating techniques (e.g. Fall et al. 2009; Bastian et al. 2009) to directly measure the ages of stars may be a better, and more quantitative, way to differentiate between the theories of spiral arms. In fact, Kaleida & Scowen (2010) have already produced a map of the spatial distribution of clusters in M51. Although they do not show a large enough number of clusters for their results to be very conclusive, the lack of any pattern in the cluster ages is consistent with results we obtain for our model of M51.
According to our results, we would expect to find a clearer trend for barred galaxies. Zurita & Pérez (2008) investigate star formation in the barred galaxy NGC 1530, and do generally find a steeper gradient on the leading side. Popping et al. (2010) also investigate ages of clusters in the barred galaxy NGC 2903, and find the distribution of stellar ages is much more chaotic, but this is not surprising since this galaxy is effectively a superposition of a bar with a flocculent spiral.
Acknowledgments
We are grateful to the referee for their helpful comments and suggestions. JEP thanks STScI for continued support from their Visitors’ Program, and thanks Ron Allen, Rupali Chandar and Brad Whitmore for valuable discussions. We also thank Nate Bastian, Eva Schinnerer and Jerry Sellwood for useful comments. The calculations reported here were performed using the University of Exeter’s SGI Altix ICE 8200 supercomputer, the HLRB-II: SGI Altix 4700 supercomputer at the Leibniz supercomputer centre, Garching and the SGI Altix at the LMU. The images in Fig. 1 were produced using SPLASH (Price, 2007), a visualisation tool for SPH that is publicly available at http://www.astro.ex.ac.uk/people/dprice/splash.
References
- Anders et al. (2004) Anders P., de Grijs R., Fritze-v. Alvensleben U., Bissantz N., 2004, MNRAS, 347, 17
- Bash et al. (1977) Bash F. N., Green E., Peters III W. L., 1977, ApJ, 217, 464
- Bastian et al. (2009) Bastian N., Trancho G., Konstantopoulos I. S., Miller B. W., 2009, ApJ, 701, 607
- Bate (1995) Bate M., 1995, PhD thesis, Univ. Cambridge
- Bate et al. (1995) Bate M. R., Bonnell I. A., Price N. M., 1995, MNRAS, 277, 362
- Beckman & Cepa (1990) Beckman J. E., Cepa J., 1990, A&A, 229, 37
- Benz et al. (1990) Benz W., Cameron A. G. W., Press W. H., Bowers R. L., 1990, ApJ, 348, 647
- Bertin et al. (1989) Bertin G., Lin C. C., Lowe S. A., Thurstans R. P., 1989, ApJ, 338, 78
- Bik et al. (2003) Bik A., Lamers H. J. G. L. M., Bastian N., Panagia N., Romaniello M., 2003, A&A, 397, 473
- Binney & Tremaine (1987) Binney J., Tremaine S., 1987, Galactic dynamics. Princeton, NJ, Princeton University Press, 1987, 747 p.
- Bottema (2003) Bottema R., 2003, MNRAS, 344, 358
- Chandar et al. (2010) Chandar R., Fall S. M., Whitmore B. C., 2010, ApJ, 711, 1263
- Cox & Gómez (2002) Cox D. P., Gómez G. C., 2002, ApJS, 142, 261
- de Grijs & Anders (2006) de Grijs R., Anders P., 2006, MNRAS, 366, 295
- Dobbs (2008) Dobbs C. L., 2008, MNRAS, 391, 844
- Dobbs & Bonnell (2006) Dobbs C. L., Bonnell I. A., 2006, MNRAS, 367, 873
- Dobbs & Bonnell (2007) Dobbs C. L., Bonnell I. A., 2007, MNRAS, 376, 1747
- Dobbs et al. (2006) Dobbs C. L., Bonnell I. A., Pringle J. E., 2006, MNRAS, 371, 1663
- Dobbs & Pringle (2009) Dobbs C. L., Pringle J. E., 2009, MNRAS, 396, 1579
- Dobbs et al. (2010) Dobbs C. L., Theis C., Pringle J. E., Bate M. R., 2010, MNRAS, 403, 625
- Dubinski et al. (2008) Dubinski J., Gauthier J., Widrow L., Nickerson S., 2008, in J. G. Funes & E. M. Corsini ed., Astronomical Society of the Pacific Conference Series Vol. 396 of Astronomical Society of the Pacific Conference Series, Spiral and Bar Instabilities Provoked by Dark Matter Satellites. pp 321–+
- Efremov & Ivanov (1982) Efremov I. N., Ivanov G. R., 1982, Ap&SS, 86, 117
- Elmegreen & Elmegreen (1986) Elmegreen B. G., Elmegreen D. M., 1986, ApJ, 311, 554
- Elmegreen et al. (1989) Elmegreen B. G., Seiden P. E., Elmegreen D. M., 1989, ApJ, 343, 602
- Fall et al. (2005) Fall S. M., Chandar R., Whitmore B. C., 2005, ApJL, 631, L133
- Fall et al. (2009) Fall S. M., Chandar R., Whitmore B. C., 2009, ApJ, 704, 453
- Fujii et al. (2010) Fujii M. S., Baba J., Saitoh T. R., Makino J., Kokubo E., Wada K., 2010, ArXiv e-prints
- Fujimoto (1968) Fujimoto M., 1968, ApJ, 152, 391
- Gonzalez & Graham (1996) Gonzalez R. A., Graham J. R., 1996, ApJ, 460, 651
- Heyer et al. (2009) Heyer M., Krawczyk C., Duval J., Jackson J. M., 2009, ApJ, 699, 1092
- Hohl (1976) Hohl F., 1976, AJ, 81, 30
- Hunter et al. (2003) Hunter D. A., Elmegreen B. G., Dupuy T. J., Mortonson M., 2003, AJ, 126, 1836
- Kaleida & Scowen (2010) Kaleida C. C., Scowen P. A., 2010, ArXiv e-prints
- Kalnajs & Athanassoula-Georgala (1974) Kalnajs A. J., Athanassoula-Georgala E., 1974, MNRAS, 168, 287
- Karl et al. (2010) Karl S. J., Naab T., Johansson P. H., Kotarba H., Boily C. M., Renaud F., Theis C., 2010, ApJL, 715, L88
- Kendall et al. (2008) Kendall S., Kennicutt R. C., Clarke C., Thornley M. D., 2008, MNRAS, 387, 1007
- Koda et al. (2009) Koda et al. 2009, ApJL, 700, L132
- Kormendy & Norman (1979) Kormendy J., Norman C. A., 1979, ApJ, 233, 539
- Kuijken & Dubinski (1995) Kuijken K., Dubinski J., 1995, MNRAS, 277, 1341
- Lin & Shu (1964) Lin C. C., Shu F. H., 1964, ApJ, 140, 646
- Lubow et al. (1986) Lubow S. H., Cowie L. L., Balbus S. A., 1986, ApJ, 309, 496
- Martínez-García et al. (2009) Martínez-García E. E., González-Lópezlira R. A., Bruzual-A G., 2009, ApJ, 694, 512
- Muraoka et al. (2009) Muraoka K., Kohno K., Tosaki T., Kuno N., Nakanishi K., Sorai K., Sawada T., Tanaka K., Handa T., Fukuhara M., Ezawa H., Kawabe R., 2009, ApJ, 706, 1213
- Ostriker & Peebles (1973) Ostriker J. P., Peebles P. J. E., 1973, ApJ, 186, 467
- Popping et al. (2010) Popping G., Perez I., Zurita A., 2010, ArXiv e-prints
- Price (2007) Price D. J., 2007, Publications of the Astronomical Society of Australia, 24, 159
- Price & Monaghan (2004) Price D. J., Monaghan J. J., 2004, MNRAS, 348, 139
- Regan & Wilson (1993) Regan M. W., Wilson C. D., 1993, AJ, 105, 499
- Roberts (1969) Roberts W. W., 1969, ApJ, 158, 123
- Roberts (1972) Roberts Jr. W. W., 1972, ApJ, 173, 259
- Roberts et al. (1979) Roberts Jr. W. W., Huntley J. M., van Albada G. D., 1979, ApJ, 233, 67
- Sandstrom et al. (2010) Sandstrom et al. K., 2010, ArXiv e-prints
- Scheepmaker et al. (2007) Scheepmaker R. A., Haas M. R., Gieles M., Bastian N., Larsen S. S., Lamers H. J. G. L. M., 2007, A&A, 469, 925
- Sellwood (2010) Sellwood J. A., 2010, ArXiv e-prints
- Sellwood & Carlberg (1984) Sellwood J. A., Carlberg R. G., 1984, ApJ, 282, 61
- Sellwood & Kahn (1991) Sellwood J. A., Kahn F. D., 1991, MNRAS, 250, 278
- Sheth et al. (2002) Sheth K., Vogel S. N., Regan M. W., Teuben P. J., Harris A. I., Thornley M. D., 2002, AJ, 124, 2581
- Theis & Spinneker (2003) Theis C., Spinneker C., 2003, Ap&SS, 284, 495
- Toomre (1964) Toomre A., 1964, ApJ, 139, 1217
- Toomre (1990) Toomre A., 1990, Gas-hungry Sc spirals.. pp 292–303
- Tutukov & Fedorova (2006) Tutukov A. V., Fedorova A. V., 2006, Astronomy Reports, 50, 785
- Wozniak (2007) Wozniak H., 2007, A&A, 465, L1
- Zurita & Pérez (2008) Zurita A., Pérez I., 2008, A&A, 485, 5