The longest observation of a low intensity state from a Supergiant Fast X–ray Transient: observes IGR J08408–4503
Abstract
We report here on the longest deep X–ray observation of a supergiant fast X–ray transient (SFXT) outside outburst, with an average luminosity level of 1033 erg s-1 (assuming 3 kpc distance). This observation was performed with in December 2009 and was targeted on IGR J08408–4503, with a net exposure with the X–ray imaging spectrometer (XIS, 0.4–10 keV) and the hard X–ray detector (HXD, 15–100 keV) of 67.4 ks and 64.7 ks, respectively, spanning about three days. The source was caught in a low intensity state characterized by an initially average X–ray luminosity level of 41032 erg s-1 (0.5-10 keV) during the first 120 ks, followed by two long flares (about 45 ks each) peaking at a flux a factor of about 3 higher than the initial pre-flare emission. Both XIS spectra (initial emission and the two subsequent long flares) can be fitted with a double component spectrum, with a soft thermal plasma model together with a power law, differently absorbed. The spectral characteristics suggest that the source is accreting matter even at this very low intensity level. From the HXD observation we place an upper limit of 61033 erg s-1 (15–40 keV; 3 kpc distance) to the hard X–ray emission, which is the most stringent constraint on the hard X–ray emission during a low intensity state in a SFXT, to date. The timescale observed for the two low intensity long flares is indicative of an orbital separation of the order of 1013 cm in IGR J08408–4503.
keywords:
X-rays: individual (IGR J084084503)1 Introduction
IGR J08408–4503 is a hard X–ray transient discovered in 2006 May with during a flare with a duration of 900 s, with a flux of 250 mCrab (at peak, 20–40 keV) (Götz et al., 2006). Archival observations of this field before the discovery observation demonstrated the recurrence of its flaring activity (Mereghetti et al., 2006). A refined X–ray position (Kennea & Campana, 2006), allowed the association of the X–ray transient with a bright O8.5Ib(f) star (HD 74194) located in the Vela region, at a distance of about 3 kpc (Masetti et al., 2006). Optical spectroscopy of HD 74194, performed just a few days after the source discovery, showed variability in the H profile and a radial velocity variation with an amplitude of about 35 km s-1 (He I and He II absorption lines; Barba et al. 2006). Other bright X–ray flares were observed with and in October 2006, July 2008 and September 2008 (Götz et al. 2007, Romano et al. 2009, Sidoli et al. 2009). An orbital period of 35 days has been suggested based on the duration of the flaring activity (Romano et al., 2009), although a secure determination based on X–ray and/or optical modulation is still lacking. Also a pulse period has never been found, thus the nature of the compact object is unknown.
IGR J08408–4503 has been classified as a member of the class of high mass X–ray binaries (HMXBs) called supergiant fast X–ray transients (SFXTs), X–ray transients with bright and short duration flaring activity associated with blue supergiant companions (Sguera et al. 2005, Smith et al. 2006). The large majority of the members of this class have been discovered by during the survey of the Galactic plane (Sguera et al. 2005, Sguera et al. 2006). A few SFXTs are X–ray pulsars, thus demonstrating that the compact object is a neutron star, while in the other sources a black hole cannot be excluded, although the broad band spectra (0.1-100 keV) in outburst are very similar to those typically observed in accreting pulsars (e.g. Romano et al. 2008). Their outbursts typically show a duration of a few days (Romano et al. 2007, Sidoli et al. 2009), with small duty cycles although highly variable from source to source (Romano et al., 2009). Each outburst is characterized by several short (a few minutes to a few hour duration) and bright flares, each reaching a luminosity of a few 1036–1037 erg s-1 (Sidoli et al., 2009). A much lower intensity emission characterizes the long term behaviour of these transients (1033–1034 erg s-1, Sidoli et al. 2008), while the quiescent state (no accretion) has been observed rarely and displays a very soft (likely thermal) spectrum with a luminosity of 1032 erg s-1 (in’t Zand 2005, Leyder et al. 2007). A very low level of accretion (1032 erg s-1) has been observed from IGR J08408–4503 in 2007 with as well, displaying a double component spectrum composed of a thermal soft part (likely from the supergiant companion), together with a harder power-law component (Bozzo et al. 2010).
Although SFXTs only sporadically undergo a bright outburst (from null to 4 outbursts per source have been observed during the two years long monitoring of four SFXTs with , Romano et al. 2009), their properties during outbursts are much better studied than their behaviour during the long-term lower intensity states (intermediate level or the quiescence).
We report here on a observation of IGR J08408–4503 with a net exposure of 67.4 ks (XIS), spanning about three days. This is the longest X–ray observation of a SFXT catching the source in a very low intensity level.
We also report on the analysis of our private observations of the source field covering about one month including times of the observation. We then compare our results with a much shorter observation of a low intensity state from IGR J08408–4503 performed with in 2007. To this aim, we re-analysed these observations, although already reported by Bozzo et al. (2010).
2 Observations and Data Reduction
2.1
A (Mitsuda et al., 2007) observation of IGR J08408–4503 was performed from 2009 December 11, starting at 17:53 UT, until December 14 12:00 UT. The target was placed at the ‘HXD nominal’ position. The X–ray Imaging Spectrometer (XIS; Koyama et al. 2007) was operated in the normal mode with no window option, providing a time resolution of 8 s. The Hard X-ray Detector (HXD; Takahashi et al. 2007) was in standard mode, with a time resolution of 61 s for the individual events.
The XIS and HXD data were both processed with the Suzaku pipeline version 2.4.12.27 in the heasoft (version 6.6) software package. The data were screened according to standard criteria. In particular, events were discarded if they were acquired during passages through the South Atlantic Anomaly or in regions of low geomagnetic cut-off rigidity (6 GV for XIS and 8 GV for HXD), or with low Earth elevation angles; for the XIS only events with grade 0, 2, 3, 4, and 6 were considered, and the cleansis script was used to remove hot or flickering pixels. The net exposures obtained with the XIS and HXD (live time 93.2%) were 67.4 ks and 64.7 ks, respectively.
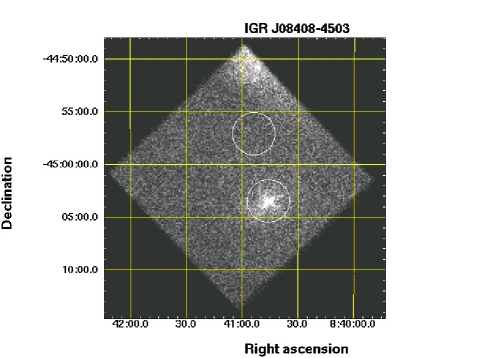
The XIS events of IGR J08408–4503 were accumulated in each of the three XIS cameras within a circular region (2′ radius) centered on the target, while the backgrounds were estimated from source-free regions well outside the point-spread function of the source (see Fig. 1). For the spectral analysis, spectral redistribution matrices and ancillary response files for the XIS spectra were generated using the xisrmfgen and xissimarfgen tasks.
Background subtraction for the HXD data is performed using a synthetic model that accounts for the time-variable particle background (the so-called ‘non X-ray background’, NXB). In particular, we used the ‘tuned’ NXB model (see Fukazawa et al. 2009 for details). The cosmic X–ray background and possible Galactic diffuse emission remain in the background subtracted data, as well as emission from any X-ray source that occurs in the instrument arcmin2 field of view.
After subtracting the NXB, a positive signal is detected in the HXD-PIN up to 40 keV (about 10% of the total counts in the 15–40 keV band); no significant emission is detected in the GSO data. To account for the expected contribution from the ‘cosmic X–ray background’ (CXB), we used the spectra reported in Gruber et al. (1999) and in Moretti et al. (2009). We estimate that the CXB contributes to the observed signal with roughly half of the NXB-subtracted counts.
The spectrum of the remaining signal is adequately described ( for 64 degrees of freedom) by a power-law model with photon index (1 confidence level) and 15–40 keV flux of erg cm-2 s-1. Considered that the combined uncertainties on the CXB and NXB are comparable to the flux estimated in this way, and lacking any specific signature of IGR J08408–4503 (such as it would be a periodic signal) in the HXD-PIN band, we regard the observed flux only as an upper limit on the hard X–ray emission of the source. This upper limit is not very constraining for the extrapolation of the XIS spectrum at high energy. Thus, in the following, we concentrate on the soft energy part of the source spectrum observed with XIS.
2.2
The INTEGRAL (INTErnational Gamma-Ray Astrophysics Laboratory, Winkler et al. 2003) satellite, launched in October 2002, carries 3 coded-mask telescopes: IBIS (15 keV- 10 MeV; Ubertini et al. 2003), the spectrometer SPI (20 keV8 MeV; Vedrenne et al. 2003), two Xray monitors JEM-X1 and JEM-X2 (335 keV; Lund et al. 2003). IBIS is composed of two detector layers: ISGRI (15 keV - 1 MeV; Lebrun et al. 2003) and PICsIT (175 keV-10 MeV; Labanti et al. 2003). An INTEGRAL pointing lasts about 2 ks.
We analysed our IBIS/ISGRI private data between 55142.852 MJD and 55195.400 MJD, where IGR J08408–4503 was in the field of view (see Table 1), using the Off-line Scientific Analysis package OSA 8.0 (Goldwurm et al., 2003).
IGR J08408–4503 has never been detected, being always below the threshold of detection, both on timescales of a single observation, each lasting 2 ks, and of a single satellite revolution (Rev. in Table 1). The source remains undetected even adding together the whole data-set of the seven revolutions analysed here (Table 1). In Figure 2 we show the upper-limit lightcurve obtained with IBIS/ISGRI data, overimposed on the times of the observation, where we have converted the IBIS/ISGRI count rate, measured in the keV range, to the keV unabsorbed flux, adopting the average spectral parameters obtained by Romano et al. (2009).
| Rev. | Period (MJD) | Date |
|---|---|---|
| 863 | 55142.85255144.414 | 2009-11-07 20:26 2009-11-09 09:56 |
| 864 | 55146.28955147.531 | 2009-11-11 06:56 2009-11-12 12:44 |
| 865 | 55147.63755148.500 | 2009-11-12 15:17 2009-11-13 12:00 |
| 866 | 55150.71555152.578 | 2009-11-15 17:09 2009-11-17 13:52 |
| 867 | 55155.91055156.500 | 2009-11-20 21:50 2009-11-21 12:00 |
| 868 | 55156.61355158.035 | 2009-11-21 14:42 2009-11-23 00:50 |
| 880 | 55194.09855195.400 | 2009-12-29 02:21 2009-12-30 09:36 |

2.3
We compare here our results with a publicly available much shorter observation of a low luminosity state recently analysed by Bozzo et al. (2010). We re-analysed this same data-set, to properly compare it with our observation and check if the best fit found from spectroscopy equally well describes the spectrum, at a similar source luminosity state. IGR J08408–4503 was observed with on 2007 May 29, with a live time of 35.7 ks (EPIC pn).
Data were reprocessed using version 9.0 of the Science Analysis Software (SAS). Known hot, or flickering, pixels and electronic noise were rejected. Response and ancillary matrix files were generated using the SAS tasks rmfgen and arfgen. We concentrate on the EPIC pn data: pn was operated in its Prime Full Window mode with all the CCDs in Imaging Mode. The EPIC pn observation used the thick filter. Source pn spectrum was extracted from a circular region of 30′′ radius to avoid the edge of the CCD. We selected PATTERNS from 0 to 4. Background counts were obtained from similar sized region offset from the source position. The background (selected with PATTERN=0 and above 10 keV) showed evidence of some flaring activity, which was filtered out, resulting in a net exposure time for the final source pn spectrum of 35.1 ks. The IGR J08408–4503 pn spectrum was not affected by pile-up, resulting in an average net count rate of 0.170 s-1.
To ensure applicability of the statistics, the net spectra were rebinned such that at least 30 counts per bin were present. All quoted uncertainties are given at 90% confidence level for one interesting parameter.
3 Analysis and Results
3.1
The background subtracted light curve of IGR J08408–4503 in two energy bands (softer and harder than 3 keV) together with their hardness ratio, are shown in Fig. 3. The hardness ratio does not show strong evidence of variability, thus we will study both the average spectrum extracted from the whole exposure time, as well as time selected spectra from the initial part of the observation and from the peak of the two flares, separately. Fitting the whole hardness ratio as a function of time (with a bin time of 5 ks) to a constant model we obtain a value of ( for 44 d.o.f.).
A timing analysis was performed after having converted the event arrival times to the Solar System Barycentric frame. We searched for coherent periodicity, but found no evidence for pulsations. We could place an upper limit on the pulsed fraction (defined as the semi-amplitude of the sinusoidal modulation devided the mean count rate), computed according to Vaughan et al. (1994), of 40% at the 99% confidence level for periods in the range 16 s–500 s.
 |
 |
We selected three spectra from the data-set, as follows: the first spectrum (which we call “persistent” spectrum in Table 2) was extracted accumulating all photons coming from the first 120 ks of the observation, with the lowest intensity level (see the light curve reported in Fig. 3); the second spectrum is from the peak of the first flare (“flare 1”, between 145 ks and 160 ks in Fig. 3), while the third spectrum comes from the peak of the second flare (“flare 2”, between 202 ks and 216 ks in Fig. 3). These time spans are subjective choices in order to extract the lowest intensity spectrum and the spectra at the peak of each flare.
We first analysed the lowest intensity spectrum (the “persistent” pre-flare spectrum, with a net exposure time of 35 ks), always fitting together the spectra from the different XIS units (extracted separately), with factors included in the spectral fitting to allow for normalization uncertainties between the instruments. A fit with an absorbed simple power law (pegpwrlw in xspec) resulted in positive residuals below 1 keV and in an unphysical very low energy absorption consistent with zero (resulting in a photon index of 1.5, with a reduced /d.o.f.=1.248/57). Thus in the following we will constrain the absorbing column density to be at least that predicted from optical measurements towards the donor star (=3 cm-2; Leyder et al. 2007). We then added a second component to the power law continuum (a thermal plasma model, mekal model in xspec), to account for the residuals evident at soft energies. We note that a similar low energy component was also found in the low intensity state observed in 2007 with (Bozzo et al., 2010) and explained by these authors as the likely X–ray emission from the blue supergiant companion. The double component model resulted in a much better fit (/d.o.f.=0.811/55), with the spectral parameters reported in Table 2. If we extrapolate at high energies this best fit, we derive a flux of 4.35 erg cm-2 s-1 (15–40 keV), more than one order of magnitude lower than the upper limit we can place with /HXD (see Sect. 2.1). If interpreted as X–ray emission from the companion star, this soft component should be obviously always present with similar spectral parameters, and with an X–ray luminosity consistent with that usually observed from OB supergiants (1031–1032 erg -1; Cassinelli et al. 1981). Thus we included it in the fitting model also when analysing the other two spectra from the peak of the two flares.
Fitting the first flare peak emission with this double component model (net exposure time of 7.8 ks; Table 2), we found a good fit (/d.o.f.= ) but with a very low temperature 0.09 keV and a high normalization for this soft component, which translates into an X–ray luminosity (0.5–10 keV) of 41035 erg -1, too high to be compatible with the X–ray emission from the supergiant companion. Thus, we constrained the mekal temperature and its normalization to be within the same variability ranges we obtained from the spectroscopy of the faint persistent spectrum (Table 2), which we verified to be also consistent with the faintest emission observed in 2007 with , and reanalysed here in Sect. 3.2. Constraining these two parameters in the double component continuum, we obtained a worse fit and wave-like residuals (/d.o.f.= ) along the whole energy range. To solve this problem we added an additional absorption to the power law model, which can be explained with a different absorption towards the donor star and the compact object. This new double component model (phabs (mekal +phabs pegpwrlw) adopting the xspec syntax) resulted in the best fit (/d.o.f.= ) reported in Table 2, with an additional absorption, , towards the power law component of 1.8 cm-2 and a power-law photon index, , of 2.1. The unabsorbed flux reported in Table 2 is the flux obtained correcting from the total absorption , but not for . Correcting also for , and measuring the unabsorbed flux coming only from the power law component, we obtained 6 erg cm-2 s-1 (1–10 keV).
Fitting the second flare peak emission with this same double component model (net exposure time of 2.7 ks; see Table 2 for the fit results), we obtained 1.4 cm-2 for the power law component, consistent with that measured during the first flare. The unabsorbed flux measured from only the power law component is 7 erg cm-2 s-1 (1–10 keV) which, extrapolated to the range 15–40 keV, results into an unabsorbed flux of 3 erg cm-2 s-1, consistent with the upper limit placed from HXD observation.
| Spectrum | Unabs Flux (1-10 keV) | /d.o.f. | |||||
| ( cm-2) | ( cm-2) | (keV) | () | ( erg cm-2 s-1) | |||
| Persistent | 0.42 | ||||||
| 0.44 | |||||||
| Flare 1 | 0.09 | 9.2 | |||||
| 4.0 | |||||||
| Flare 2 | 5.8 | ||||||
| 5.2 | |||||||
| Average | 1.5 | ||||||
| 1.4 |
Finally, we performed a spectral fit to the average spectrum extracted from the whole observation (net exposure time 67.4 ks). The results obtained with the same double component model discussed before are reported in Table 2 and shown in Fig. 4.
 |
 |
 |
3.2
The source low intensity state in the observation is similar to that observed with in 2007. Thus, we re-analysed here these same public EPIC pn data, in order to compare them with our XIS results. In particular, we performed a different time selection spectroscopy with respect to that reported by Bozzo et al. (2010). We then reanalysed the spectra adopting the same best-fit model found from analysis, to test if the same double component spectral model can explain both data-sets.
The light curve observed in 2007 with (EPIC pn data) is reported in Fig. 5, in two energy ranges (above and below 2 keV) together with their hardness ratio. In the same figure (lower panel) we also show an hardness-intensity plot, with a larger bin time, to clearly show that there is a clear correlation between the hardness ratio and the source intensity, as already noted and discussed by Bozzo et al. (2010).
 |
 |
Since hardness ratio and source intensity are correlated, an intensity-selected spectroscopy translates also into a hardness-ratio selected spectroscopy. In order to compare the spectrum of the initial lowest intensity state (“persistent” emission in Table 2) with the lowest intensity state observed with , we extracted a spectrum where the EPIC pn rate (S+H in Fig.5, lower panel) was lower than 0.14 s-1 (spectrum A in Table 3). During this low intensity, the contribution to the X–ray emission from the O-type supergiant companion is maximum, thus allowing us to put better constraints to the companion soft energy component (e.g. Cassinelli et al. 1981). Three other intensity-selected spectra were extracted in the following EPIC pn total rate ranges (S+H in Fig.5, lower panel): 0.14 s-1–0.3 s-1 (spectrum B in Table 3), 0.3 s-1–0.7 s-1 (spectrum C) and 0.7 s-1, to catch only the peaks of the flaring activity (spectrum D).
We applied to the pn intensity-selected spectra the best fit model found from data, a double component model with a continuum composed by a hot plasma model together with a power law model, differently absorbed (phabs (mekal +phabs pegpwrlw) adopting the xspec syntax). We constrained the total absorption (the first phabs model, absorbing both continuum components) to be not less than the absorption towards the optical companion (as during the XIS analysis). We also constrained the mekal parameters to be within the ranges found from the XIS analysis. In Table 3 the spectral results of only the power law component with the total and the additional absorption are reported. The fit results are good, demonstrating that the same model adopted to explain spectra is a nice deconvolution of the spectra too, although a simpler model (an absorbed power law) already results in a good description of the spectra A and D. We note that the main responsible for the increasing of the hardness ratio during flares is very likely a harder power law high energy component rather than an increasing of the absorbing column density (which remains constant, within the uncertainties), as already reported by Bozzo et al. (2010), but adopting a different deconvolution of the spectrum.
| Spectrum | Observed Flux (1-10 keV) | /d.o.f. | |||
|---|---|---|---|---|---|
| ( cm-2) | ( cm-2) | ( erg cm-2 s-1) | |||
| A | 2.1 | 1.8 | |||
| B | 6.4 | ||||
| C | 23 | ||||
| D | 58 |
4 Discussion and Conclusions
We report here on the longest observation of a low luminosity state of a SFXT, spanning about three consecutive days (with the obvious gaps due to the satellite orbits), resulting in a net exposure time of 67.4 ks. The IGR J08408–4503 observation unveils a source luminosity level at about 41032 erg s-1 for the first 120 ks, followed by two long flares (with a duration of about 45 ks each) with a count rate a factor of 3 higher than the initial “persistent” pre-flare emission. The source has not been convincingly detected with HXD and we could place the best upper limit to date to the hard X–ray emission (15–40 keV) of a SFXT in the low intensity state, at a level of 61033 erg s-1.
The time selected spectroscopy of the XIS observation resulted in a best fit model composed by a double component continuum (a soft hot plasma model together with a power law dominating at high energies), differently absorbed, with the presence of an extra absorption of the high energy power law component. This additional absorbing matter, of the order of 1–21022 cm-2, is very likely local to the compact object, since it absorbs only the power law component. It could be due to dense wind clumps passing in front of the compact object and close to it, or more likely to the accreting matter itself, since this additional absorption is more clearly detected during the two long duration flares. The spectral parameters of the double component model suggest that the low energy soft component is produced by the supergiant companion, while the high energy component is too hard for a stellar origin (we will not repeat here the convincing arguments already discussed by Bozzo et al. 2010). Both the temporal and spectral properties indicate that in IGR J08408–4503 the compact object is still accreting matter even at the low intensity state we observed with : indeed, also in the lowest luminosity state of 41032 erg s-1, during the first part of the observation (long term pre-flare emission), the spectrum is hard and power-law-like at energies higher than 1 keV, with a photon index, , of 1–2. Similar photon indexes have been measured in the 1–10 keV spectra of four other SFXTs monitored with during their long-term intermediate states (Sidoli et al., 2008), although at higher luminosities (1033–1034 erg s-1). The presence of flares, together with the hard X–ray emission, is strongly indicative of the fact that accretion on the compact object is still ongoing in IGR J08408–4503, even at very low luminosities.
SFXTs behaviour is still not explained (both the outbursts and the high dynamic range), although several possible mechanisms have been proposed since the times of their discovery with (Sguera et al., 2005). Among the different proposed explanations (see Sidoli 2009 for a review) which involve the wind properties and/or the characteristics of the compact object (neutron star magnetic field and spin period) there is a general consensus on the fact that the supergiant wind is very likely not homogeneous (“clumpy”; in’t Zand 2005).
In the framework of the clumpy wind model developed by Ducci et al. (2009), we can derive the distance of the neutron star from the supergiant companion, from the durations and luminosities of the flares observed with , and adopting the expansion law for the clump size (see Eq. [9] in Ducci et al. 2009; see also Romano et al. 2009 and Sidoli et al. 2009 for previous applications of this method to IGR J08408–4503). Assuming a wind velocity of km s-1 and a neutron star with mass M⊙, the accretion radius is:
| (1) |
From the time duration of the flares, s, we obtain the radius of the clumps accreted by the neutron star:
| (2) |
Extrapolating flux of the two flares to a broader energy range, erg cm-2 s-1 ( keV), and assuming a distance of kpc, we obtain a flare Xray luminosity erg s-1. Hence, from the accretion X–ray luminosity and the continuity equation , we obtain a clump density of g cm-3, and a mass of g. For the supergiant companion we assumed the following physical properties: a radius R⊙, a mass M⊙, a luminosity and an effective temperature K (Vacca et al., 1996). We thus obtain, from the clump mass-radius equation of Ducci et al. 2009 (Eq. [20]), the starting radius of the clump: cm. Assuming that the sonic radius equals the supergiant radius, and a starting wind velocity at of cm s-1 (Bouret et al., 2005), we obtain, from the expansion law of the clump, a distance of the neutron star of cm, consistent with our previous findings (Romano et al., 2009).
The orbital separation derived here implies an orbital period of about 35 days, which is somehow intermediate between the narrow orbits of other SFXTs (e.g., 3.3 days in IGR J16479-4514, Jain et al. 2009) and the longest orbital period measeured to date in a SFXT (165 days, Sidoli et al. 2006, Romano et al. 2009), whereas it is very similar to that measured in SFXTs like, e.g, SAX J1818.6–1703 (Zurita Heras & Chaty 2009, Bird et al. 2009). Even the long duration low luminosity emission at a few 1032 erg s-1 (close to the quiescent emission observed, e.g., in IGR J17544–2619, in’t Zand 2005) is consistent with a wide orbit, in order to allow accretion at a low level. Also the long term light curve reported here from observations seems to point to a long duration of the low intensity emission in IGR J08408–4503.
The presence of short flaring activity as observed with in IGR J08408–4503 during a low intensity state has already been caught in other SFXTs (e.g., in IGR J17544-2619, González-Riestra et al. 2004, their Fig. 3) with flares durations of a few hundred seconds. On the other hand, the pointing spanning three days allowed us for the first time to probe the source light curve on much longer timescales, catching longer flares (45 ks) than usual, with peak rates which are only 3 times higher than the average pre-flare intensity. The observed properties of these flares, their long duration together with the low dynamic range with respect to the pre-flare emission, suggested us to search for other possible explanations, although in the framework of the structure of the supergiant wind. A viable alternative to the accretion of single clumps could be that the flares are produced from the accretion of large scale wind structures, like gas streams, or the so-called corotating interaction regions (CIRs, Mullan 1984). CIRs form in a stellar wind when the rotating star emits wind in a non-spherically symmetric manner. These wind structures were originally studied in the solar corona (Mullan, 1984) and form as interaction regions between slow and fast streamlines. They were later suggested to be present also in rotating O-star winds (Cranmer & Owocki, 1996), with a mild density contrast of a factor of 2–3 with respect to the undisturbed wind. These structures have a typical thickness of 0.1 at radial distance (Mullan, 1984). Thus, assuming a radial distance cm and a stream thickness, S0.1, we can derive the neutron star velocity, vns from S and the flare duration tflare (S=vns tflare). Assuming tflare=45 ks and S0.1= cm, we find vns=200 km s-1, which is consistent with the neutron star orbital velocity in a 35 days orbit around a 30 M⊙ companion star.
Acknowledgments
This work was supported in Italy by contract ASI/INAF I/088/06/0. P.E. acknowledges financial support from the Autonomous Region of Sardinia through a research grant under the program PO Sardegna FSE 2007–2013, L.R. 7/2007 “Promoting scientific research and innovation technology in Sardinia”. This work is based on data from observations with , , and . is a Japan’s mission developed at the Institute of Space and Astronautical Science of Japan Aerospace Exploration Agency in collaboration with U.S. (NASA/GSFC, MIT) and Japanese institutions. is an ESA science mission with instruments and contributions directly funded by ESA Member States and the USA (NASA). is an ESA project with instruments and science data centre funded by ESA member states (especially the PI countries: Denmark, France, Germany, Italy, Switzerland, Spain), Czech Republic and Poland, and with the participation of Russia and the USA. This research has made use of HEASARC online services, supported by NASA/GSFC.
References
- Barba et al. (2006) Barba R., Gamen R., Morrell N., 2006, Astron. Tel., 819, 1
- Bird et al. (2009) Bird A. J., Bazzano A., Hill A. B., McBride V. A., Sguera V., Shaw S. E., Watkins H. J., 2009, MNRAS, 393, L11
- Bouret et al. (2005) Bouret J.-C., Lanz T., Hillier D. J., 2005, A&A, 438, 301
- Bozzo et al. (2010) Bozzo E., Stella L., Ferrigno C., Giunta A., Falanga M., Campana S., Israel G., Leyder J. C., 2010, ArXiv 1004.2059
- Cassinelli et al. (1981) Cassinelli J. P., Waldron W. L., Sanders W. T., Harnden Jr. F. R., Rosner R., Vaiana G. S., 1981, ApJ, 250, 677
- Cranmer & Owocki (1996) Cranmer S. R., Owocki S. P., 1996, ApJ, 462, 469
- Ducci et al. (2009) Ducci L., Sidoli L., Mereghetti S., Paizis A., Romano P., 2009, MNRAS, 398, 2152
- Fukazawa et al. (2009) Fukazawa Y., Mizuno T., Watanabe S., Kokubun M., Takahashi H., Kawano N., Nishino S., Sasada M., et al. 2009, PASJ, 61, 17
- Goldwurm et al. (2003) Goldwurm A., David P., Foschini L., Gros A., Laurent P., Sauvageon A., Bird A. J., Lerusse L., et al. 2003, A&A, 411, L223
- González-Riestra et al. (2004) González-Riestra R., Oosterbroek T., Kuulkers E., Orr A., Parmar A. N., 2004, A&A, 420, 589
- Götz et al. (2007) Götz D., Falanga M., Senziani F., De Luca A., Schanne S., von Kienlin A., 2007, ApJL, 655, L101
- Götz et al. (2006) Götz D., Schanne S., Rodriguez J., Leyder J.-C., von Kienlin A., Mowlavi N., Mereghetti S., 2006, Astron. Tel., 813, 1
- Gruber et al. (1999) Gruber D. E., Matteson J. L., Peterson L. E., Jung G. V., 1999, ApJ, 520, 124
- in’t Zand (2005) in’t Zand J. J. M., 2005, A&A, 441, L1
- Jain et al. (2009) Jain C., Paul B., Dutta A., 2009, MNRAS, 397, L11
- Kennea & Campana (2006) Kennea J. A., Campana S., 2006, Astron. Tel., 818, 1
- Koyama et al. (2007) Koyama K., Tsunemi H., Dotani T., Bautz M. W., Hayashida K., Tsuru T. G., Matsumoto H., Ogawara Y., et al. 2007, PASJ, 59, 23
- Labanti et al. (2003) Labanti C., Di Cocco G., Ferro G., Gianotti F., Mauri A., Rossi E., Stephen J. B., Traci A., Trifoglio M., 2003, A&A, 411, L149
- Lebrun et al. (2003) Lebrun F., Leray J. P., Lavocat P., Crétolle J., Arquès M., Blondel C., Bonnin C., Bouère A., et al. 2003, A&A, 411, L141
- Leyder et al. (2007) Leyder J.-C., Walter R., Lazos M., Masetti N., Produit N., 2007, A&A, 465, L35
- Lu & Aschenbach (2000) Lu F. J., Aschenbach B., 2000, A&A, 362, 1083
- Lund et al. (2003) Lund N., Budtz-Jørgensen C., Westergaard N. J., Brandt S., Rasmussen I. L., Hornstrup A., et all 2003, A&A, 411, L231
- Masetti et al. (2006) Masetti N., Bassani L., Bazzano A., Dean A. J., Stephen J. B., Walter R., 2006, Astron. Tel., 815, 1
- Mereghetti et al. (2006) Mereghetti S., Sidoli L., Paizis A., Gotz D., 2006, Astron. Tel., 814, 1
- Mitsuda et al. (2007) Mitsuda K., Bautz M., Inoue H., Kelley R. L., Koyama K., Kunieda H., Makishima K., Ogawara Y., et al. 2007, PASJ, 59, 1
- Moretti et al. (2009) Moretti A., Pagani C., Cusumano G., Campana S., Perri M., Abbey A., Ajello M., Beardmore A. P., et al. 2009, A&A, 493, 501
- Mullan (1984) Mullan D. J., 1984, ApJ, 283, 303
- Romano et al. (2009) Romano P., Sidoli L., Cusumano G., Evans P. A., Ducci L., Krimm H. A., Vercellone S., Page K. L., et al. 2009, MNRAS, 392, 45
- Romano et al. (2009) Romano P., Sidoli L., Cusumano G., La Parola V., Vercellone S., Pagani C., Ducci L., Mangano V., Cummings J., Krimm H. A., Guidorzi C., Kennea J. A., Hoversten E. A., Burrows D. N., Gehrels N., 2009, MNRAS, 399, 2021
- Romano et al. (2009) Romano P., Sidoli L., Cusumano G., Vercellone S., Mangano V., Krimm H. A., 2009, ApJ, 696, 2068
- Romano et al. (2007) Romano P., Sidoli L., Mangano V., Mereghetti S., Cusumano G., 2007, A&A, 469, L5
- Romano et al. (2008) Romano P., Sidoli L., Mangano V., Vercellone S., Kennea J. A., Cusumano G., Krimm H. A., Burrows D. N., Gehrels N., 2008, ApJL, 680, L137
- Sguera et al. (2005) Sguera V., Barlow E. J., Bird A. J., Clark D. J., Dean A. J., Hill A. B., Moran L., Shaw S. E., Willis D. R., Bazzano A., Ubertini P., Malizia A., 2005, A&A, 444, 221
- Sguera et al. (2006) Sguera V., Bazzano A., Bird A. J., Dean A. J., Ubertini P., Barlow E. J., Bassani L., Clark D. J., Hill A. B., Malizia A., Molina M., Stephen J. B., 2006, ApJ, 646, 452
- Sidoli (2009) Sidoli L., 2009, Advances in Space Research, 43, 1464
- Sidoli et al. (2006) Sidoli L., Paizis A., Mereghetti S., 2006, A&A, 450, L9
- Sidoli et al. (2009) Sidoli L., Romano P., Ducci L., Paizis A., Cusumano G., Mangano V., Krimm H. A., Vercellone S., Burrows D. N., Kennea J. A., Gehrels N., 2009, MNRAS, 397, 1528
- Sidoli et al. (2009) Sidoli L., Romano P., Mangano V., Cusumano G., Vercellone S., Kennea J. A., Paizis A., Krimm H. A., Burrows D. N., Gehrels N., 2009, ApJ, 690, 120
- Sidoli et al. (2008) Sidoli L., Romano P., Mangano V., Pellizzoni A., Kennea J. A., Cusumano G., Vercellone S., Paizis A., Burrows D. N., Gehrels N., 2008, ApJ, 687, 1230
- Smith et al. (2006) Smith D. M., Heindl W. A., Markwardt C. B., Swank J. H., Negueruela I., Harrison T. E., Huss L., 2006, ApJ, 638, 974
- Takahashi et al. (2007) Takahashi T., Abe K., Endo M., Endo Y., Ezoe Y., Fukazawa Y., Hamaya M., Hirakuri S., et al. 2007, PASJ, 59, 35
- Ubertini et al. (2003) Ubertini P., Lebrun F., Di Cocco G., Bazzano A., Bird A. J., Broenstad K., Goldwurm A., La Rosa G., et al. 2003, A&A, 411, L131
- Vacca et al. (1996) Vacca W. D., Garmany C. D., Shull J. M., 1996, ApJ, 460, 914
- Vaughan et al. (1994) Vaughan B. A., van der Klis M., Wood K. S., Norris J. P., Hertz P., Michelson P. F., van Paradijs J., Lewin W. H. G., Mitsuda K., Penninx W., 1994, ApJ, 435, 362
- Vedrenne et al. (2003) Vedrenne G., Roques J.-P., Schönfelder V., Mandrou P., Lichti G. G., von Kienlin A., Cordier B., Schanne S., et al. 2003, A&A, 411, L63
- Winkler et al. (2003) Winkler C., Courvoisier T., Di Cocco G., Gehrels N., Giménez A., Grebenev S., Hermsen W., Mas-Hesse J. M., et al. 2003, A&A, 411, L1
- Zurita Heras & Chaty (2009) Zurita Heras J. A., Chaty S., 2009, A&A, 493, L1